Bitcoin is up by an impressive 18% since yesterday’s low at ,100. It fell beneath the ,750 (.786 Fib) support yesterday and ended up closing the candle at ,760 (downside 1.414 Fib Extension) after dipping as low as ,100 in the session. The session turned to be one of the worst days bitcoin had seen dollarwise. Today, following the huge rebound, BTC is attempting to recover and break back above the ,750 – K level, once again. This pattern could justify a short-term reversal as bitcoin might form a “W” formation with a double bottom around the -K area – one retest was on Wednesday’s crash, whereas the other one from yesterday. Additionally, on the short-term chart, bitcoin is currently trading at the upper boundary of a descending price channel that
Topics:
Yaz Sheikh considers the following as important: Bitcoin (BTC) Price, BTC Analysis, BTCEUR, BTCGBP, btcusd, btcusdt
This could be interesting, too:
Chayanika Deka writes XRP, SOL, and ADA Inclusion in US Crypto Reserve Pushes Traders on Edge
Chayanika Deka writes Why Arthur Hayes Is Bullish on Bitcoin Under Trump’s Economic Strategy
Mandy Williams writes Why the Bitcoin Market Is Stuck—and the Key Metric That Could Change It: CryptoQuant CEO
Wayne Jones writes Metaplanet Acquires 156 BTC, Bringing Total Holdings to 2,391
Bitcoin is up by an impressive 18% since yesterday’s low at $31,100.
It fell beneath the $36,750 (.786 Fib) support yesterday and ended up closing the candle at $34,760 (downside 1.414 Fib Extension) after dipping as low as $31,100 in the session. The session turned to be one of the worst days bitcoin had seen dollarwise.
Today, following the huge rebound, BTC is attempting to recover and break back above the $36,750 – $37K level, once again.
This pattern could justify a short-term reversal as bitcoin might form a “W” formation with a double bottom around the $30-$31K area – one retest was on Wednesday’s crash, whereas the other one from yesterday.
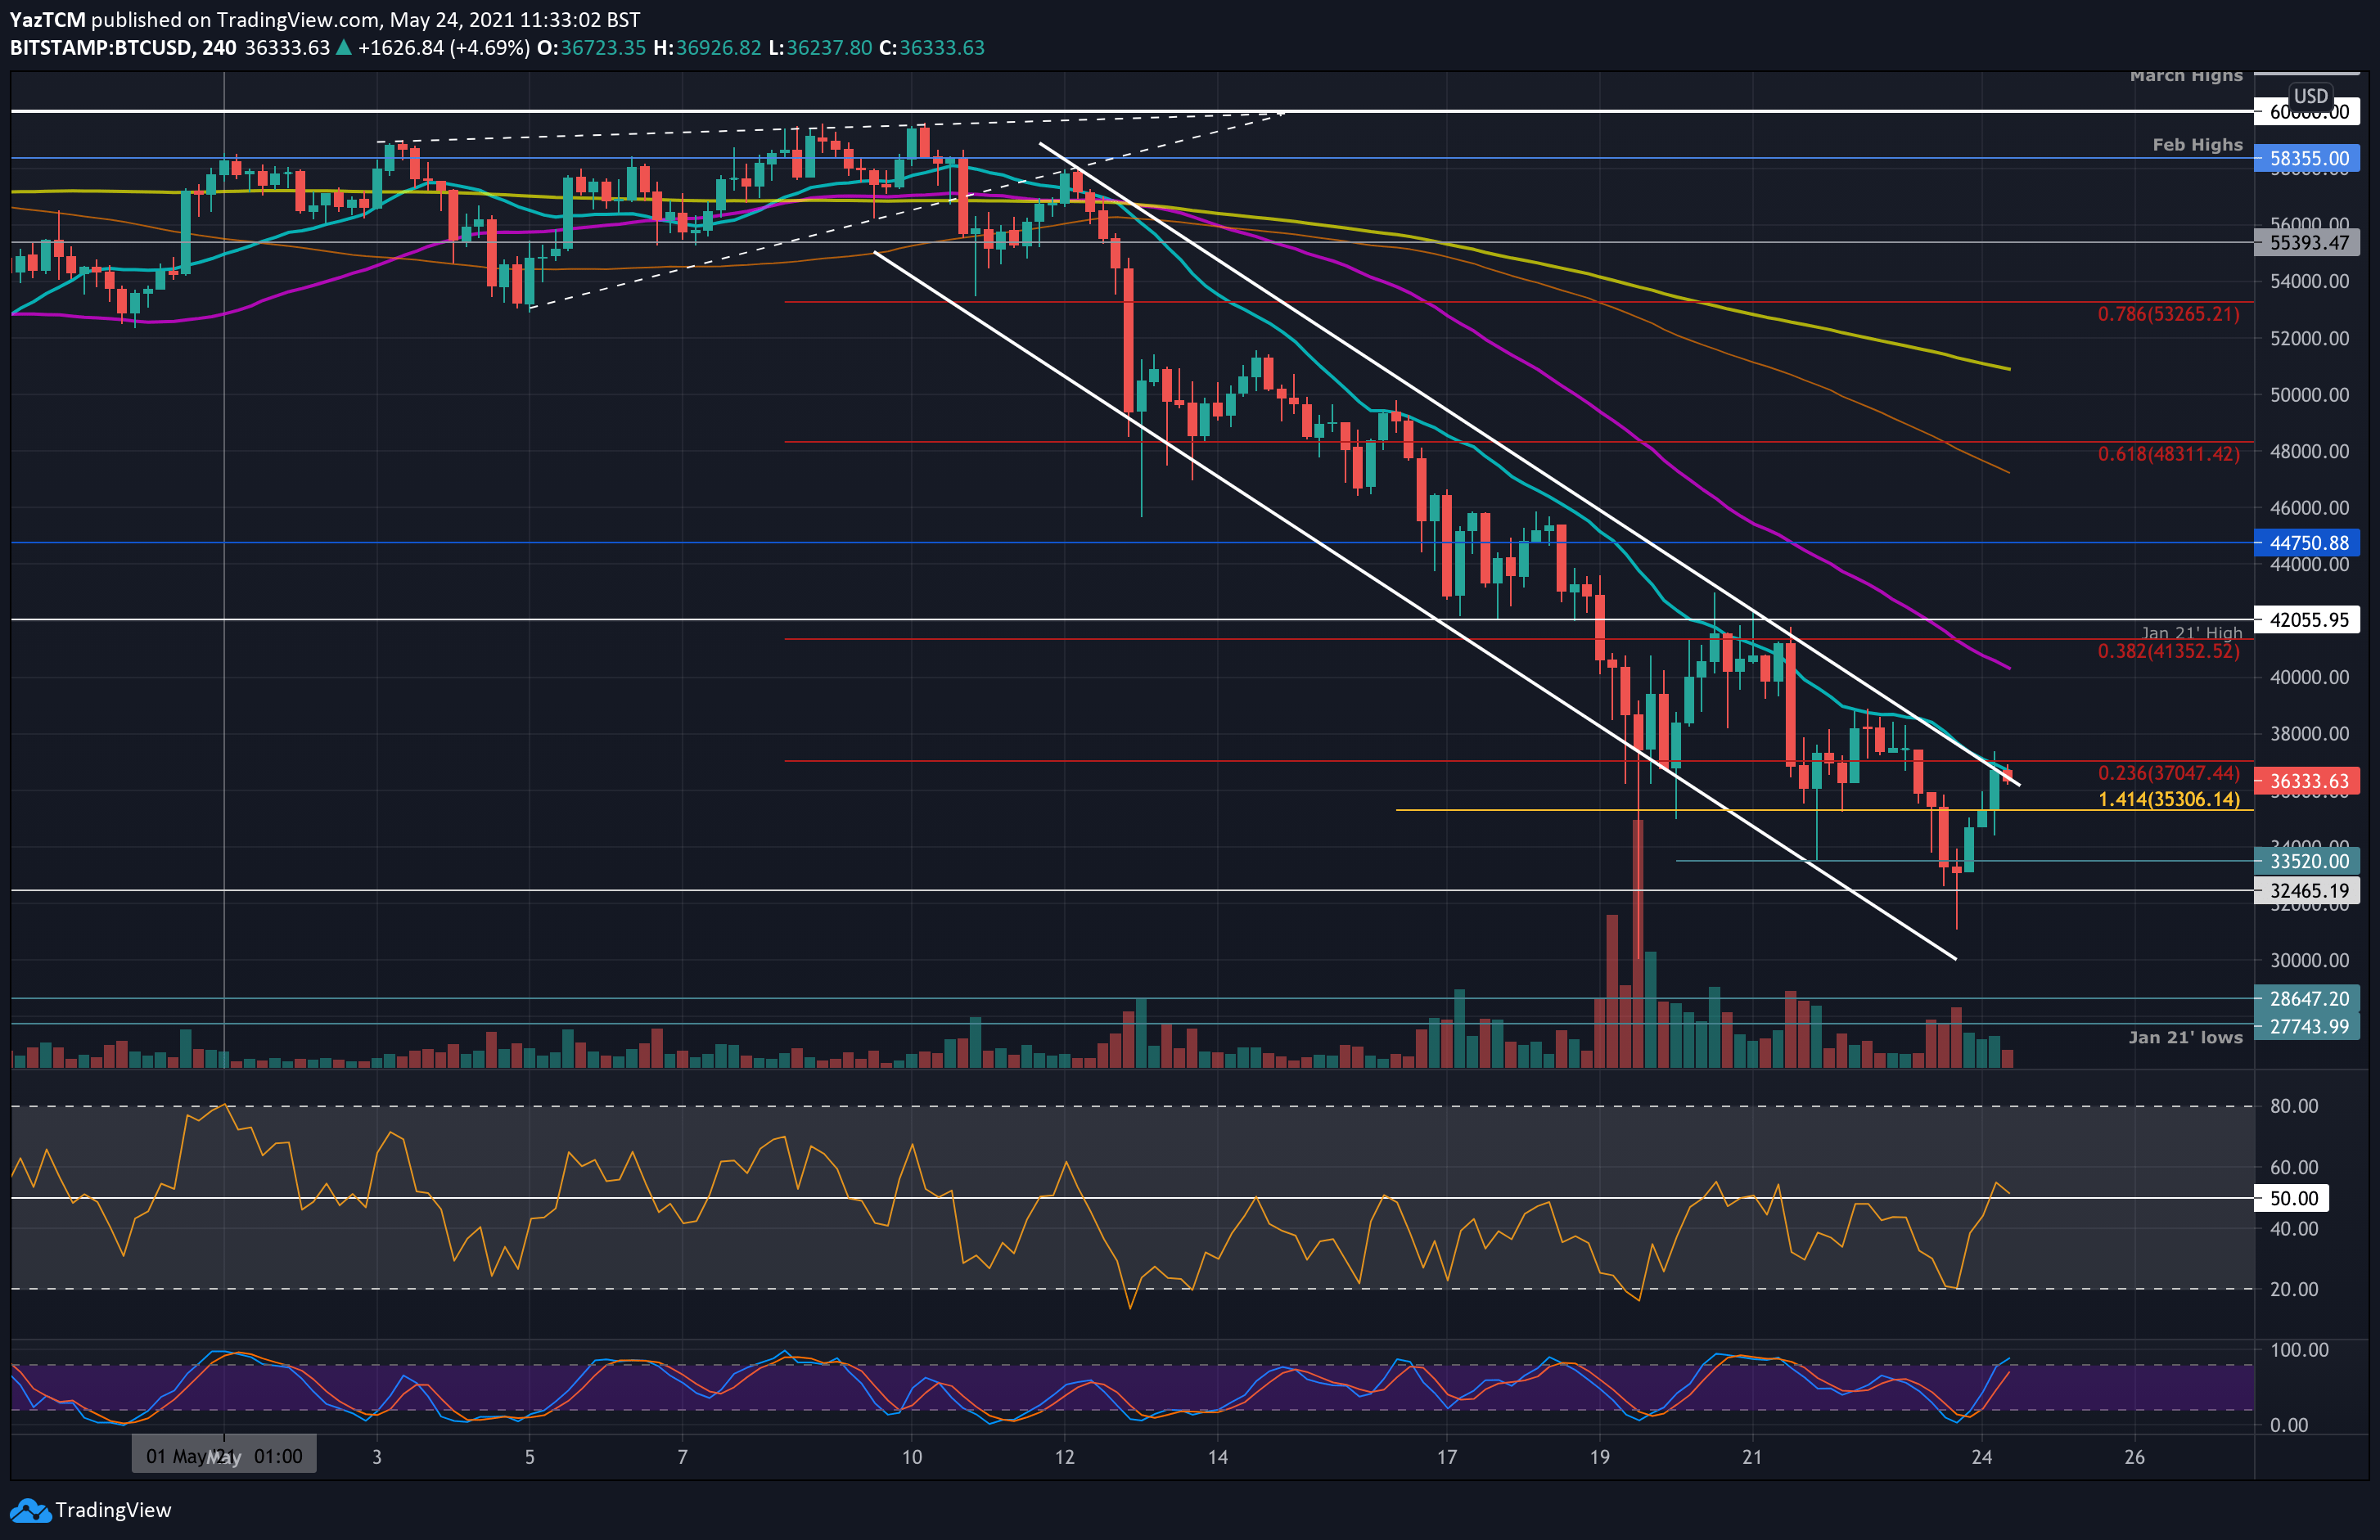
Additionally, on the short-term chart, bitcoin is currently trading at the upper boundary of a descending price channel that we have been tracking since May 10th. A breakout above this level would be the first signal that BTC is ready to continue its recovery towards the $40K area as a first possible target.
In the short-term, the last day’s critical support-turned-resistance of $42K is the first major obstacle, along with the 200-days moving average line at $40.3K as of now. On the other hand, Bitcoin will look to maintain the $30K support.
BTC Price Support and Resistance Levels to Watch
Key Support Levels: $34,760, $33,520, $32,465, $31,100, $30,000.
Key Resistance Levels: $37,000, $38,000, $40,300, $41,350, $42,055.
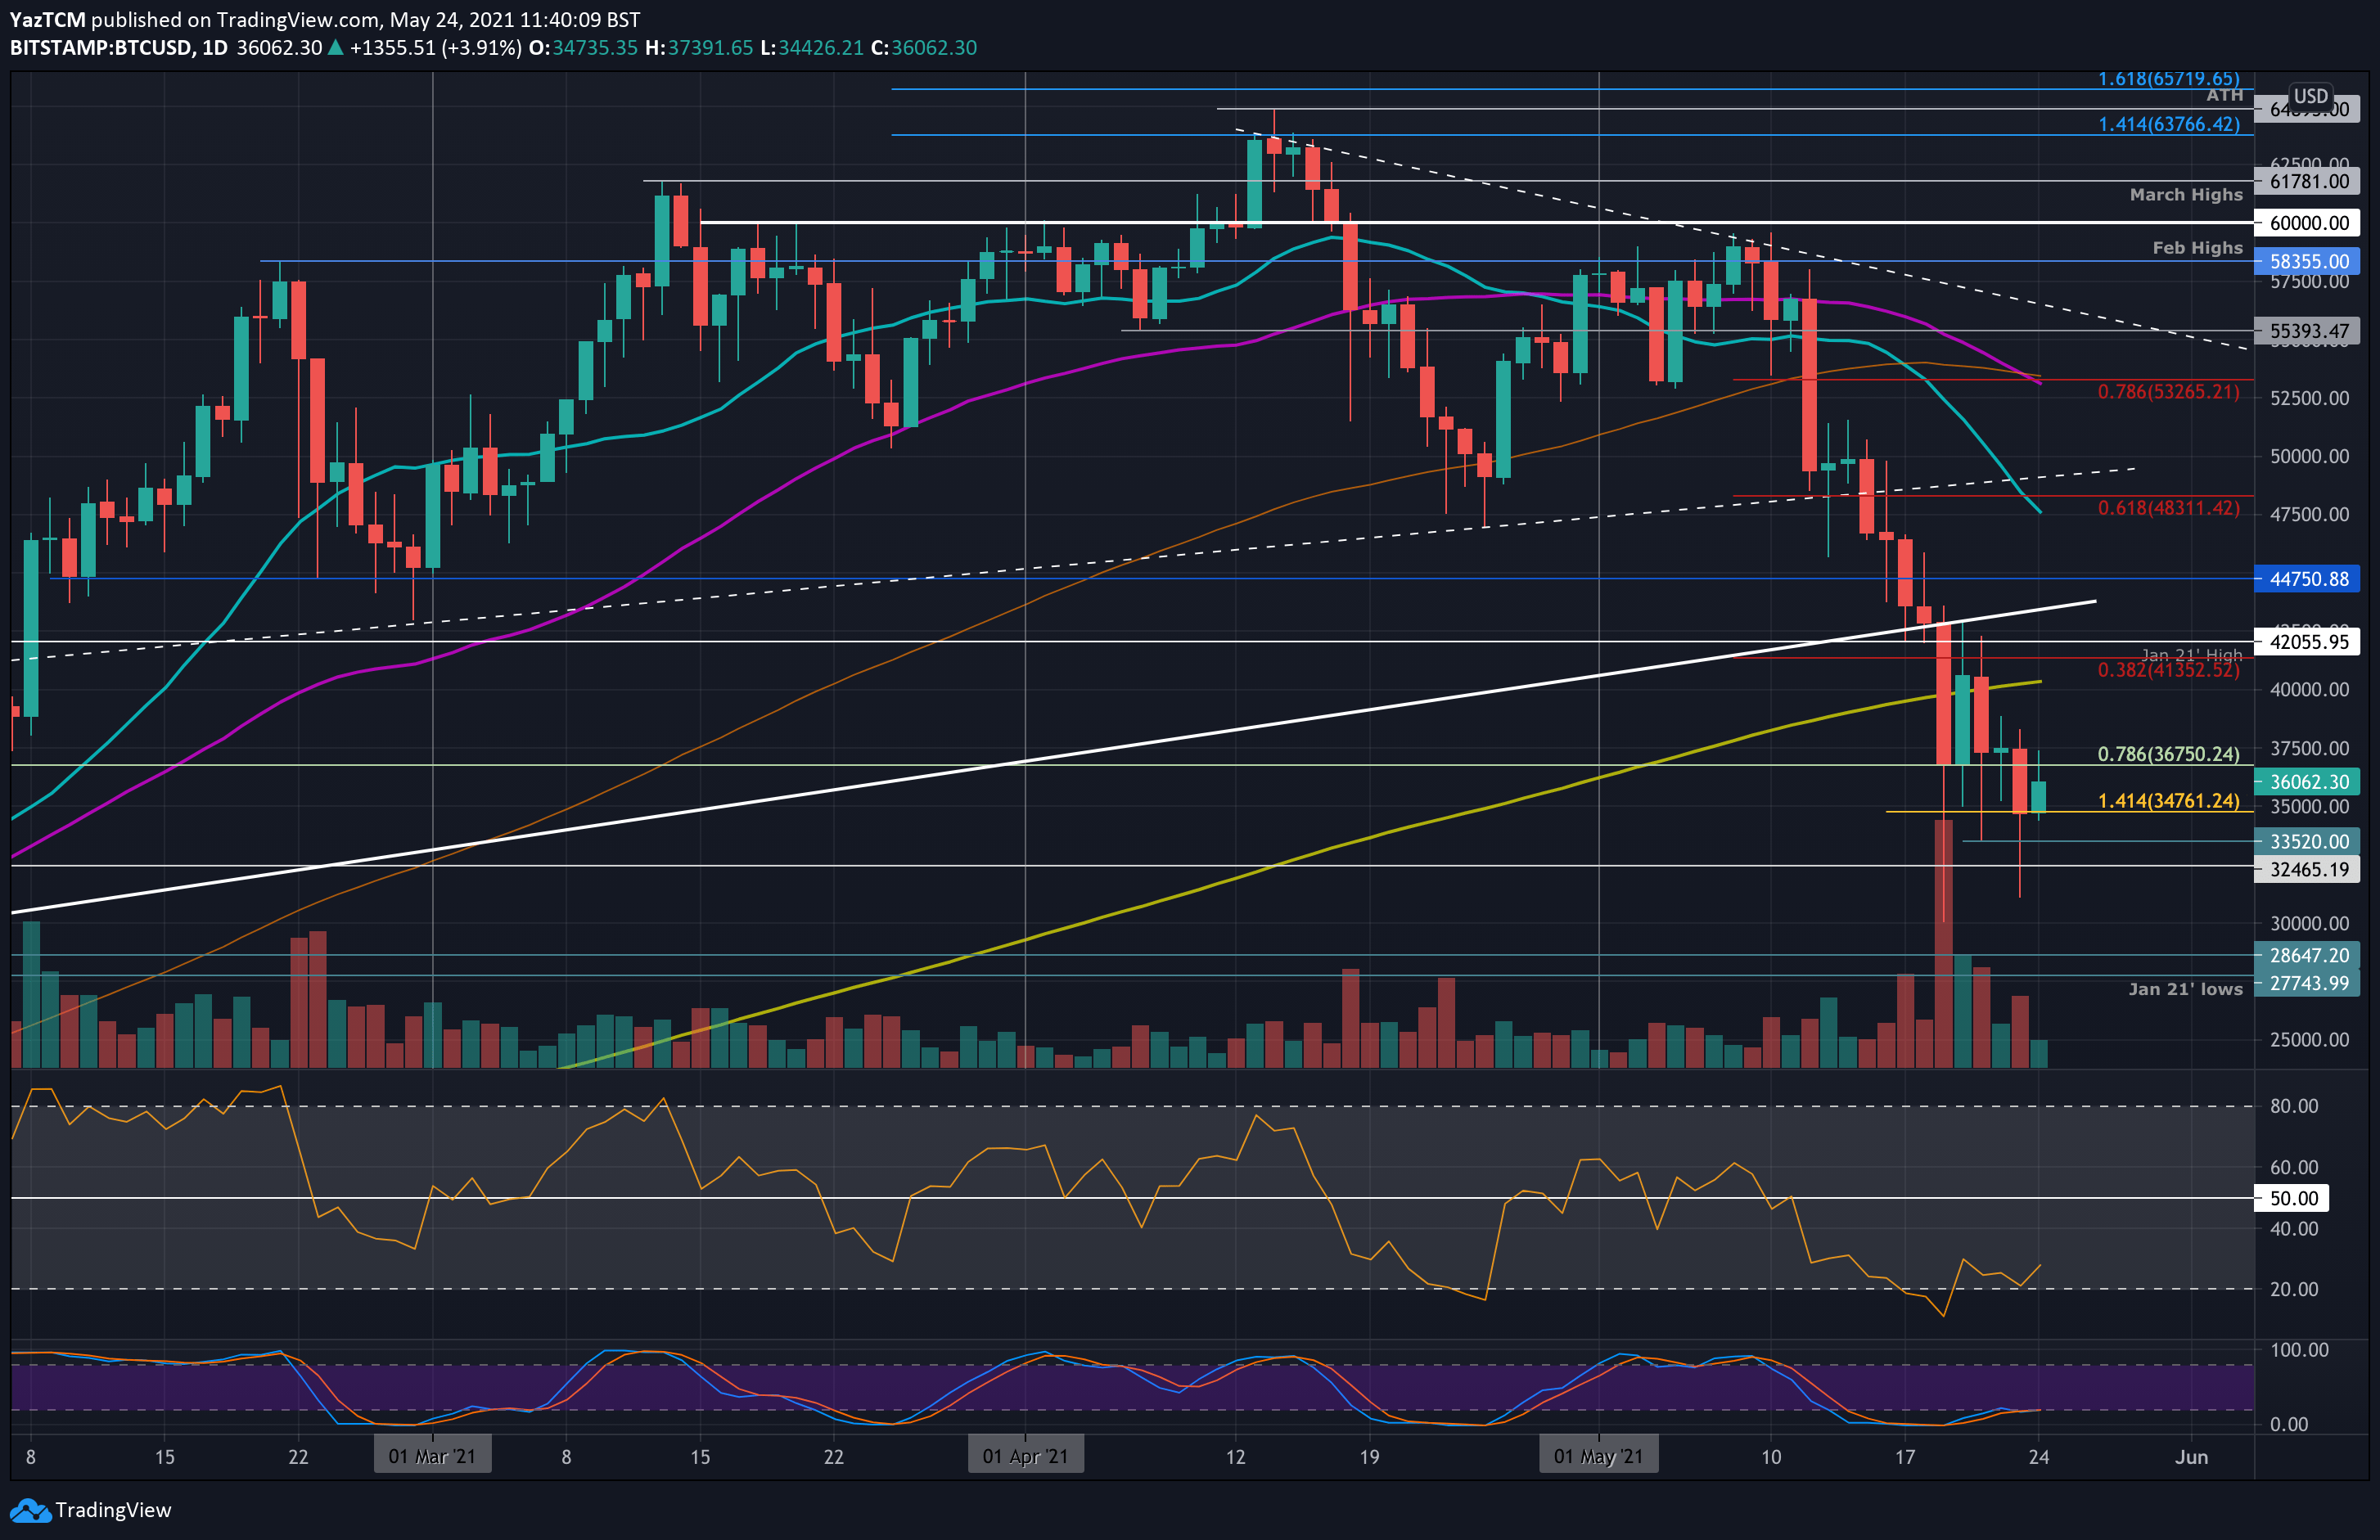
Looking ahead, the first level of support lies at yesterday’s closing price of around $34,760 (downside 1.414 Fib Extension). Beneath this, support lies at $33,520, $32,465, $31,100 (yesterday’s low), and $30,000 (Wednesday’s low).
On the other side, the first resistance lies at $37,000 (bearish .236 Fib) which is strengthened by the upper boundary of the descending price channel. This is followed by $38,000, $40,300 (200-day MA), $41,350 (bearish .382 Fib), $42,055 (Jany 2021 highs and the past 5 days high), and $44,750.
The RSI has bounced from the extremely oversold level at 20 and is starting to point higher. If it can continue beyond 30 and create a higher high, this would be a strong signal that the bearish momentum is quickly fading again.
Another interesting bullish reversal sign is the RSI bullish divergence formed on the daily timeframe, which is usually rare for bitcoin over the past year.
Bitstamp BTC/USD Daily Chart
Bitstamp BTC/USD 4-Hour Chart