Bitcoin climbed by almost 5% so far only today, allowing the cryptocurrency to break the previous ATH at ,781 and set a new one surpassing k, as of writing these lines. This breakout comes exactly one month after setting the previous all-time high on March 13, 2021. Before surging to the new peak today, bitcoin struggled to produce a daily closing candle above ,000 in April. It had dropped as low as ,400 toward the end of last week as it started to recover from there. On Saturday, bitcoin spiked above ,000 but still failed to close a daily candle above the resistance. It continued to struggle to close above ,000 on Sunday and Monday. However, the strong breakout today, as reflected on the daily RSI indicator, suggests that the candle should certainly
Topics:
Yaz Sheikh considers the following as important: Bitcoin (BTC) Price, BTC Analysis, BTCEUR, BTCGBP, btcusd, btcusdt
This could be interesting, too:
Chayanika Deka writes XRP, SOL, and ADA Inclusion in US Crypto Reserve Pushes Traders on Edge
Chayanika Deka writes Why Arthur Hayes Is Bullish on Bitcoin Under Trump’s Economic Strategy
Mandy Williams writes Why the Bitcoin Market Is Stuck—and the Key Metric That Could Change It: CryptoQuant CEO
Wayne Jones writes Metaplanet Acquires 156 BTC, Bringing Total Holdings to 2,391
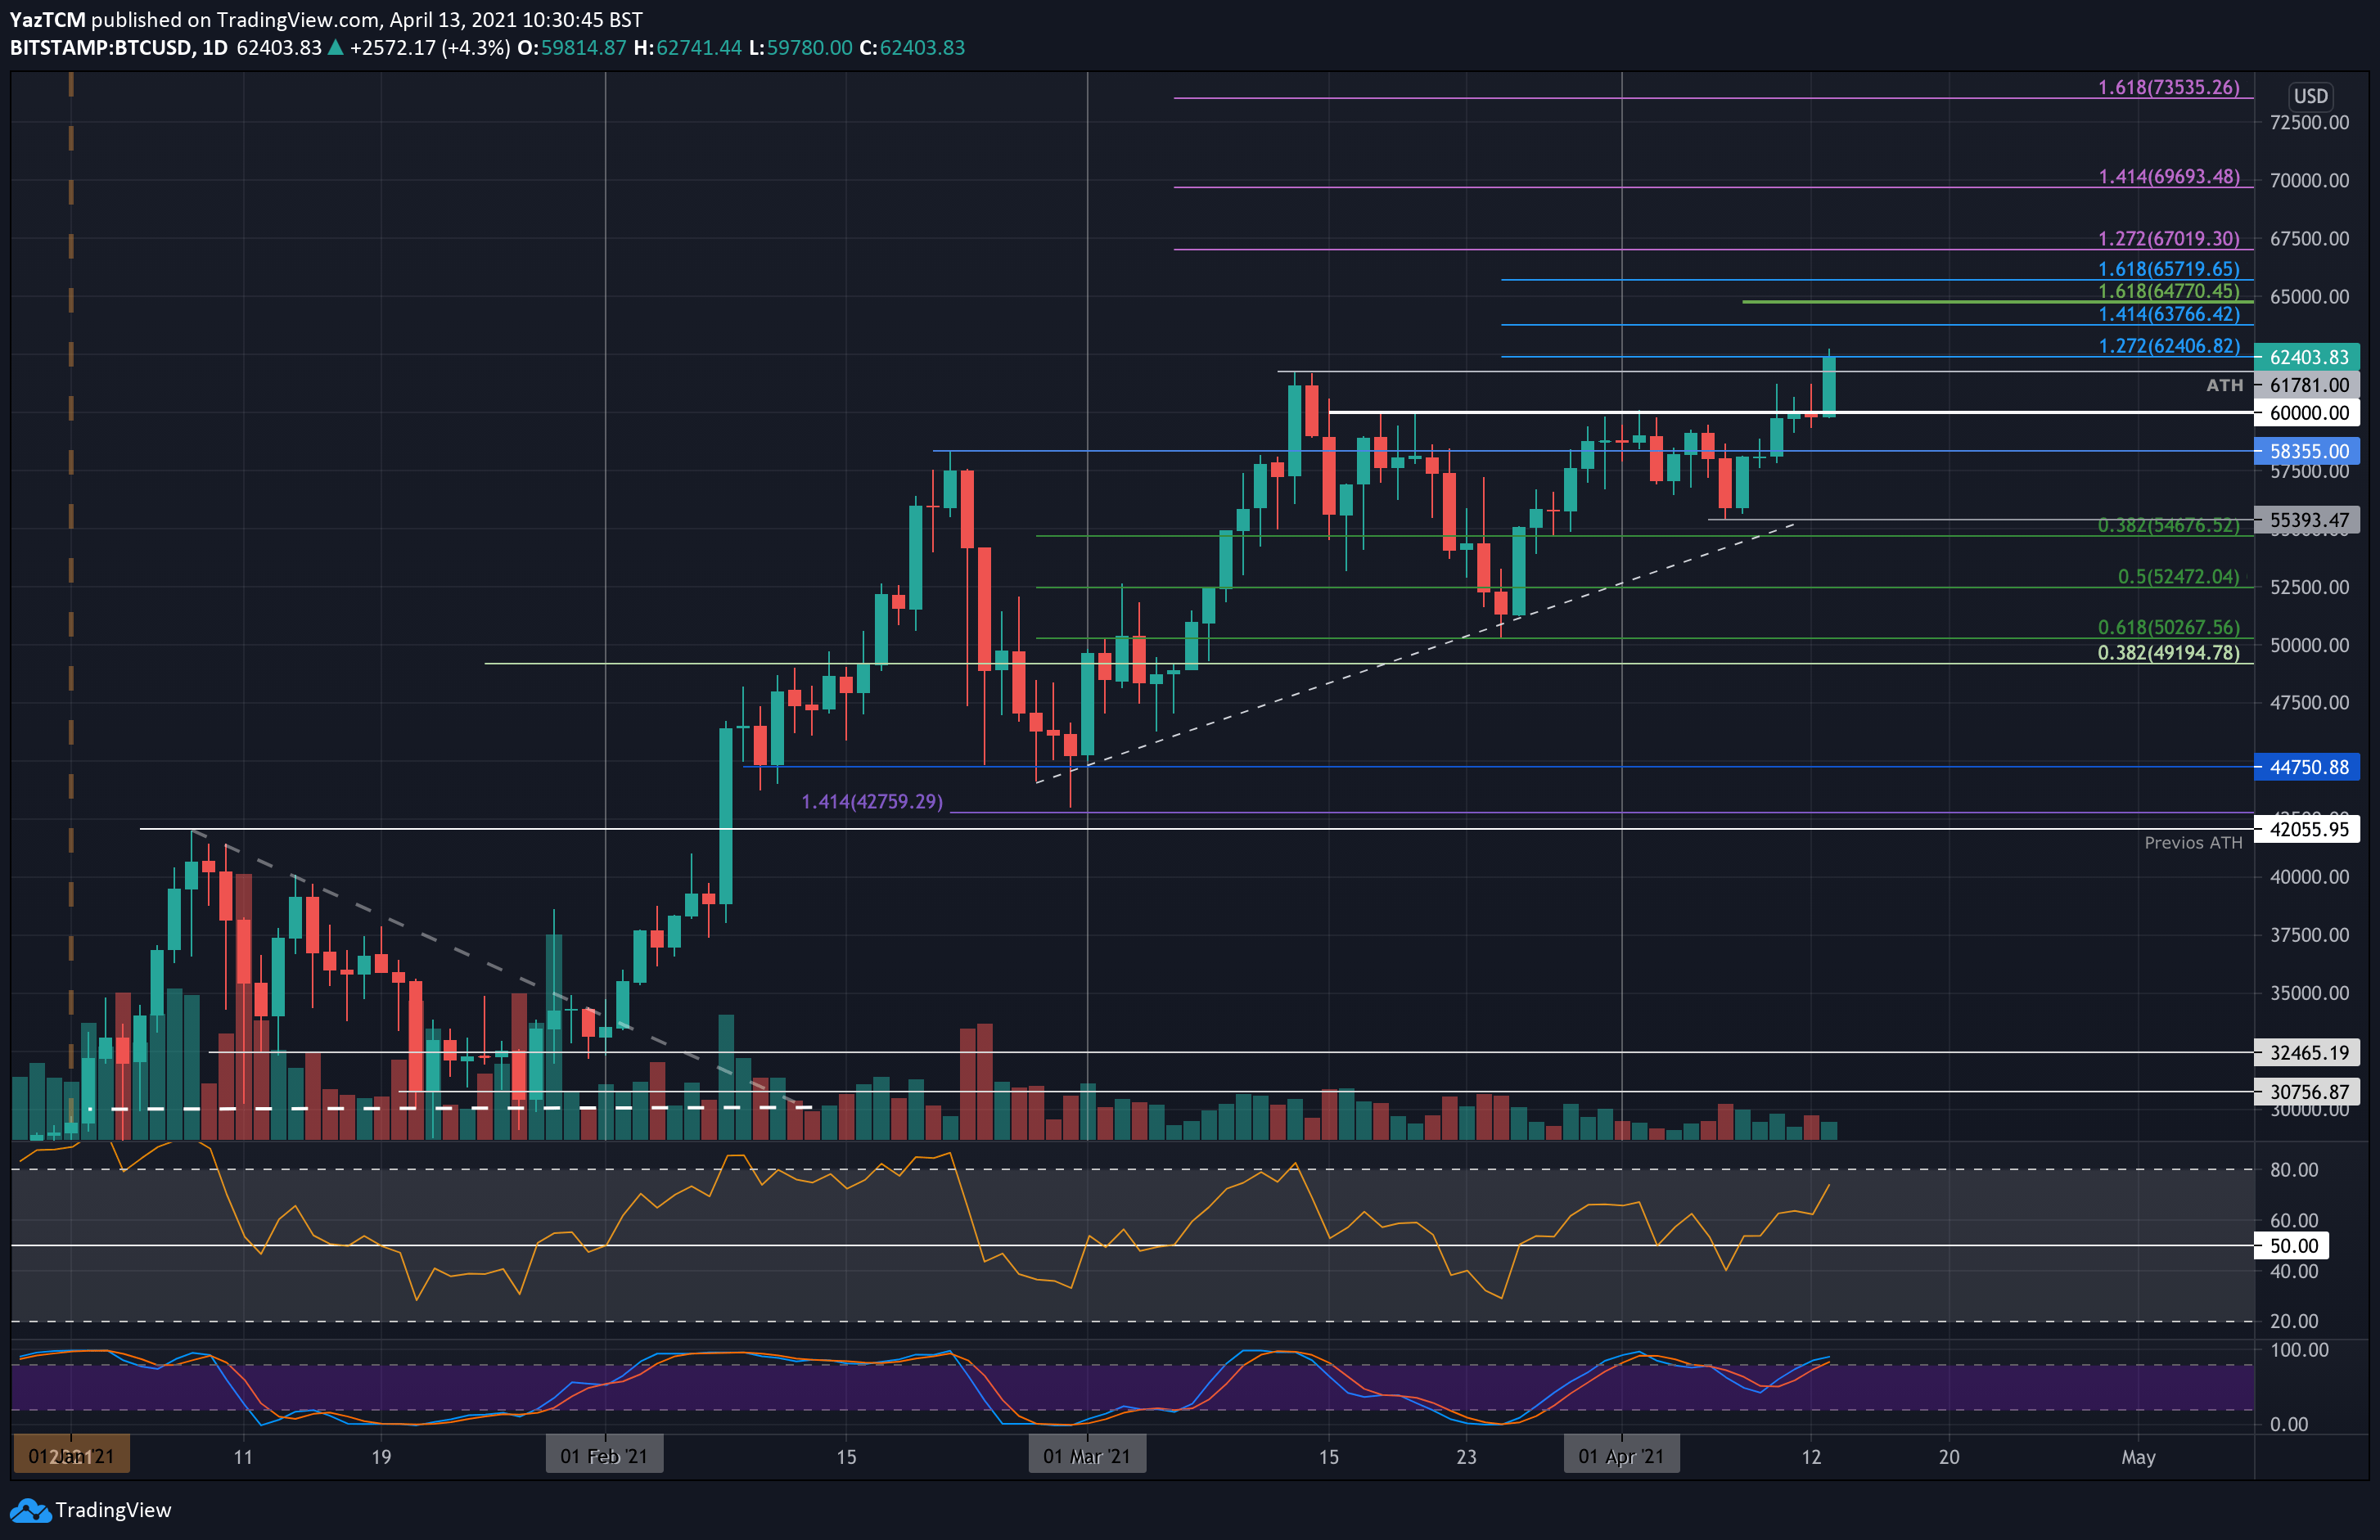
Bitcoin climbed by almost 5% so far only today, allowing the cryptocurrency to break the previous ATH at $61,781 and set a new one surpassing $63k, as of writing these lines. This breakout comes exactly one month after setting the previous all-time high on March 13, 2021.
Before surging to the new peak today, bitcoin struggled to produce a daily closing candle above $60,000 in April. It had dropped as low as $55,400 toward the end of last week as it started to recover from there. On Saturday, bitcoin spiked above $60,000 but still failed to close a daily candle above the resistance.
It continued to struggle to close above $60,000 on Sunday and Monday. However, the strong breakout today, as reflected on the daily RSI indicator, suggests that the candle should certainly close above $60,000; however, in crypto as in crypto, everything is possible.
BTC Price Support and Resistance Levels to Watch Next
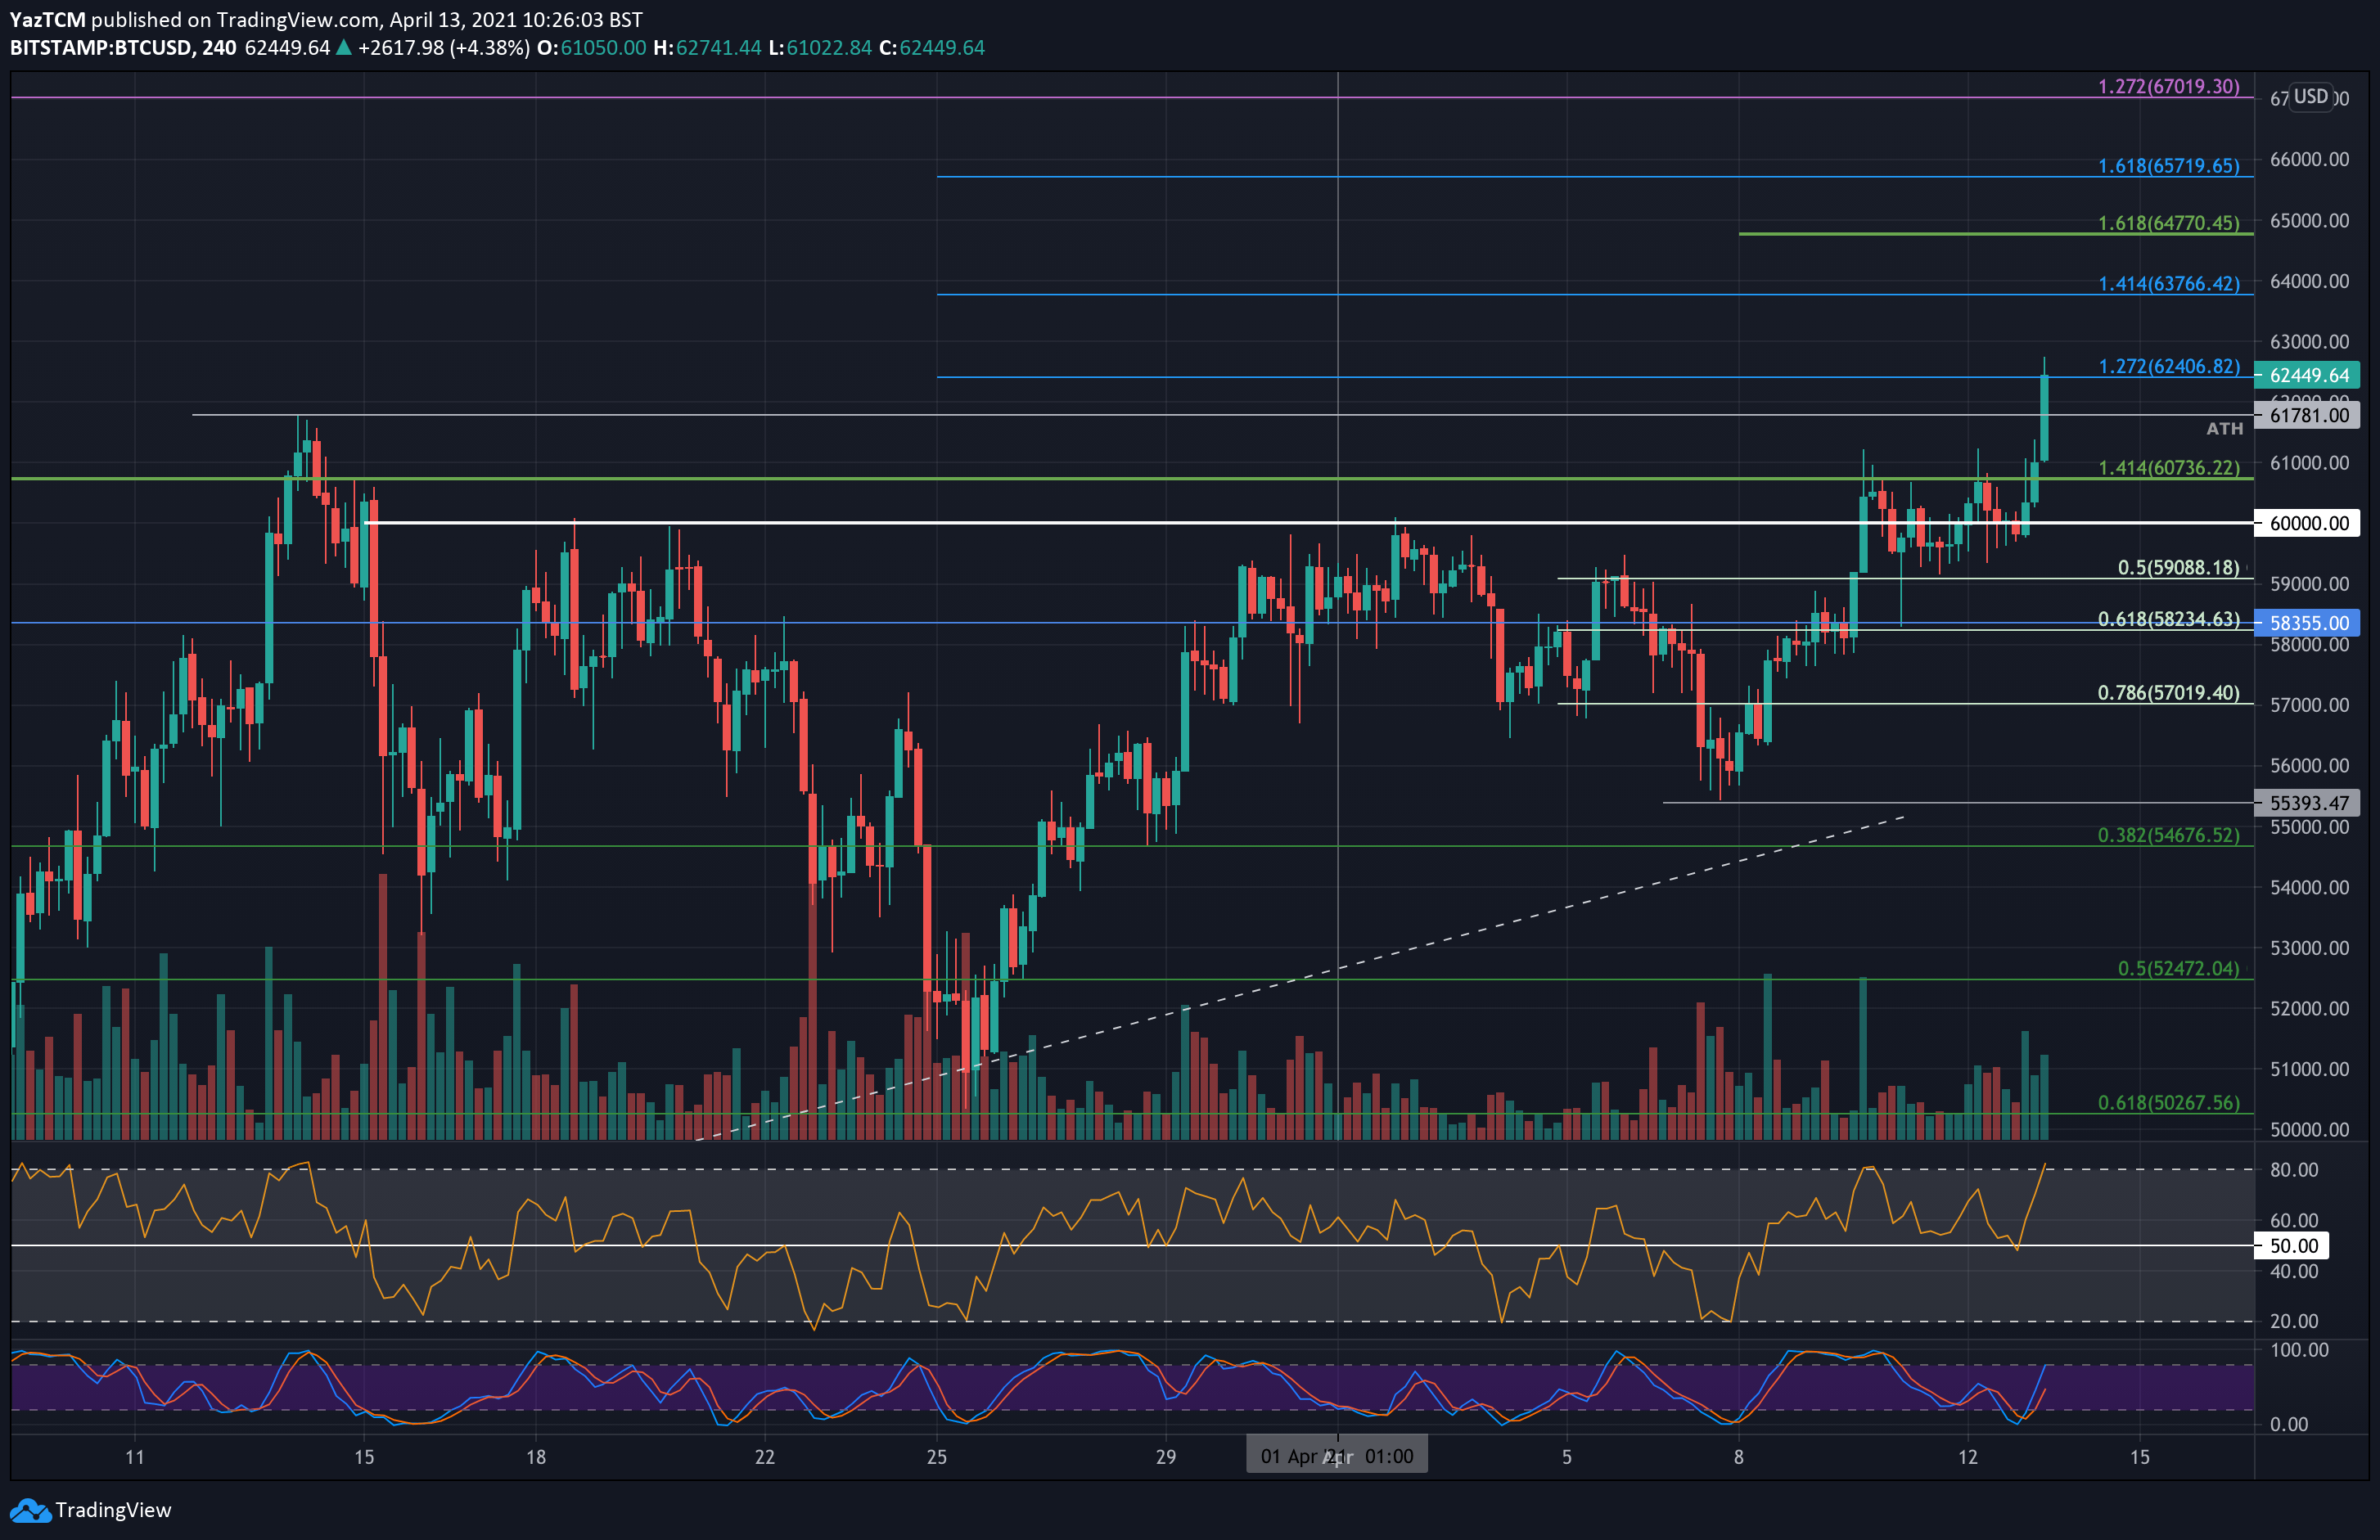
Key Support Levels: $62,400, $61,780, $60,000, $59,070, $58,355, $57,870.
Key Resistance Levels: $63,765, $65,770, $67,020, $69k – $70k
Looking ahead, the first level of resistance is at $63,765 (1.414 Fib Extension), followed by $64,770, $65,720 (1.618 Fib Extension), and $67,020 (1.272 Fib Extensopn – marked purple). Higher above lies previous target and benchmark level of $69 – $70k.
On the other side, the first support lies around $62,400 (1.272 Fib Extension), this is followed by the previous March-13 ATH of $61,780, and the psychological level of $60,000 which served as a strong resistance until today. Further down lies $58,355 (February high), and $57,870 (20-day EMA).
The daily RSI is rising again and is showing the highest momentum so far during the month of April. It is still not overbought, suggesting there is room for BTC to push even higher. Also, all bearish divergence on the smaller timeframes is now invalidated, following the recent breakout.
Bitstamp BTC/USD Daily Chart
Bitstamp BTC/USD 4-Hour Chart