Bitcoin continued to surge by another 7.5% today, allowing the price to record a new ATH at ,216, according to Bitstamp. BTC has since dropped slightly as it trades, around the ,5K range, but the bulls are still all around since Tesla had announced the company’s purchase of .5 billion worth of BTC.On a weekly timeframe, Bitcoin is up 40% (!). Yesterday, we highlighted an ascending price channel, as shown on the following short term’s 4-hour chart. Toward the end of yesterday, Bitcoin surged above the channel’s upper boundary and continued towards a new ATH.However, it could not close a 4-hour candle above the critical resistance at ,350 (1.272 Fib Extension – yellow) and has since dropped lower.Over the past hours, Bitcoin went on an expected correction following the massive
Topics:
Yaz Sheikh considers the following as important: Bitcoin (BTC) Price, BTC Analysis, BTCEUR, BTCGBP, btcusd, btcusdt
This could be interesting, too:
Chayanika Deka writes XRP, SOL, and ADA Inclusion in US Crypto Reserve Pushes Traders on Edge
Chayanika Deka writes Why Arthur Hayes Is Bullish on Bitcoin Under Trump’s Economic Strategy
Mandy Williams writes Why the Bitcoin Market Is Stuck—and the Key Metric That Could Change It: CryptoQuant CEO
Wayne Jones writes Metaplanet Acquires 156 BTC, Bringing Total Holdings to 2,391
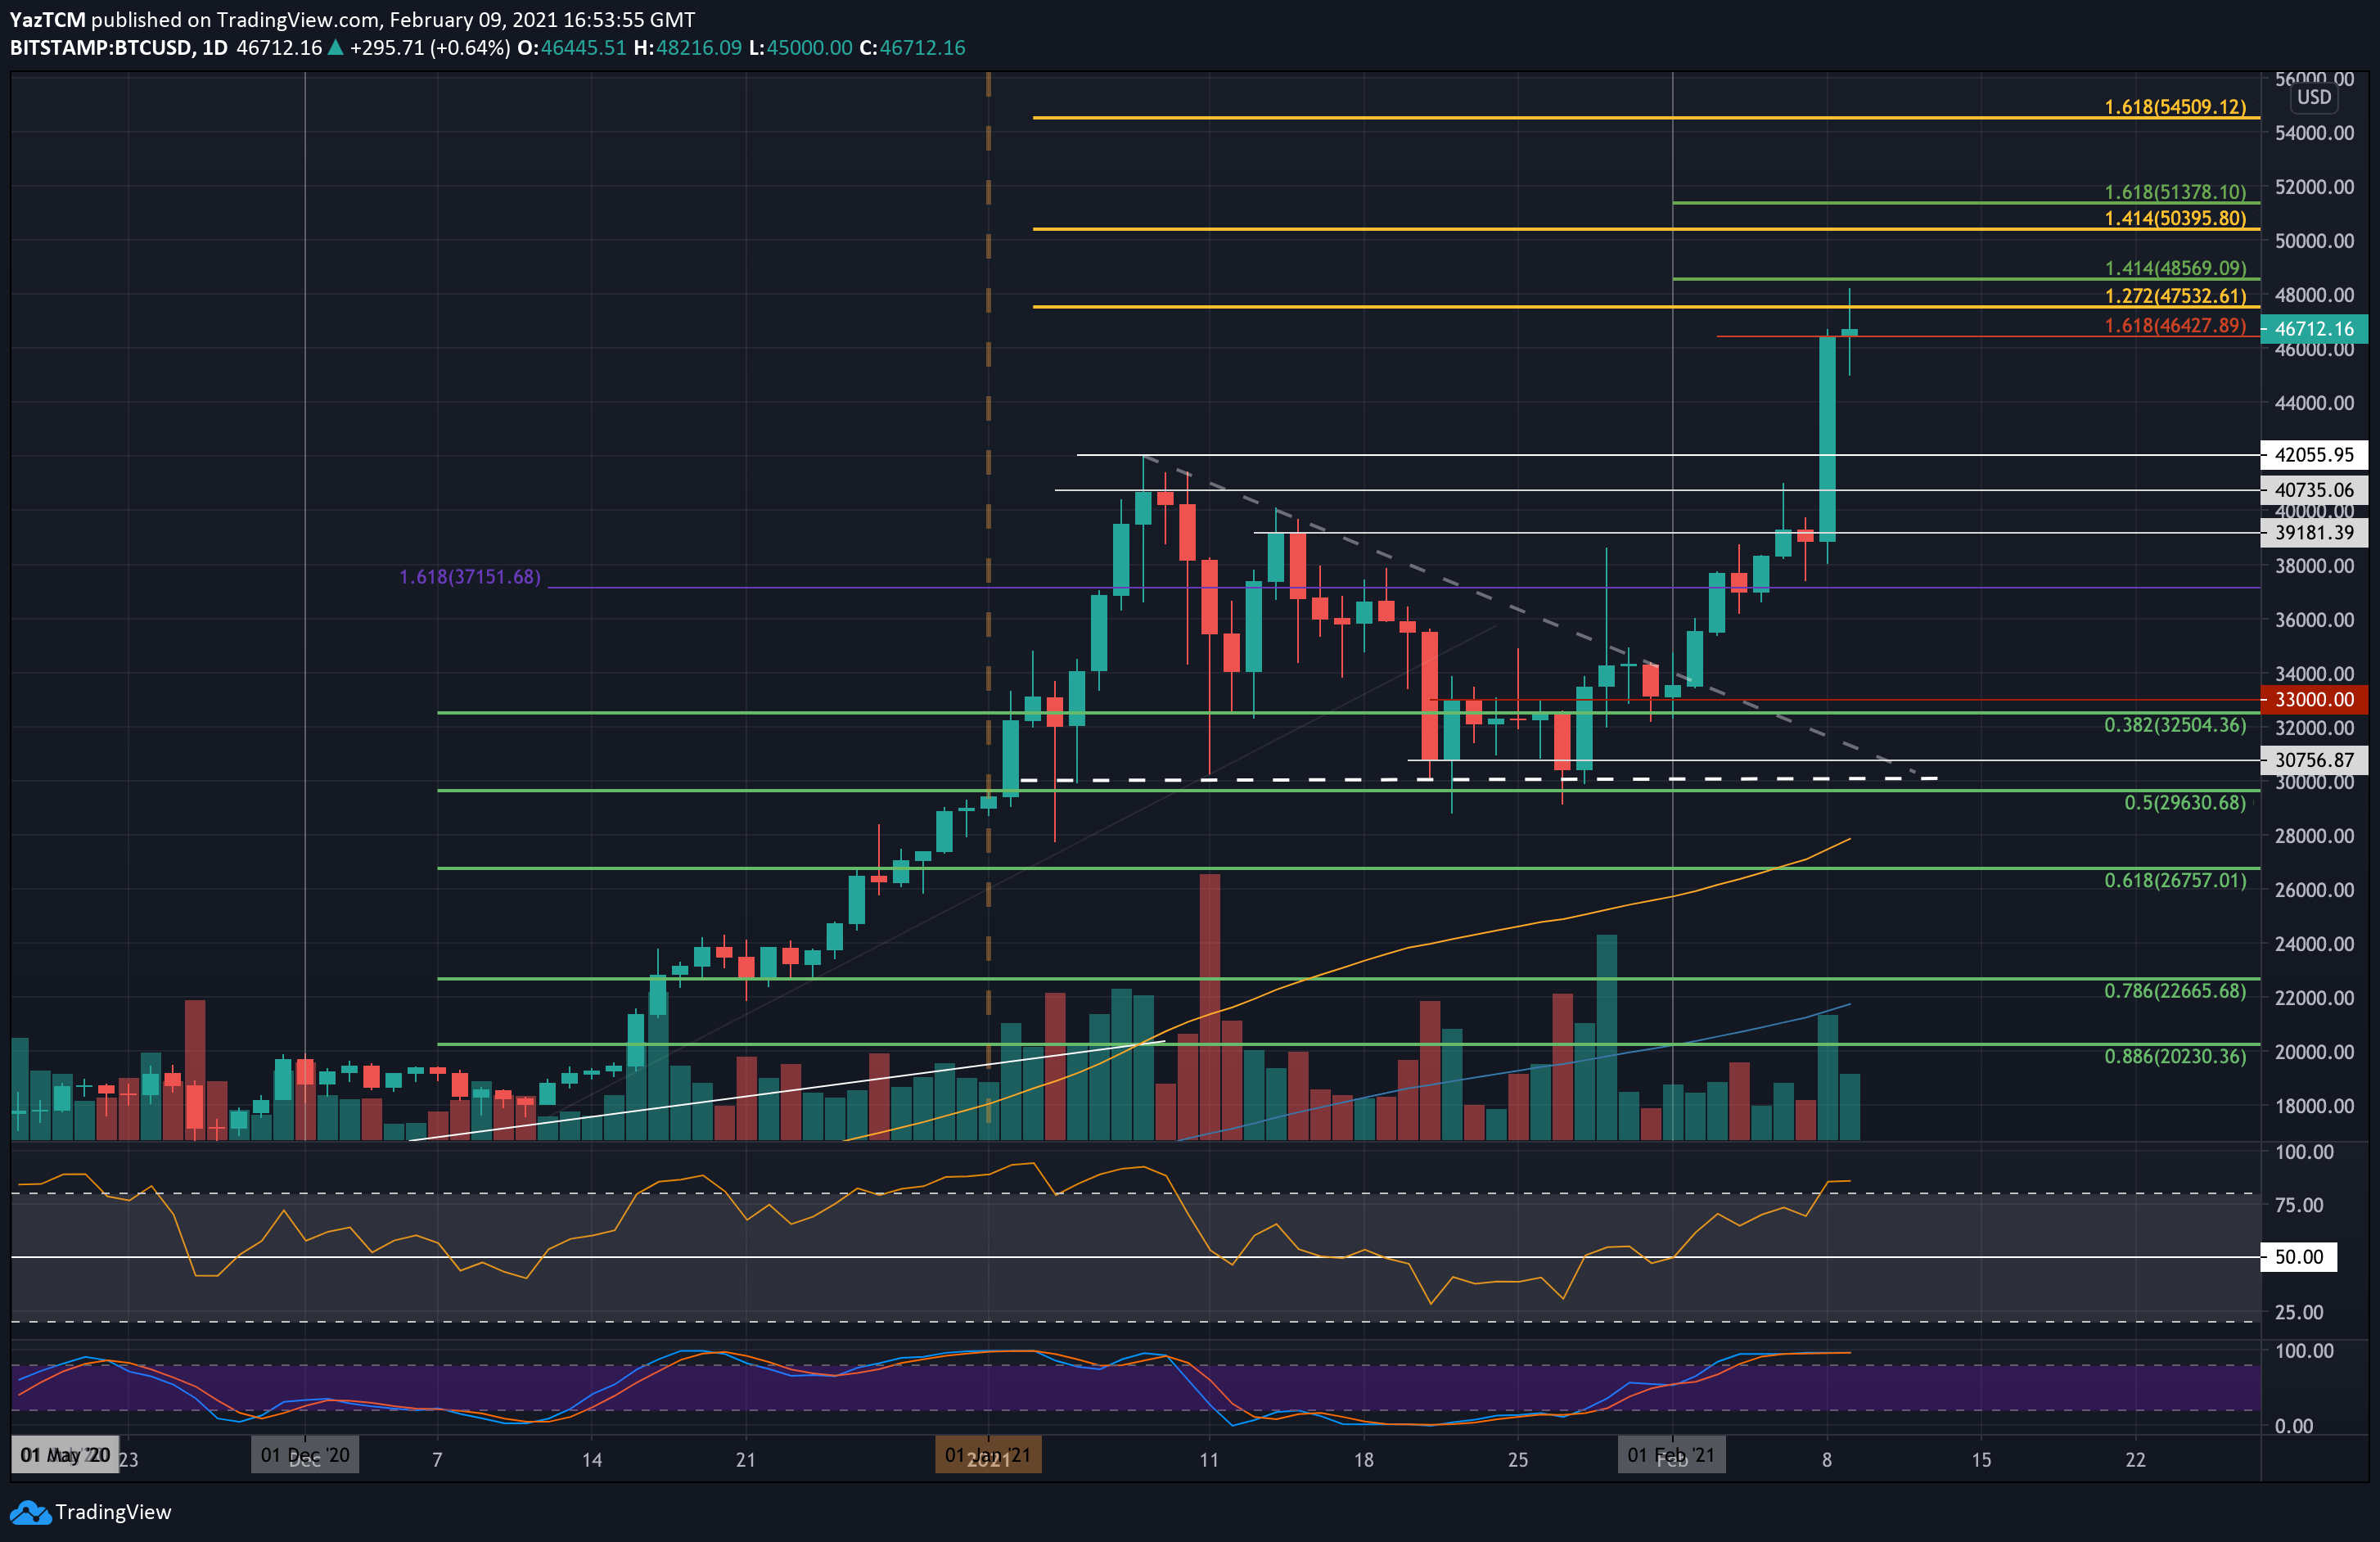
Bitcoin continued to surge by another 7.5% today, allowing the price to record a new ATH at $48,216, according to Bitstamp. BTC has since dropped slightly as it trades, around the $46,5K range, but the bulls are still all around since Tesla had announced the company’s purchase of $1.5 billion worth of BTC.
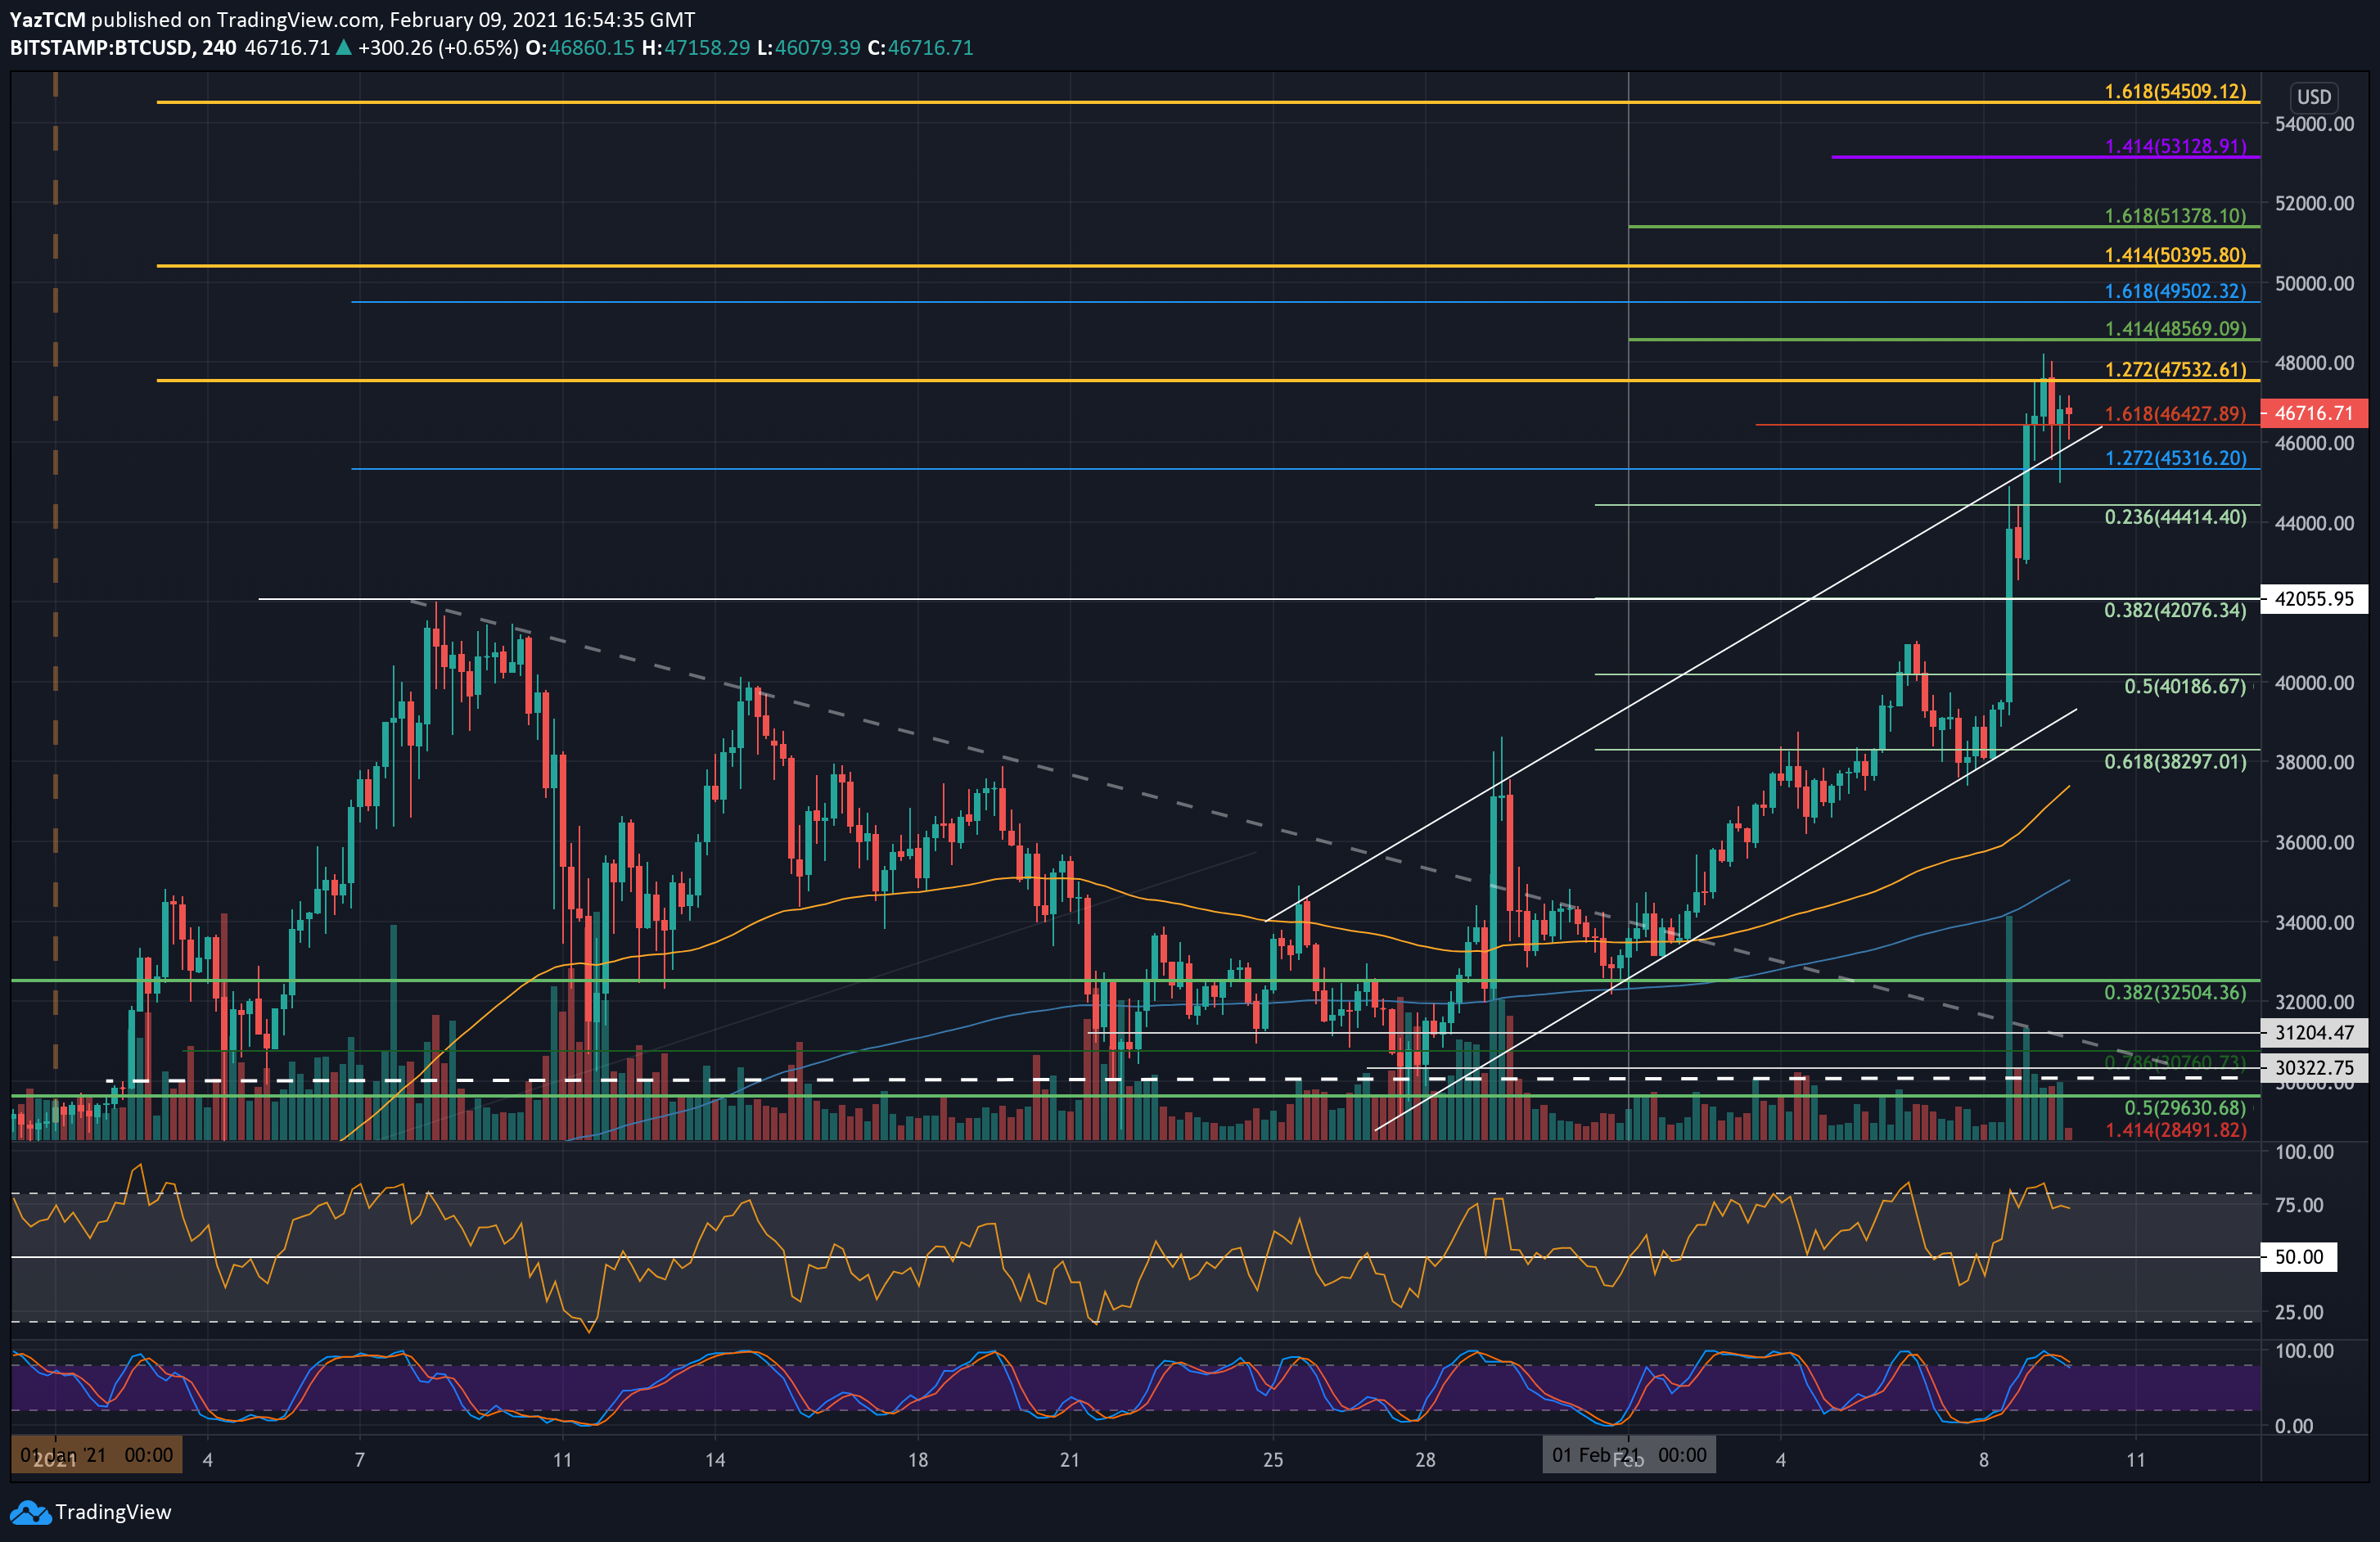
On a weekly timeframe, Bitcoin is up 40% (!). Yesterday, we highlighted an ascending price channel, as shown on the following short term’s 4-hour chart. Toward the end of yesterday, Bitcoin surged above the channel’s upper boundary and continued towards a new ATH.
However, it could not close a 4-hour candle above the critical resistance at $47,350 (1.272 Fib Extension – yellow) and has since dropped lower.
Over the past hours, Bitcoin went on an expected correction following the massive daily rally (from $39K to $48K), reaching as low as $45,000 but quickly rebounded to reach the area where it trades now. BTC price remains above the ascending price channel and very likely to continue surging toward the psychological level of $50,000.
BTC Price Support and Resistance Levels to Watch
Key Support Levels: $45,000, $44,415, $44,000, $42,000, $40,200.
Key Resistance Levels: $47,350, $48,215 – $48,570, $49,500, $50,000, $51,380.
Looking ahead, the first resistance lies at $47,350 (1.272 Fib extension). This is followed by the current ATH price of $48,216, followed by $48,570 (1.414 Fib Extension – green), $49,500 (1.618 Fib Extension – blue), and of course – the $50,000 benchmark.
Beyond $50,000, the next possible targets lie at $51,380 (1.618 Fib Extension – green), $52,000, and $53,130.
On the other side, the first support lies at $46,000 (the price channel’s upper boundary). This is followed by the recent hour’s low at $45k, $44,414 (.236 Fib), $44,000, and $42,000 (.382 Fib).
Further support lies at $40,200 (.5 Fib), $39,000 (the price channel’s lower boundary), and $38,300 (.618 Fib).
The daily RSI continues to climb and has entered overbought conditions today above 80. However, there is still room before becoming extremely overbought as it was in January (95), indicating the bull run intact and still has room to continue.
Bitstamp BTC/USD Daily Chart
Bitstamp BTC/USD 4-Hour Chart