The heavy correction in Bitcoin’s price continues for a second day with another sharp 17% price plummet only today, and a total of 25% since hitting the current all-time high of K just two days ago.The recent drop is largely attributed to the fact that there was a cascade of long liquidations, causing a snowball effect within the market and driving it even lower. As of now, today’s low lies at ,845, according to Bitstamp.Looking at the bigger picture, Bitcoin has now dropped beneath the ascending price channel that we have been tracking for the entire month of February so far. If BTC closes the daily candle beneath the channel today, there is a high chance that the mentioned above the level of K is not yet the bottom for this correction.The ,750 support is provided by the
Topics:
Yaz Sheikh considers the following as important: Bitcoin (BTC) Price, BTC Analysis, BTCEUR, BTCGBP, btcusd, btcusdt
This could be interesting, too:
Chayanika Deka writes XRP, SOL, and ADA Inclusion in US Crypto Reserve Pushes Traders on Edge
Chayanika Deka writes Why Arthur Hayes Is Bullish on Bitcoin Under Trump’s Economic Strategy
Mandy Williams writes Why the Bitcoin Market Is Stuck—and the Key Metric That Could Change It: CryptoQuant CEO
Wayne Jones writes Metaplanet Acquires 156 BTC, Bringing Total Holdings to 2,391
The heavy correction in Bitcoin’s price continues for a second day with another sharp 17% price plummet only today, and a total of 25% since hitting the current all-time high of $58K just two days ago.
The recent drop is largely attributed to the fact that there was a cascade of long liquidations, causing a snowball effect within the market and driving it even lower. As of now, today’s low lies at $44,845, according to Bitstamp.
Looking at the bigger picture, Bitcoin has now dropped beneath the ascending price channel that we have been tracking for the entire month of February so far. If BTC closes the daily candle beneath the channel today, there is a high chance that the mentioned above the level of $44K is not yet the bottom for this correction.
The $44,750 support is provided by the closing/opening prices from February 10th-11th. It is important to point out that, during the January price drops, Bitcoin fell by a sharp 28% to reach the $30,000 level. If the current price drop falls by a similar vector, it will lead Bitcoin back into the January high support, at around $42,000.
As a reminder, the Bitcoin bull-run of 2017 saw at least six corrections of around 30%. This is part of the game. Yesterday, we mentioned here 4 must-read takeaways following the current correction, which came as a surprise to many traders.
Keep in mind that the market is extremely volatile: use caution when entering positions and a wide range of stop losses.
What’s Next? How Low Can BTC Correction Go From Here?
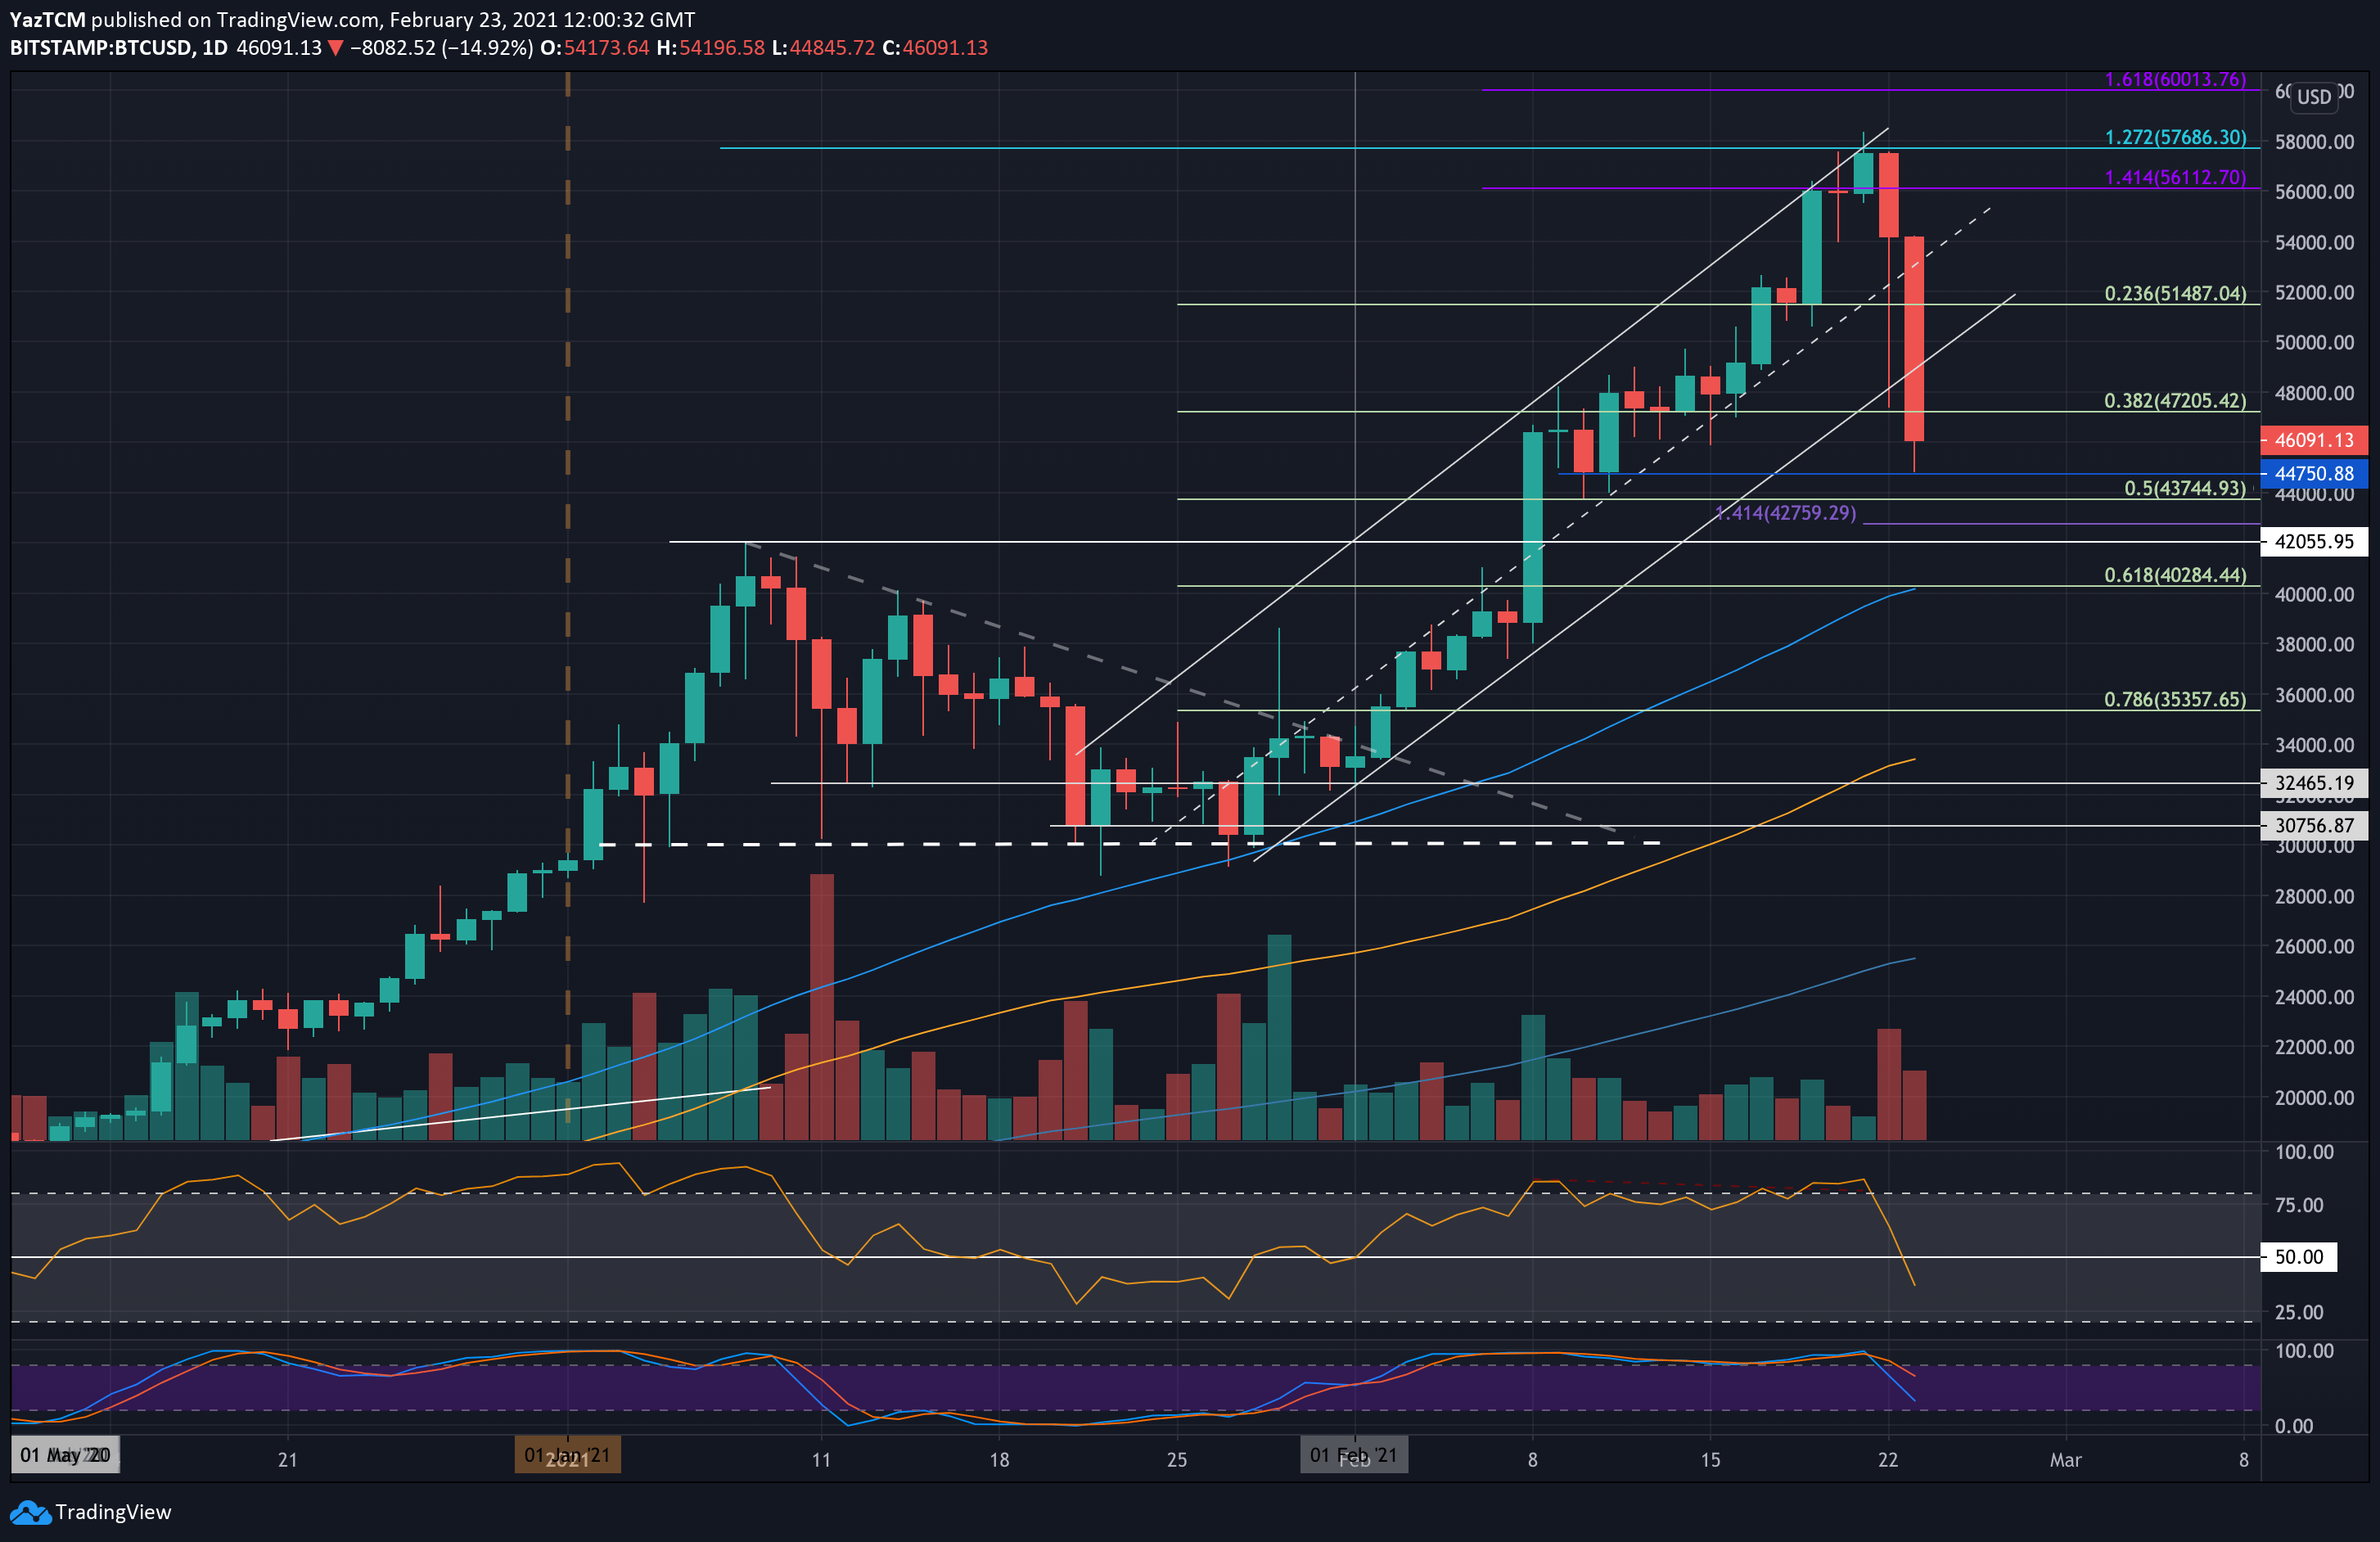
Key Support Levels: $44,750, $43,745, $42,760, $42,050, $40,285 – $40K.
Key Resistance Levels: $47,200, $48,000, $50,000, $51,500, $52,000.
Moving forward, the first level of support lies at today’s low of $44,850. This is followed by $43,745 (.5 Fib), $42,760 (downside 1.414 Fib Extension), $42,050, and $40,285 – $40K (.618 Fib & 50-day moving average line).
Below $40,000, the next siginfaicnt support lies at $38,000, followed by $35,360 (.786 Fib, and January 3rd high).
On the other side, the first resistance lies at $47,200. This is followed by $48,000, $50,000, $51,500, and $52,000.
The daily RSI has now plummeted beneath the midline for the first time in February 2021. This indicates that the bears are now in control of the market momentum in the short-term. If the RSI continues to drop, the bearish momentum will increase and will likely push BTC further down.
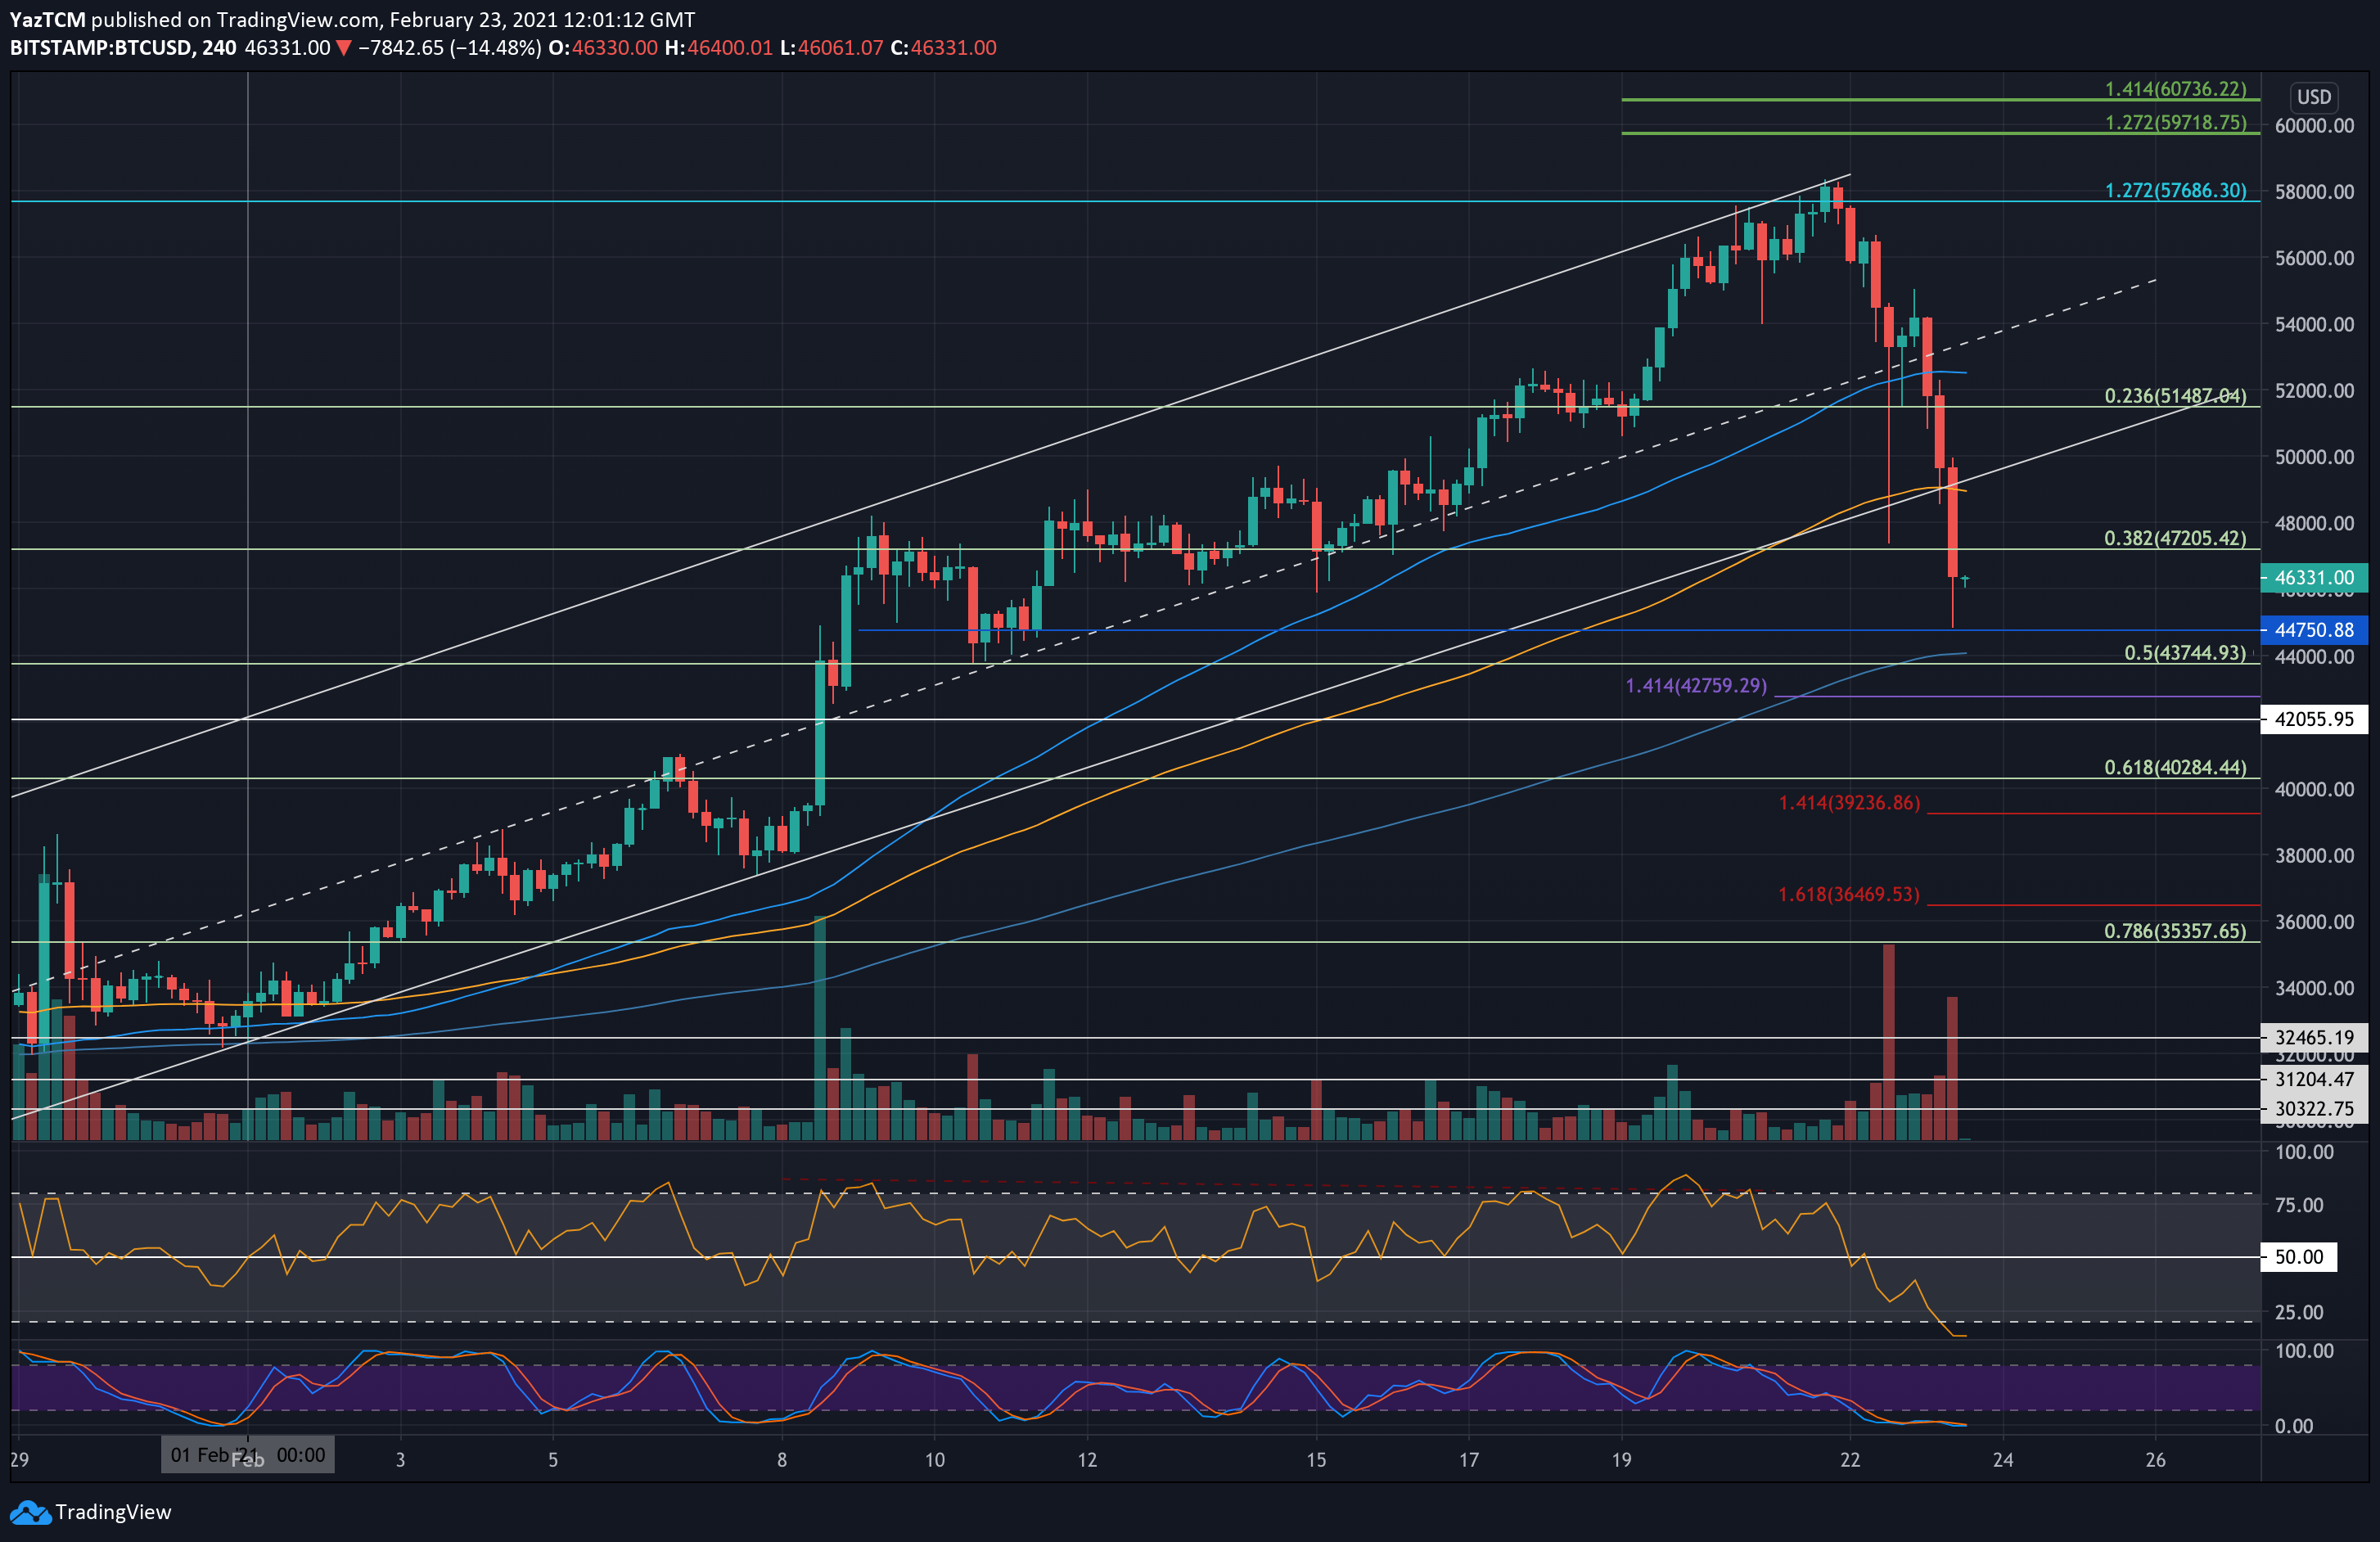
On the 4-hour chart, there are signs of oversold conditions which might trigger a correction over the next hours.
Bitstamp BTC/USD Daily Chart
Bitstamp BTC/USD 4-Hour Chart