Bitcoin continues to struggle after getting rejected retesting the critical 50-days moving average (MA) line yesterday. Unless BTC closes above ,900, which now seems far away, we are going to witness the first full candle body or trading day below the significant level for the first time since October 7, 2020. Quick recap: During the steep price drop on Sunday, bitcoin had penetrated beneath the 50-days MA to reach as low as ,400, where it found support at a .618 Fib Retracement. From there, bitcoin managed to rebound higher as it went on to close the daily candle on Sunday above the 50-days MA. Unfortunately, as the week progressed, weakness got back as BTC fell beneath the 50-days MA and struggled to climb above it. Yesterday, it was rejected from the resistance,
Topics:
Yaz Sheikh considers the following as important: Bitcoin (BTC) Price, BTC Analysis, BTCEUR, BTCGBP, btcusd, btcusdt
This could be interesting, too:
Chayanika Deka writes XRP, SOL, and ADA Inclusion in US Crypto Reserve Pushes Traders on Edge
Chayanika Deka writes Why Arthur Hayes Is Bullish on Bitcoin Under Trump’s Economic Strategy
Mandy Williams writes Why the Bitcoin Market Is Stuck—and the Key Metric That Could Change It: CryptoQuant CEO
Wayne Jones writes Metaplanet Acquires 156 BTC, Bringing Total Holdings to 2,391
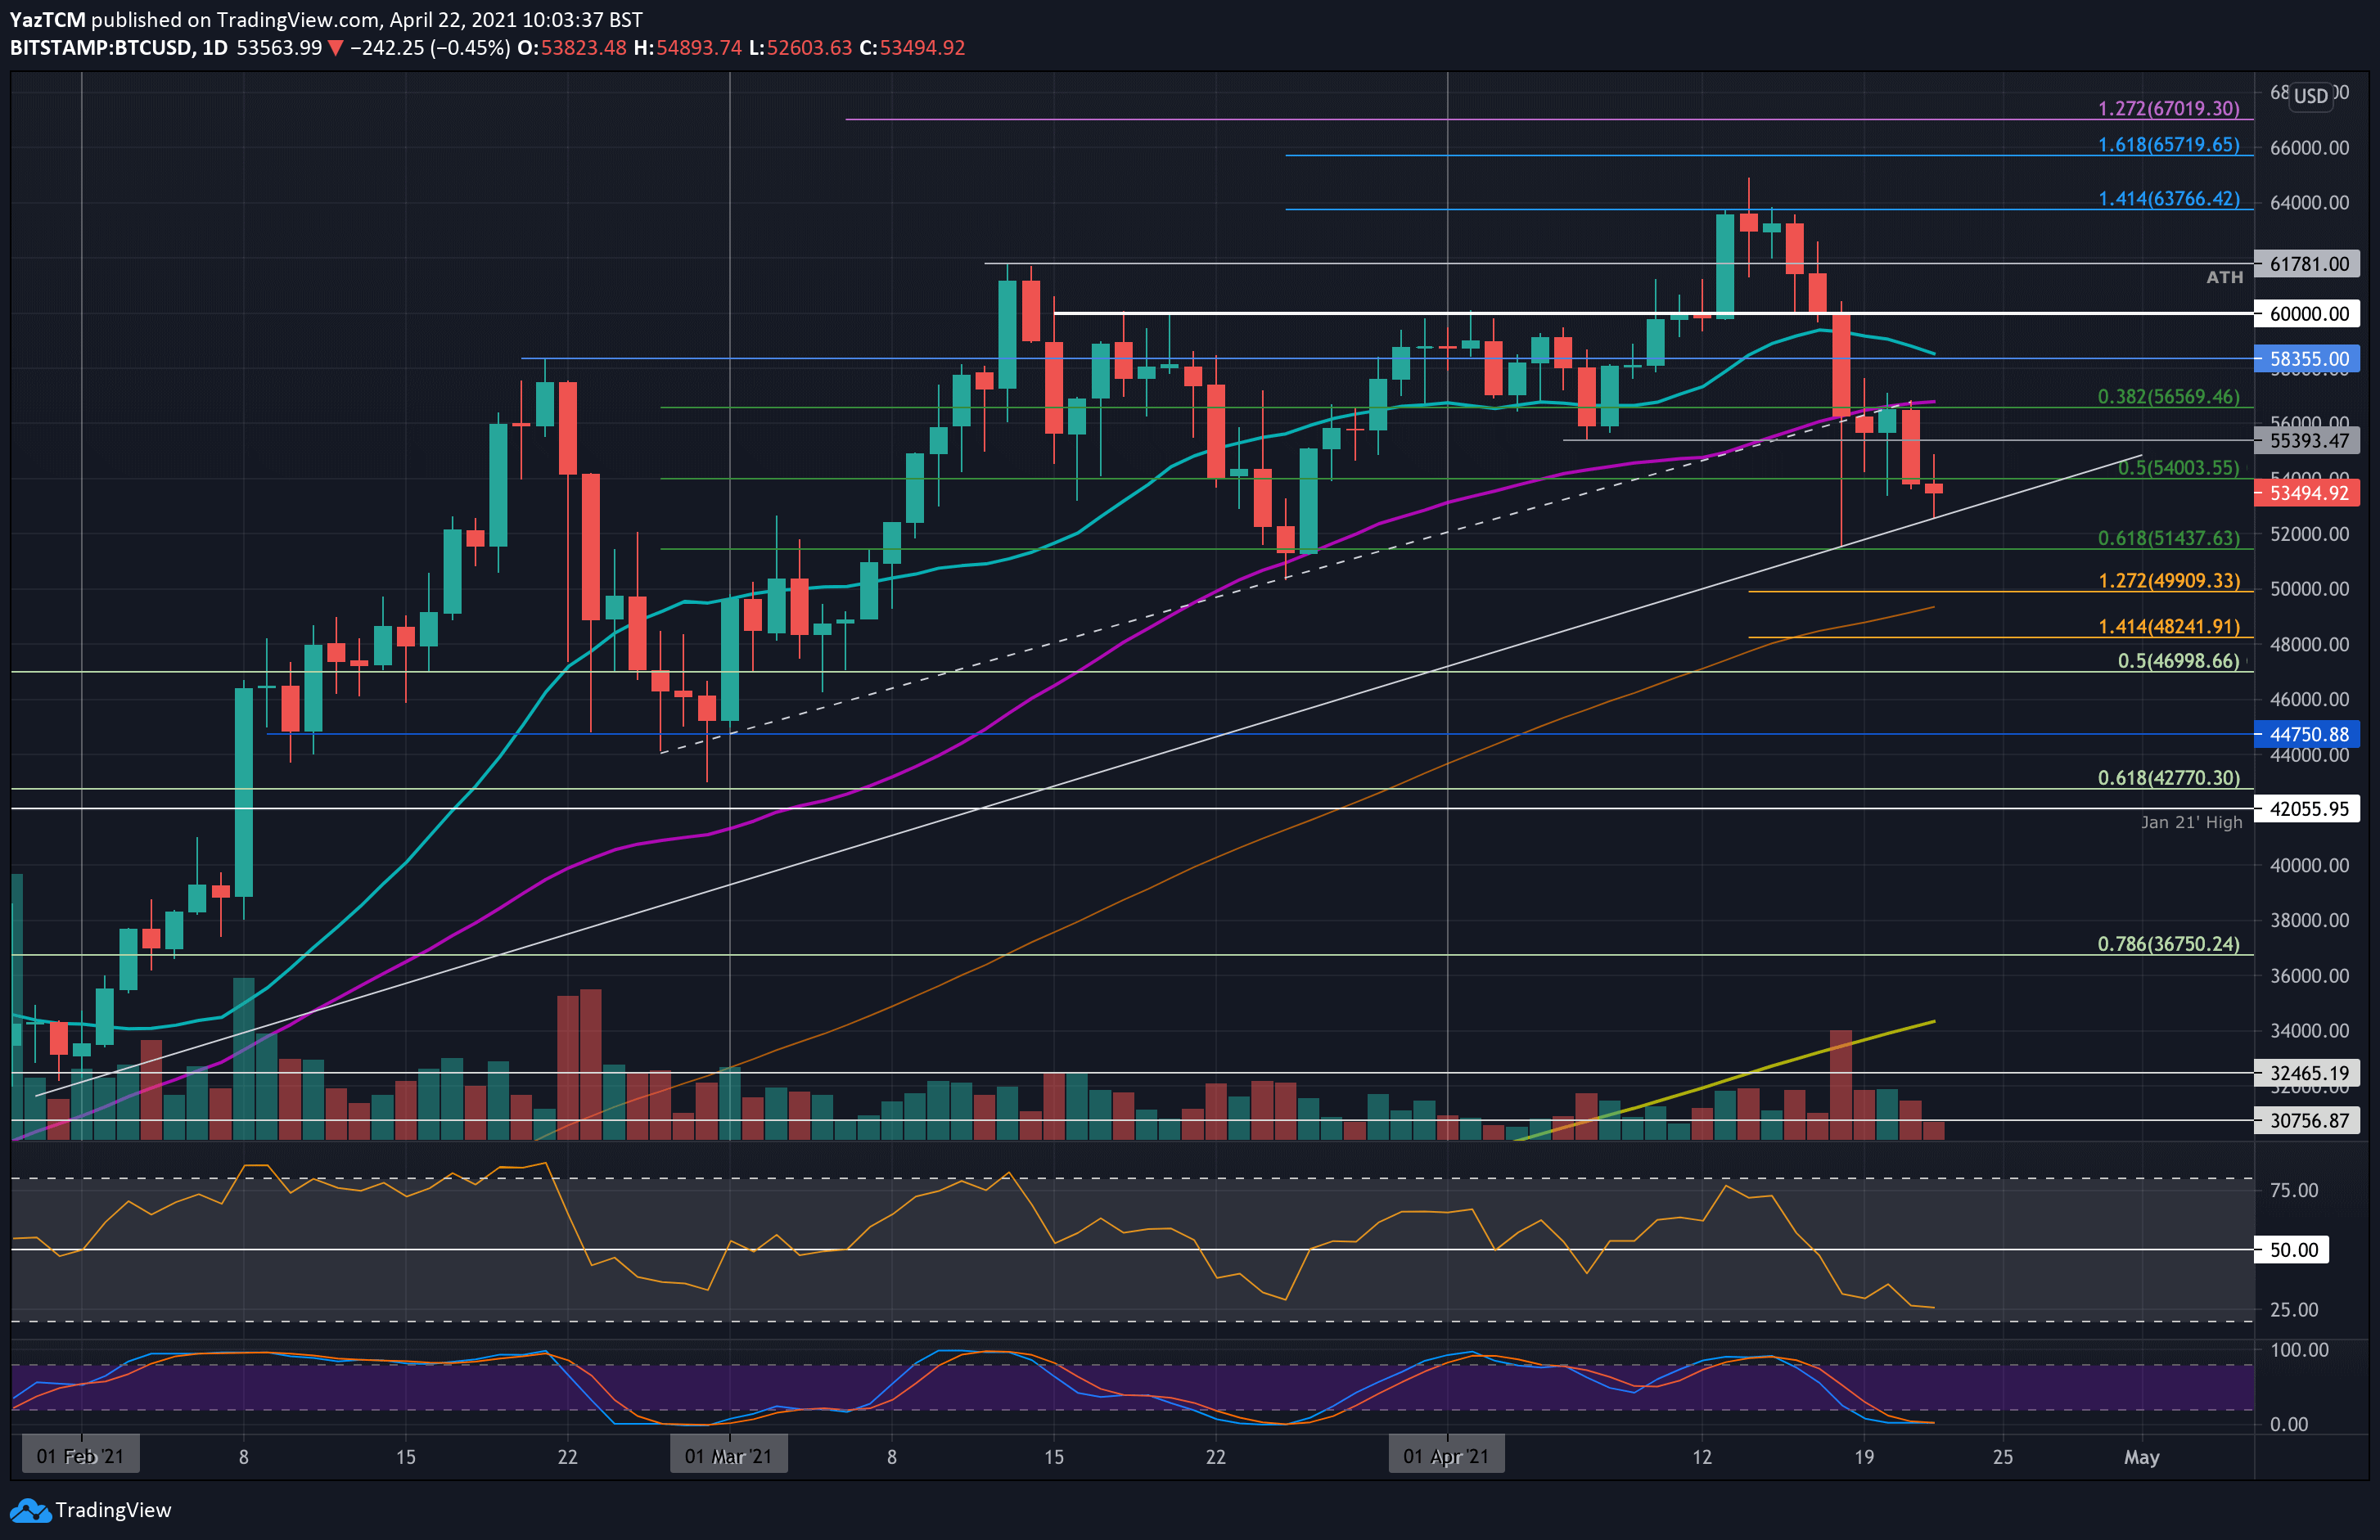
Bitcoin continues to struggle after getting rejected retesting the critical 50-days moving average (MA) line yesterday. Unless BTC closes above $56,900, which now seems far away, we are going to witness the first full candle body or trading day below the significant level for the first time since October 7, 2020.
Quick recap: During the steep price drop on Sunday, bitcoin had penetrated beneath the 50-days MA to reach as low as $51,400, where it found support at a .618 Fib Retracement.
From there, bitcoin managed to rebound higher as it went on to close the daily candle on Sunday above the 50-days MA. Unfortunately, as the week progressed, weakness got back as BTC fell beneath the 50-days MA and struggled to climb above it. Yesterday, it was rejected from the resistance, which caused it to head lower and drop beneath the major support at $55,000.
Today, bitcoin continued to decline as it reached as low as $52,600. There, it found support at an ascending trend line that dates back to the start of February.
The breakdown beneath the 50-days MA is quite significant as the last time this happened was back in September 2020. It took bitcoin a total of 35 days to break back above the 50-days MA during that time.
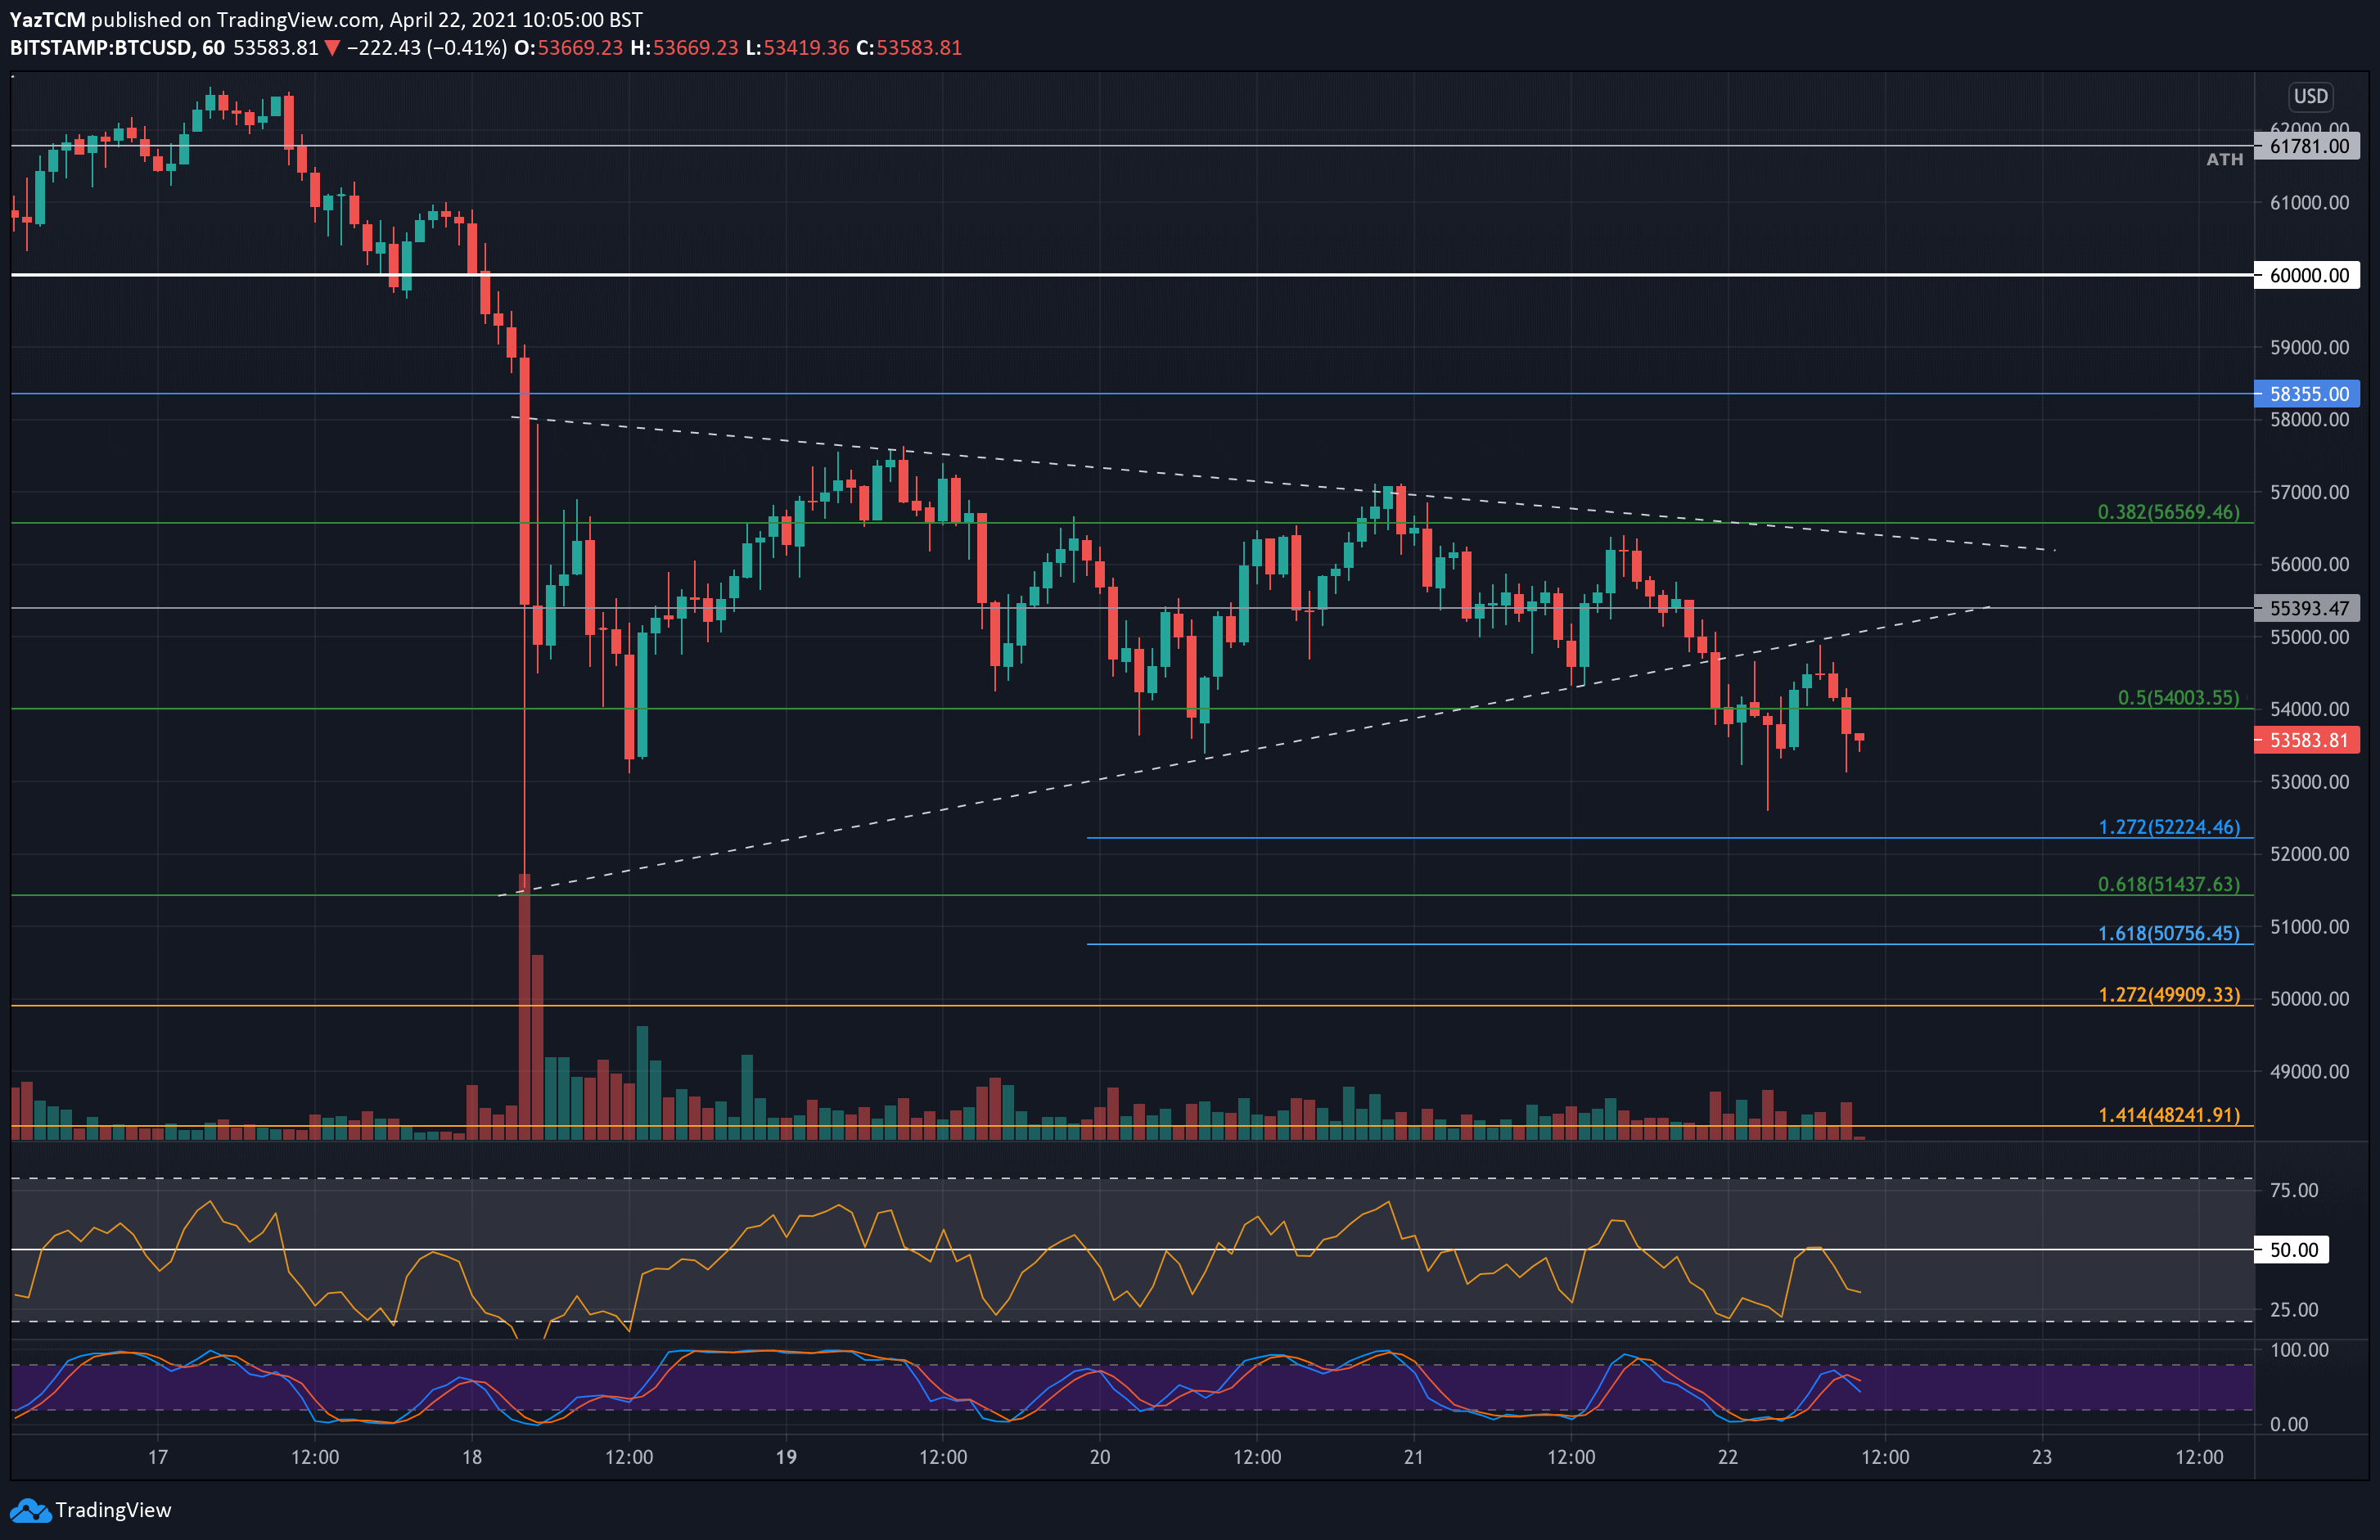
Looking at the short-term chart and as mentioned here yesterday, bitcoin was trading inside a symmetrical triangle pattern since Sunday’s price collapse. Today, bitcoin broke to the downside, which led to the massive drop to $52.5k (today’s low as of writing these lines). The short-term bearishness confirmed as the triangle was tested, as resistance from below, and got rejected.
BTC Price Support and Resistance Levels to Watch
Key Support Levels: $53,300, $52,225, $51,440, $51,000, $50,750.
Key Resistance Levels: $55,000, $55,400, $56,820, $58,355, $60,000.
Looking ahead, the first support lies at $53,300. This is followed by $52,225 (downside 1.272 Fib Extension), $51,440 (.618 Fib), and $51,000 (this month’s low recorded on Sunday). The latter should serve as a significant support level, together with the $50,750 (downside 1.618 Fib Extension) and $50,000.
On the other side, the first resistance lies at $55,000. This is followed by $55,400, $56,820 (50-days MA), $58,355 (20-days MA), and $60,000.
The daily RSI is well within the bearish territory as the selling momentum increased today, causing the RSI to make a new low for the year. This indicates that the bearish momentum is now the highest since September 2020.
Bitstamp BTC/USD Daily Chart
Bitstamp BTC/USD 4-Hour Chart