ADA/USD – ADA Rebounds Back Toward 200-day MA Key Support Levels: .13, .10, .05.Key Resistance Levels: .16, .20, .28. The BTC price drop beneath K yesterday caused had many altcoins to follow suit. During the decline, ADA dropped below the 200-day MA and eventually broke beneath the descending price channel that it was trading within. It continued to decline and reached as low as before rebounding to close the daily candle at around .05. Today, ADA surged by a strong 12% as it pushed upward from .05, reaching as high as .18. It is now back above the 200-day MA and is battling the upper angle of the previous descending price channel it was trading inside. ADA/USD Daily Chart. Source: TradingView.ADA-USD Short Term Price Prediction Looking ahead, if
Topics:
Yaz Sheikh considers the following as important: ADABTC, ADAUSD, Cardano (ADA) Price, Price Analysis
This could be interesting, too:
Jordan Lyanchev writes Cardano (ADA) Surpasses Dogecoin After 55% Surge
Jordan Lyanchev writes Trump Confirms Work on Strategic Crypto Reserve: XRP, ADA, SOL Included
Dimitar Dzhondzhorov writes Millions of ADA Sold by Cardano Whales During Market Crash – Will the Decline Continue?
Jordan Lyanchev writes Here’s How Cardano’s 17% Weekly Correction Can Help ADA Hit This Cycle: Analyst
ADA/USD – ADA Rebounds Back Toward 200-day MA
Key Support Levels: $1.13, $1.10, $1.05.
Key Resistance Levels: $1.16, $1.20, $1.28.
The BTC price drop beneath $30K yesterday caused had many altcoins to follow suit. During the decline, ADA dropped below the 200-day MA and eventually broke beneath the descending price channel that it was trading within.
It continued to decline and reached as low as $1 before rebounding to close the daily candle at around $1.05.
Today, ADA surged by a strong 12% as it pushed upward from $1.05, reaching as high as $1.18. It is now back above the 200-day MA and is battling the upper angle of the previous descending price channel it was trading inside.
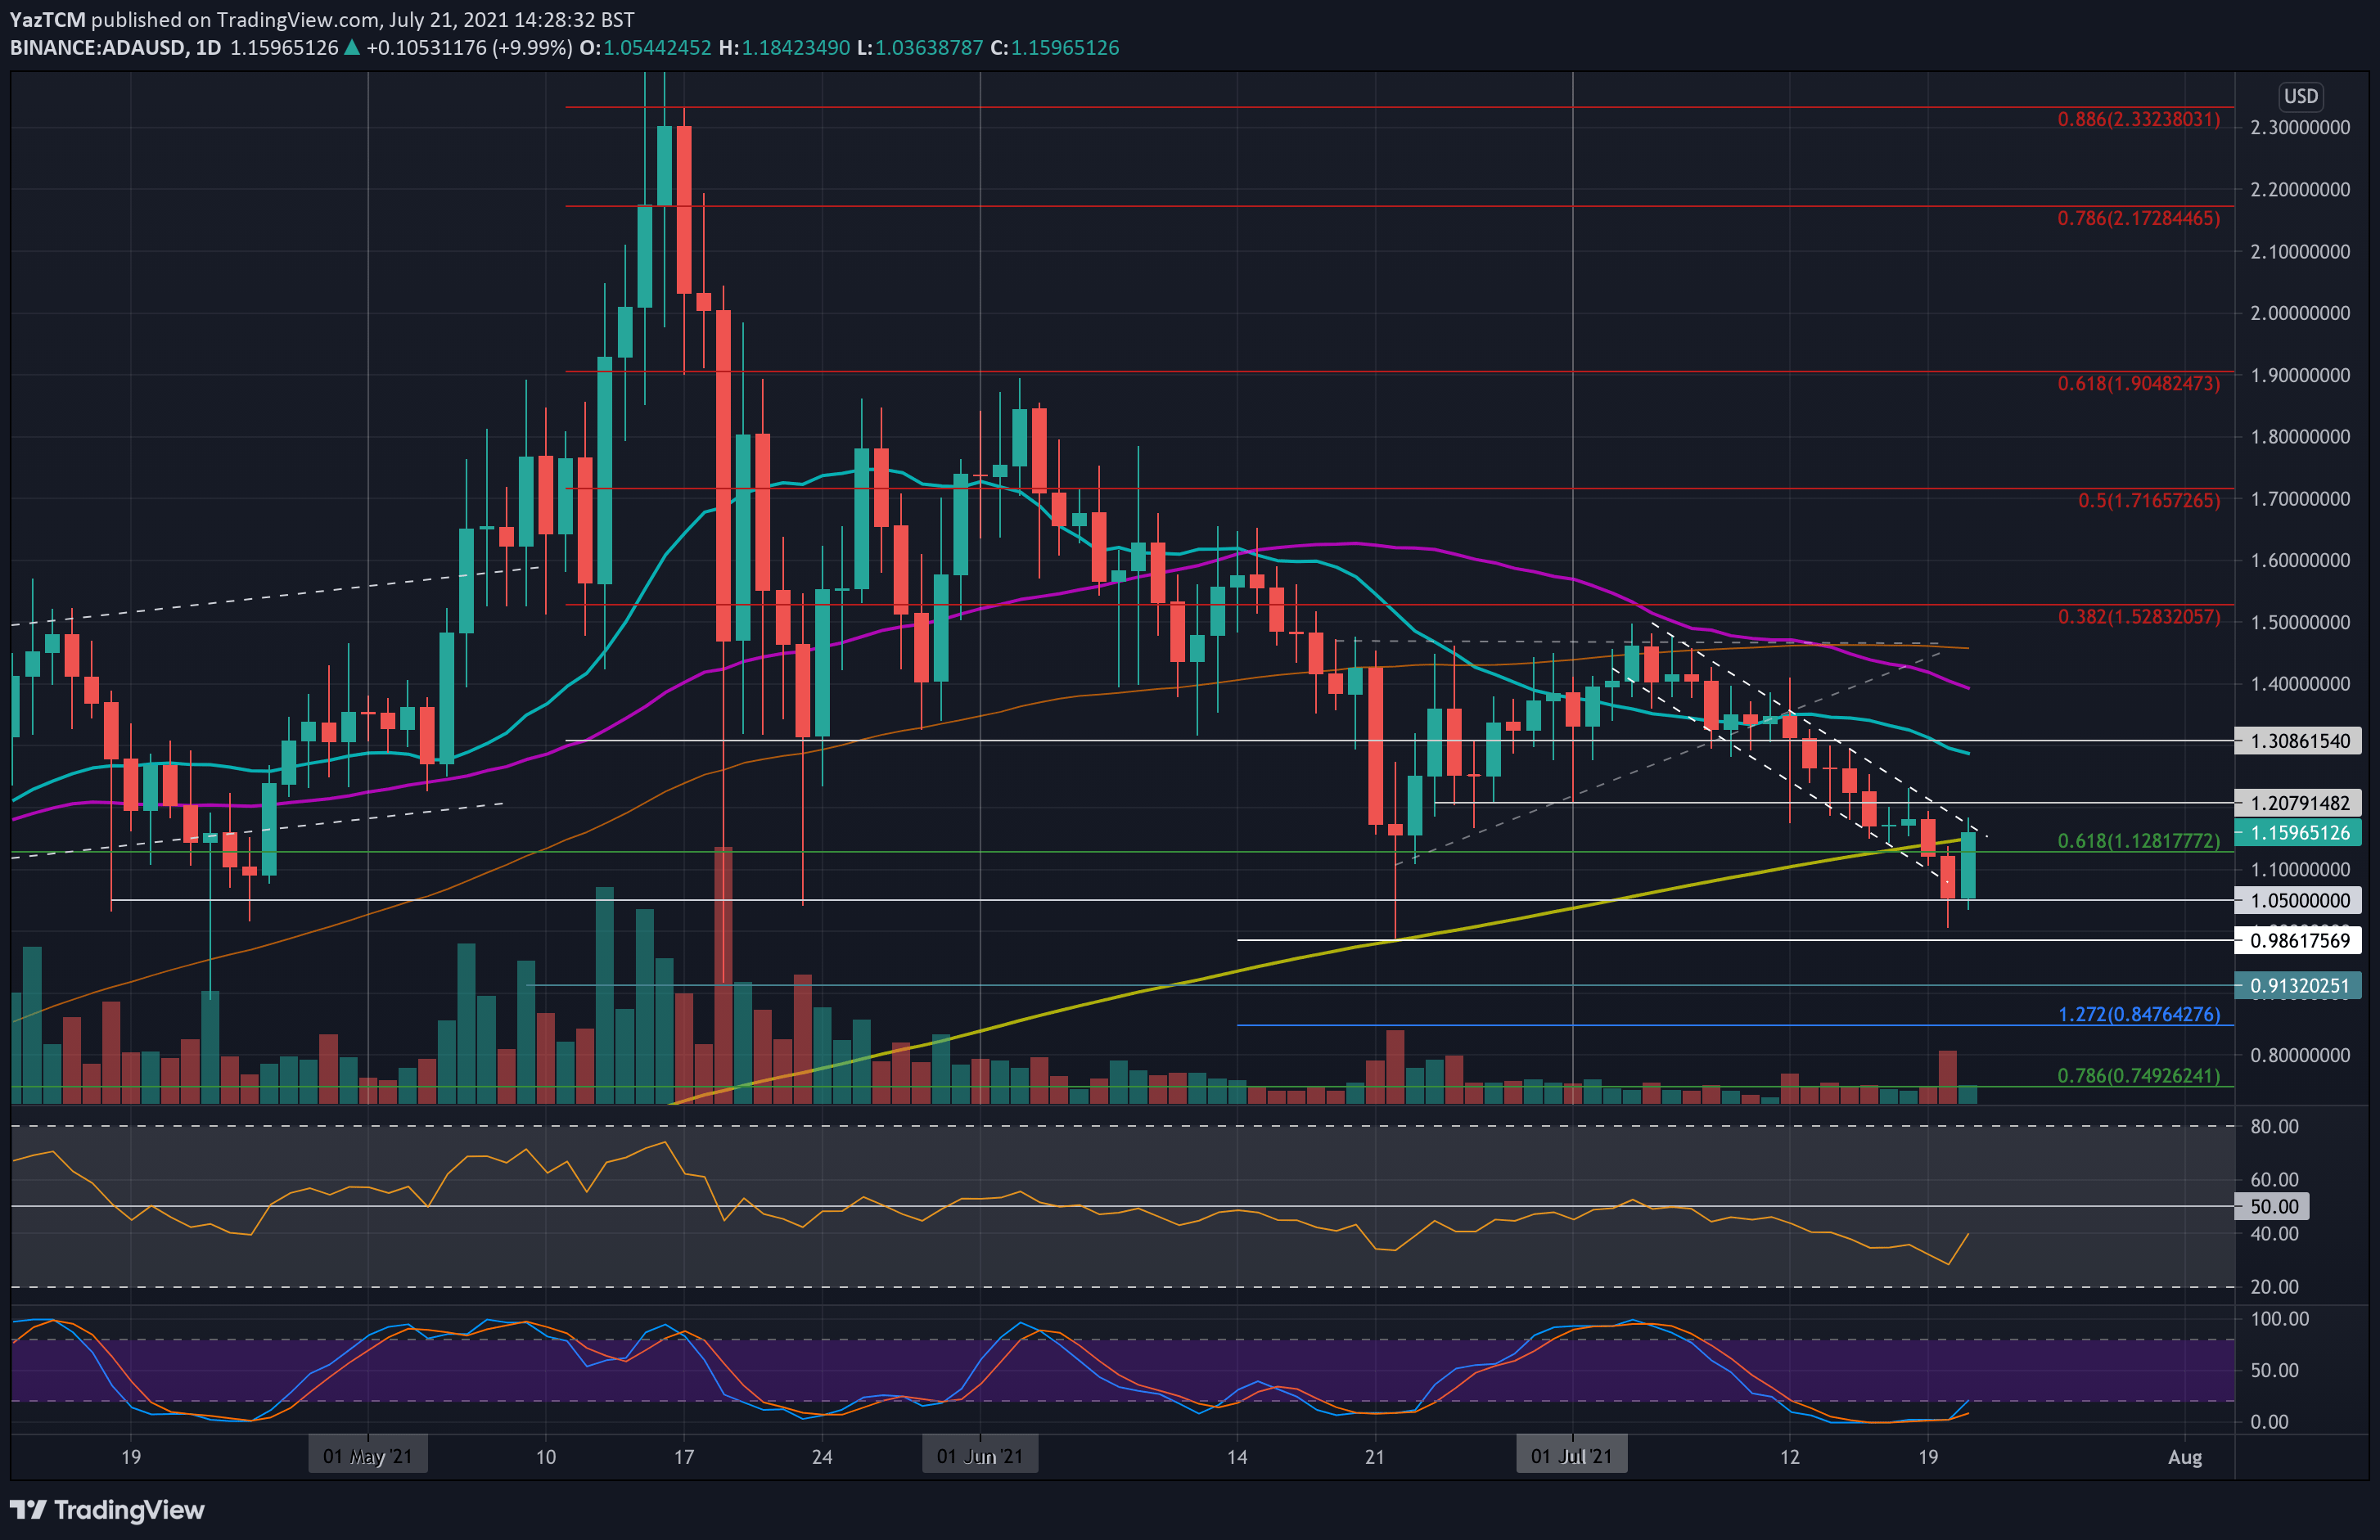
ADA-USD Short Term Price Prediction
Looking ahead, if the bulls can break beyond $1.16 to penetrate the price channel, the first resistance lies at $1.20. This is followed by $1.28 (20-day MA), $1.30, and $1.40 (50-day MA).
On the other side, the first support lies around $1.13 (200-day MA). This is followed by $1.10, $1.05, and $1.00.
The RSI is in bearish territory but is pointing upward, indicating the bearish momentum might be fading.
ADA/BTC – ADA Continues To Trade Inside Price Channel
Key Support Levels: 3600 SAT, 3540 SAT, 3440 SAT.
Key Resistance Levels: 3700 SAT, 3900 SAT, 4000 SAT.
ADA remains within the price channel it has been trading in since the first week of July. The coin did drop below the 100-day MA at 3600 SAT yesterday to as low as 3440 SAT.
There, it found support at a .5 Fib and rebounded to close the daily candle inside the price channel at 3540 SAT, the June low-day closing price. Today, ADA pushed higher and is now testing the upper angle of the price channel around 37000 SAT.

ADA-BTC Short Term Price Prediction
Moving forward, if the bulls break the price channel at 3700 SAT, the first resistance lies at 3820 SAT – late June support. This is followed by 3900 SAT (20-day MA) and 4000 SAT (50-day MA).
On the other side, the first support lies at 3600 SAT (100-day MA). This is followed by 3540 SAT and 3440 SAT (.5 Fib).
Again the RSI is in the bearish favor, but the recent uptick could suggest diminishing bearish momentum.