ADA/USD – ADA Breaks Long Term Descending Trend Line Key Support Levels: .30, .25, .20.Key Resistance Levels: .35, .45, .52. ADA surged 10%, primarily driven by the 12% BTC price hike. The coin dropped into support at .05 last week but started to rebound from there. By Wednesday, ADA managed to break the 200-day MA as it continued higher from there. Over the weekend, ADA continued to climb past .20 but struggled with resistance at the 20-day MA. It finally broke the 20-day MA today and surged past a long-term descending trend line in play since mid-May. From a short-term perspective, ADA is now trading inside an ascending price channel. ADA/USD Daily Chart. Source: TradingView.ADA-USD Short Term Price Prediction Looking ahead, the first resistance lies at
Topics:
Yaz Sheikh considers the following as important: ADABTC, ADAUSD, Cardano (ADA) Price, Price Analysis
This could be interesting, too:
Jordan Lyanchev writes Cardano (ADA) Surpasses Dogecoin After 55% Surge
Jordan Lyanchev writes Trump Confirms Work on Strategic Crypto Reserve: XRP, ADA, SOL Included
Dimitar Dzhondzhorov writes Millions of ADA Sold by Cardano Whales During Market Crash – Will the Decline Continue?
Jordan Lyanchev writes Here’s How Cardano’s 17% Weekly Correction Can Help ADA Hit This Cycle: Analyst
ADA/USD – ADA Breaks Long Term Descending Trend Line
Key Support Levels: $1.30, $1.25, $1.20.
Key Resistance Levels: $1.35, $1.45, $1.52.
ADA surged 10%, primarily driven by the 12% BTC price hike. The coin dropped into support at $1.05 last week but started to rebound from there. By Wednesday, ADA managed to break the 200-day MA as it continued higher from there.
Over the weekend, ADA continued to climb past $1.20 but struggled with resistance at the 20-day MA. It finally broke the 20-day MA today and surged past a long-term descending trend line in play since mid-May.
From a short-term perspective, ADA is now trading inside an ascending price channel.
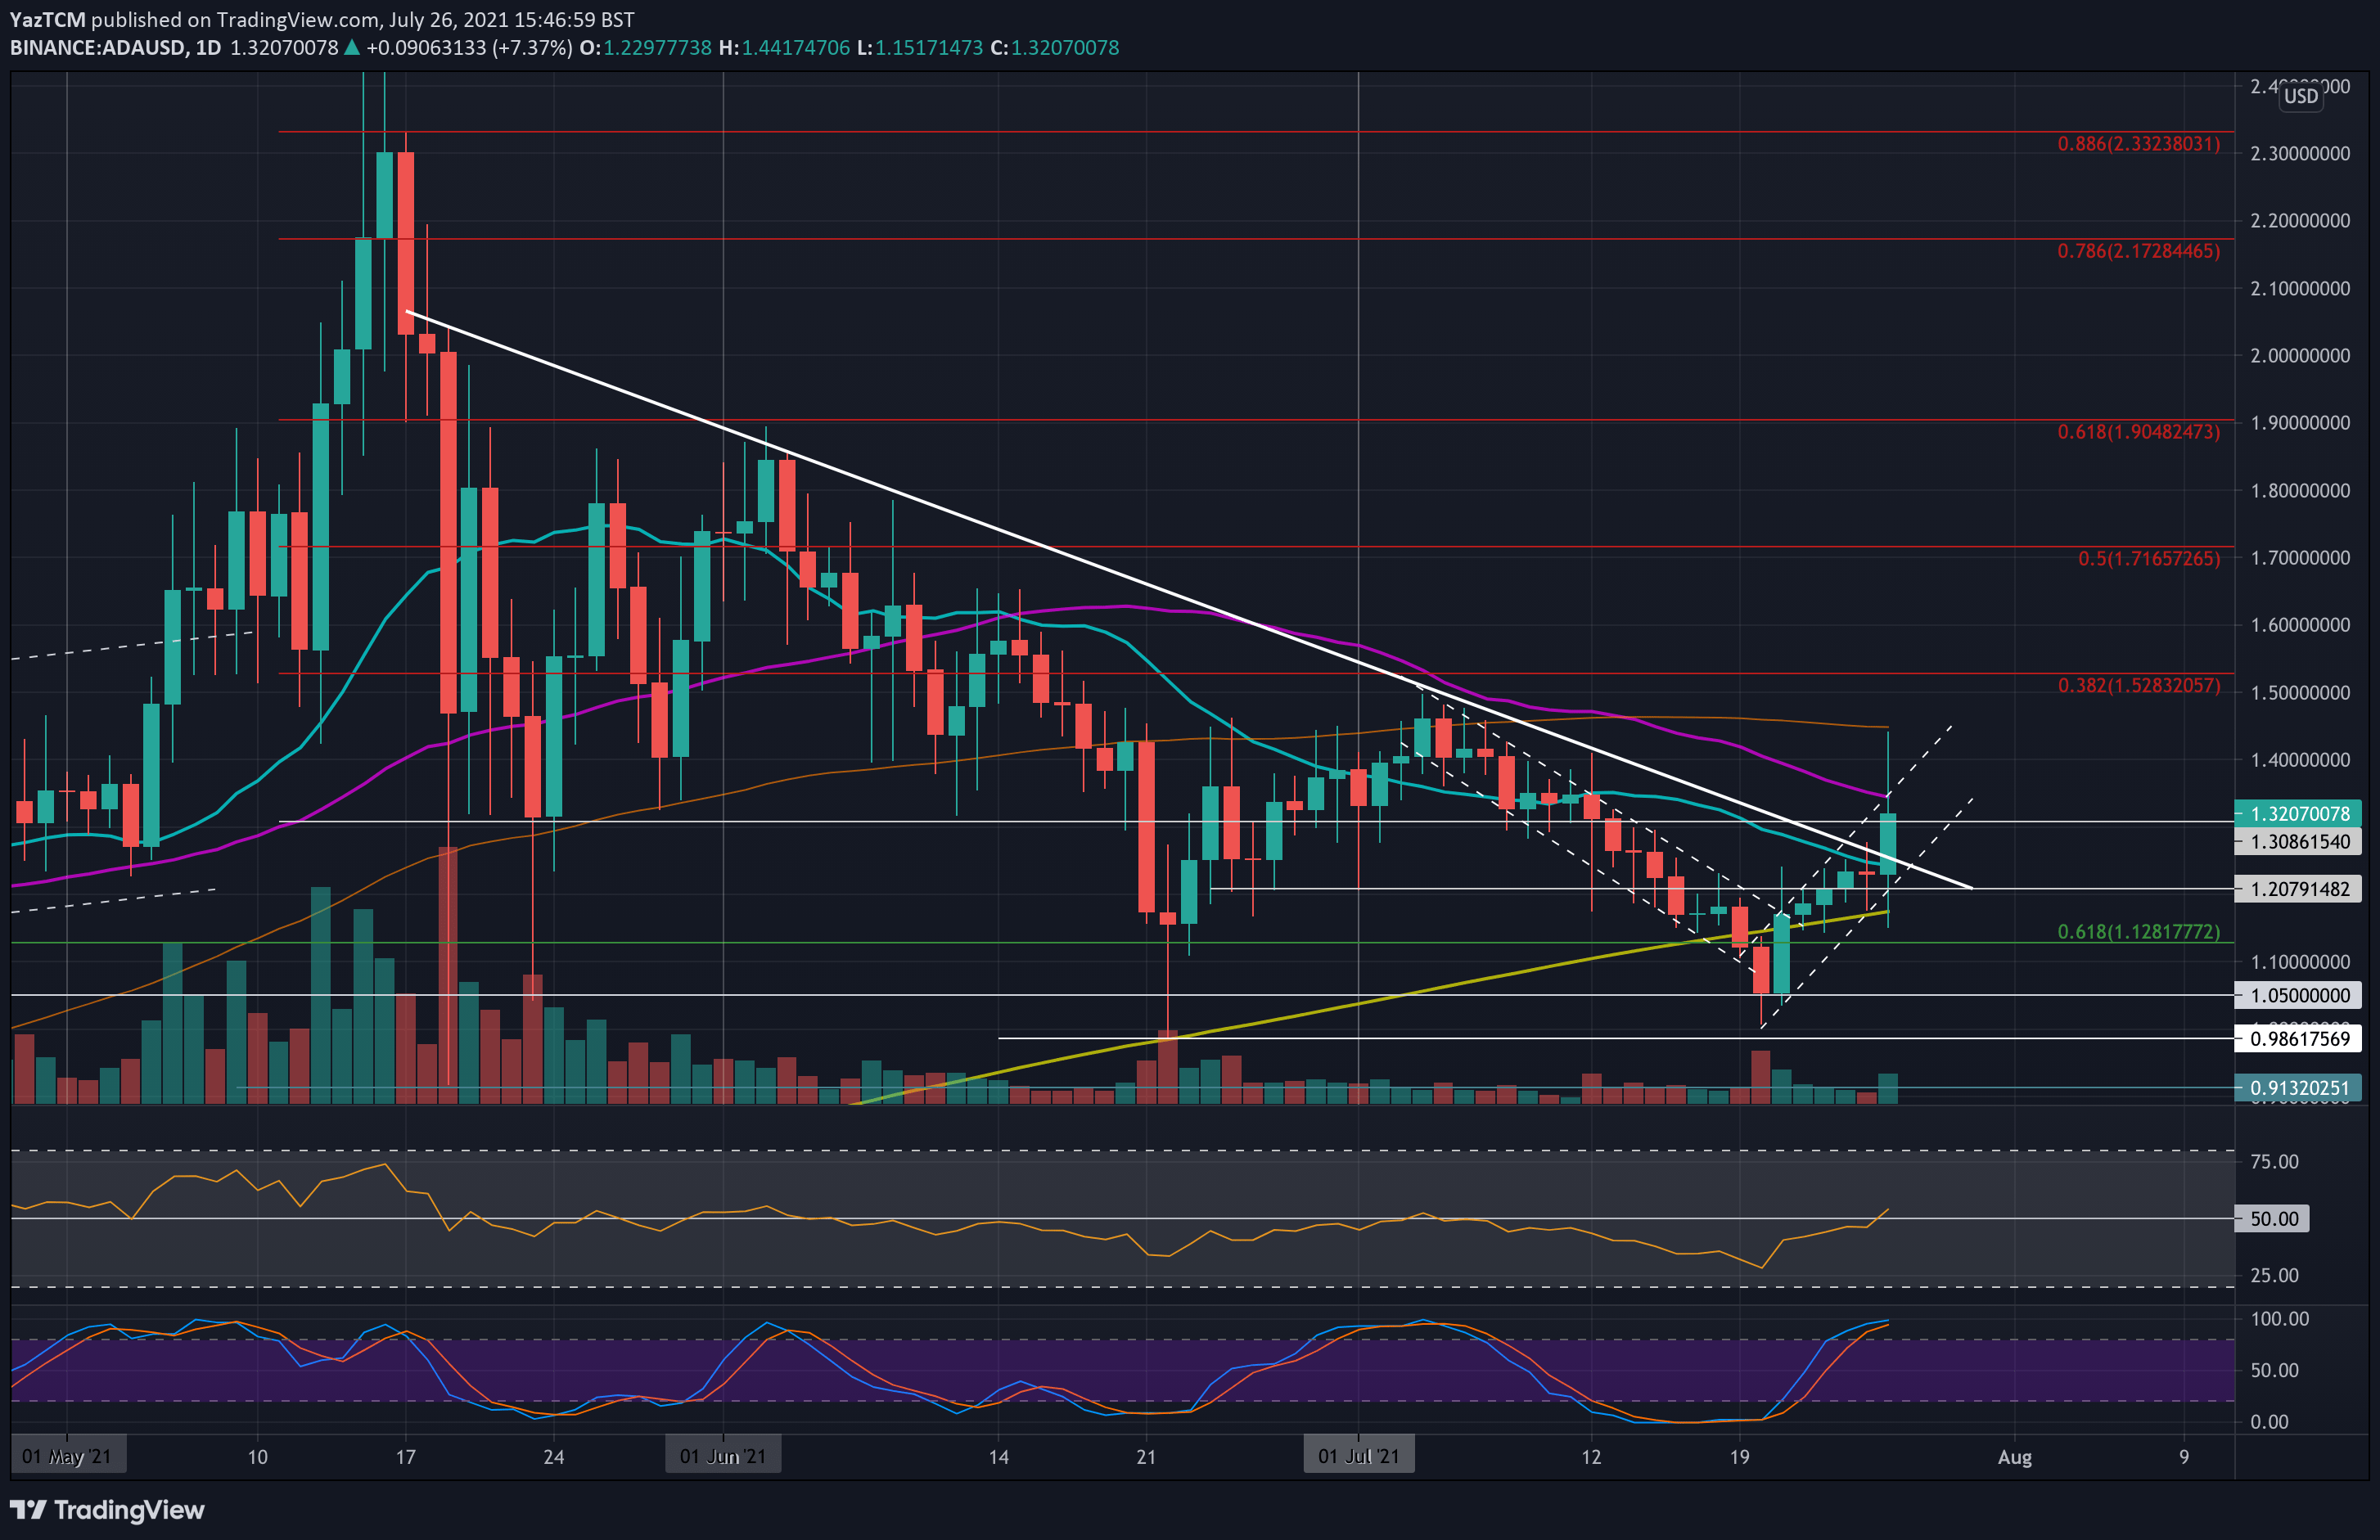
ADA-USD Short Term Price Prediction
Looking ahead, the first resistance lies at $1.35 (50-day MA & upper angle of the price channel). Above the channel, resistance lies at $1.45 (100-day MA), $1.52 (bearish .382 Fib), and $1.60.
On the other side, the first support lies at $1.30. This is followed by $1.25 (20-day MA & lower angle of price channel), $1.20, $1.17 (200-day MA), and $1.12 (.618 Fib).
The daily RSI recently poked beyond the midline to indicate increasing bullish momentum within the market.
ADA/BTC – ADA Hits Fresh 2-Month low
Key Support Levels: 3440 SAT, 3200 SAT, 3130 SAT.
Key Resistance Levels: 3540 SAT, 3675 SAT, 3800 SAT.
ADA has been trading inside a descending price channel since the start of July. It was rejected at the upper angle of the channel yesterday and spiked as low as 3260 SAT today, setting a new low not seen since mid-May.
Luckily, it has since recovered slightly and is trading at around 3450 SAT, as it attempts to defend the support at the .5 Fib.
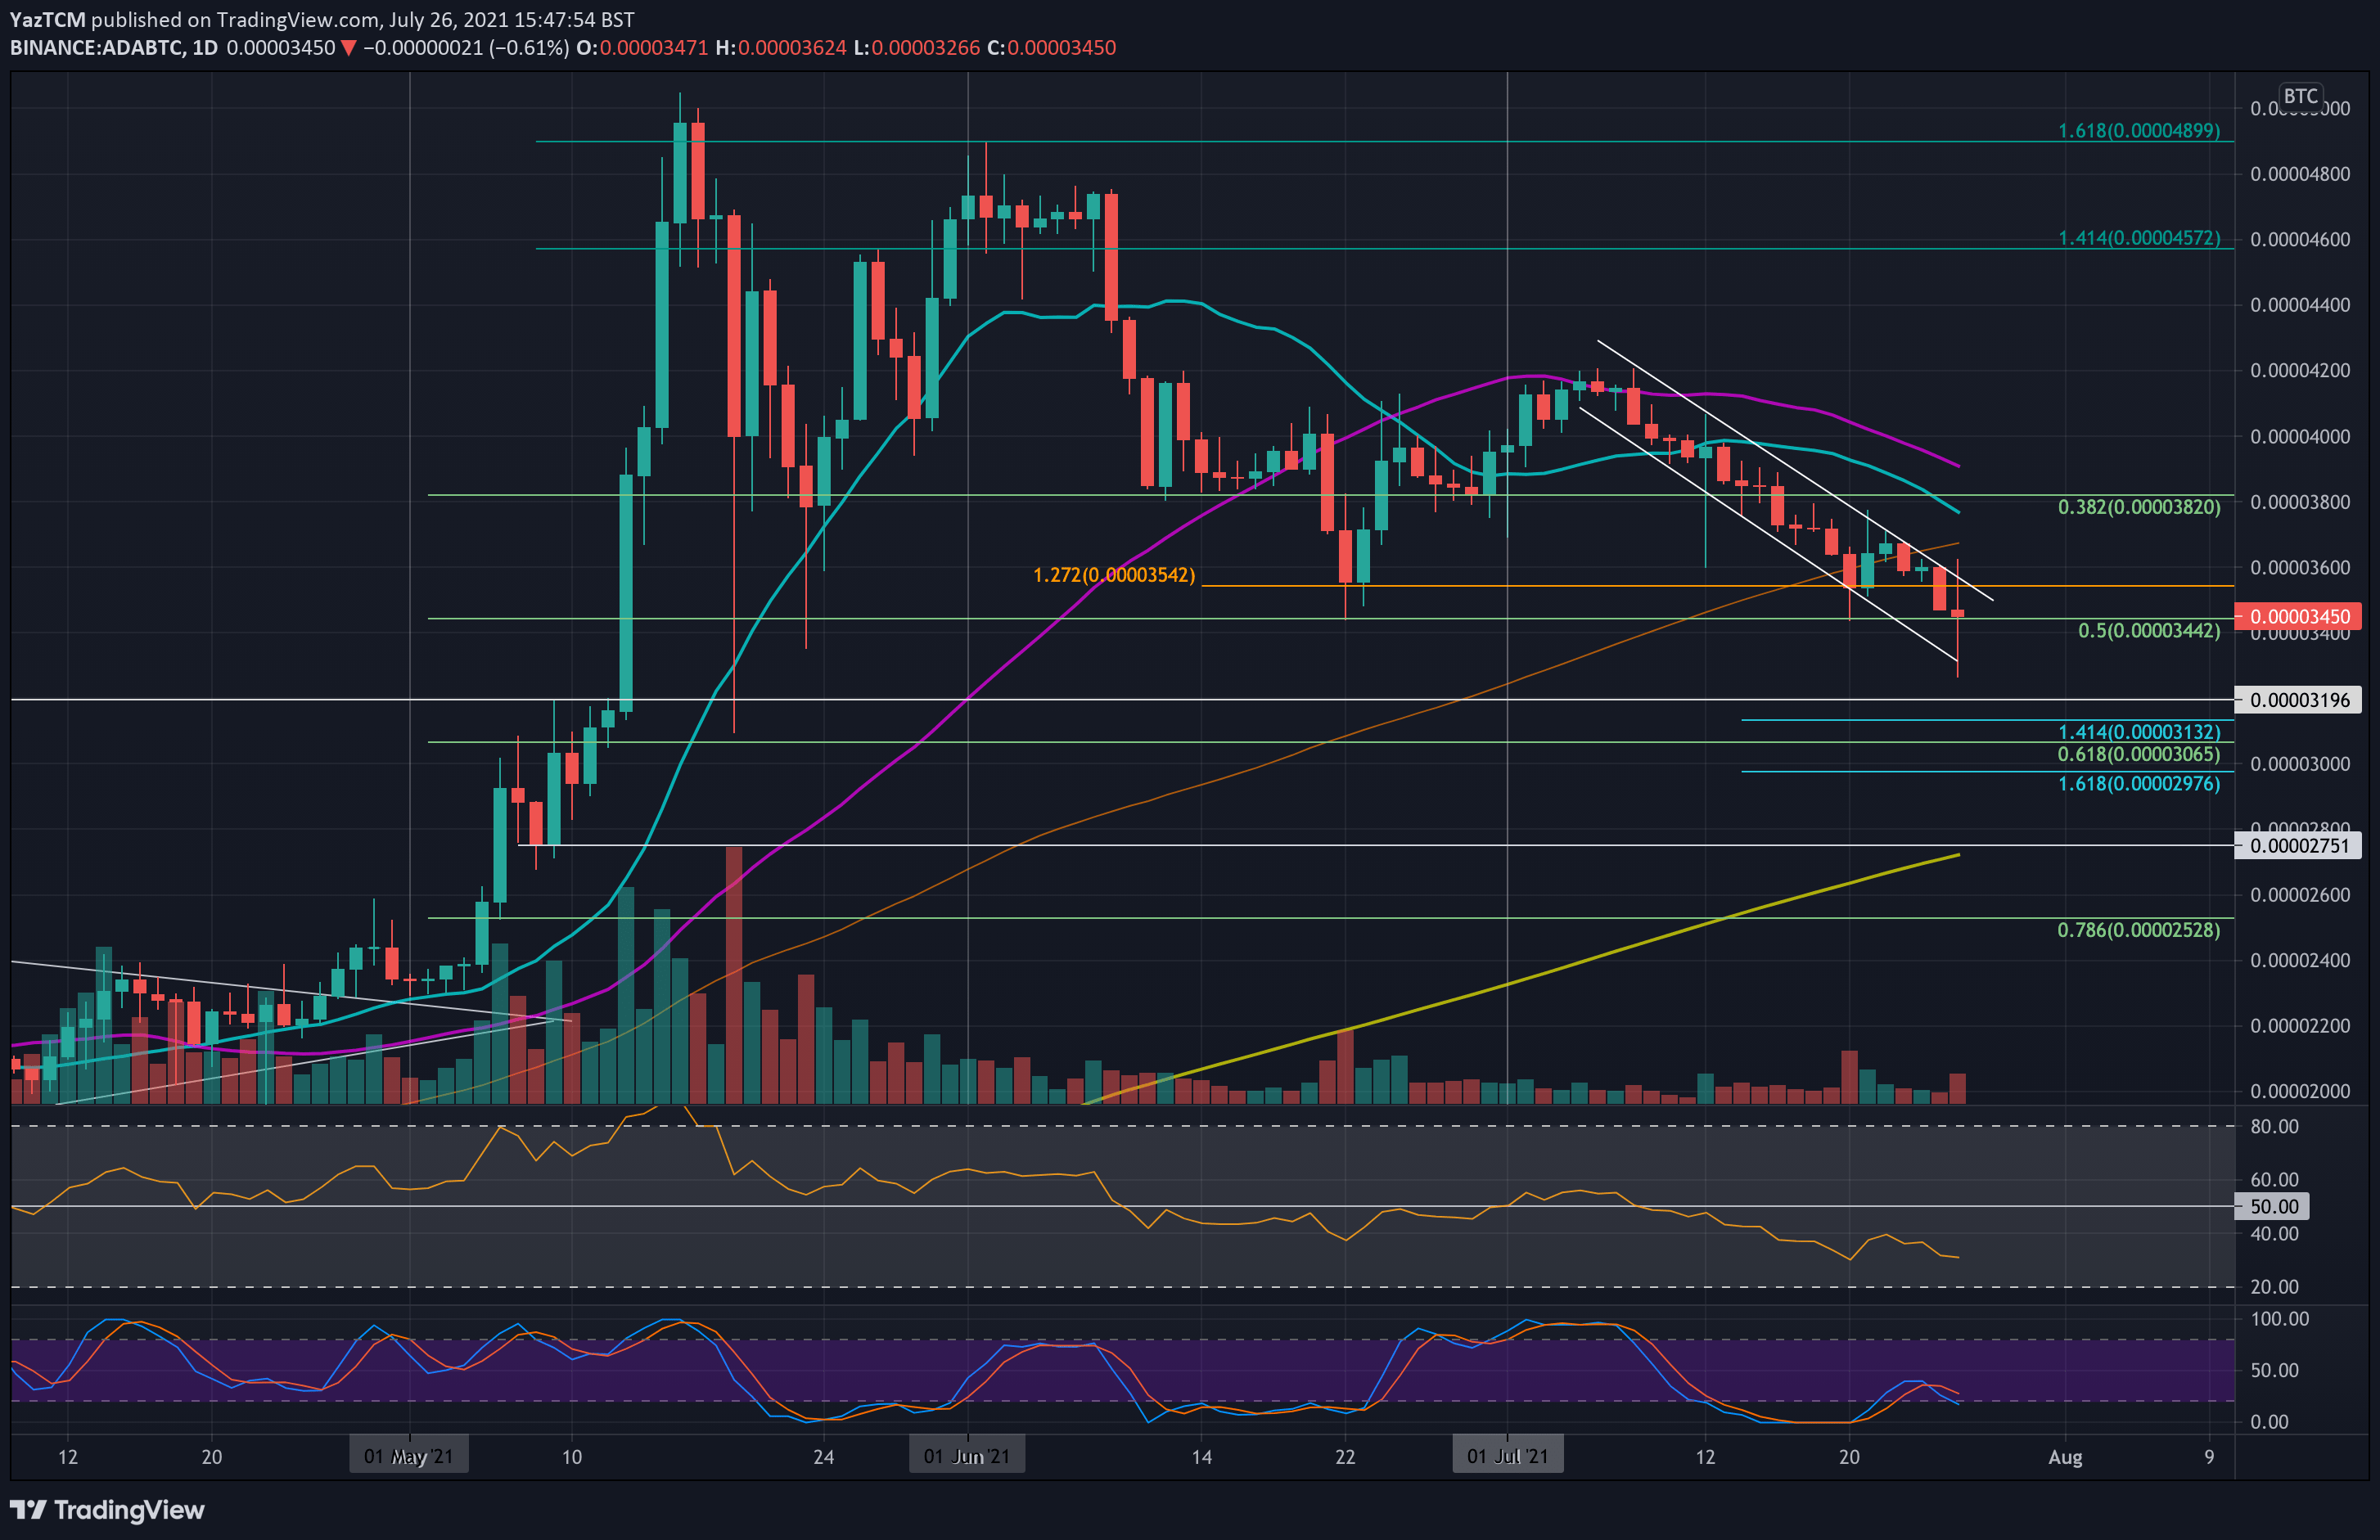
ADA-BTC Short Term Price Prediction
Moving forward, if the buyers push higher, the first resistance lies at 3540 SAT. This is followed by 3675 SAT (100-day MA), 3800 SAT (20-day MA), and 3910 SAT (50-day MA).
On the other side, the first support beneath 3440 SAT (.5 Fib), lies at 3200 SAT. This is followed by 3130 SAT (downside 1.414 Fib Extension), 3000 SAT (.618 Fib), and 2750 SAT (200-day MA).
The RSI is sinking further beneath the midline as the bearish momentum starts to increase within the market.