ADA/USD – Bulls Continue To Defend .10Key Support Levels: .10, .07, .00.Key Resistance Levels: .20, .30, .38.ADA is down from the late February highs of around .48. The cryptocurrency had been falling in the first few days of March until support was met at .10. Since then, ADA has managed to close every daily candle above the level.It has now been trapped within a range between .20 and .10 for the past eight days of trading and must break out of this range to dictate the market’s next direction.ADA/USD Daily Chart. Source: TradingViewADA-USD Short Term Price PredictionLooking ahead, if the sellers break the support at .10 (and the ascending trend line), the first level of support beneath lies at .07 (.382 Fib). This is followed by .00, %excerpt%.95 (.5 Fib), %excerpt%.9, and
Topics:
Yaz Sheikh considers the following as important: ADABTC, ADAUSD, Cardano (ADA) Price, Price Analysis
This could be interesting, too:
Jordan Lyanchev writes Cardano (ADA) Surpasses Dogecoin After 55% Surge
Jordan Lyanchev writes Trump Confirms Work on Strategic Crypto Reserve: XRP, ADA, SOL Included
Dimitar Dzhondzhorov writes Millions of ADA Sold by Cardano Whales During Market Crash – Will the Decline Continue?
Jordan Lyanchev writes Here’s How Cardano’s 17% Weekly Correction Can Help ADA Hit This Cycle: Analyst
ADA/USD – Bulls Continue To Defend $1.10
Key Support Levels: $1.10, $1.07, $1.00.
Key Resistance Levels: $1.20, $1.30, $1.38.
ADA is down from the late February highs of around $1.48. The cryptocurrency had been falling in the first few days of March until support was met at $1.10. Since then, ADA has managed to close every daily candle above the level.
It has now been trapped within a range between $1.20 and $1.10 for the past eight days of trading and must break out of this range to dictate the market’s next direction.
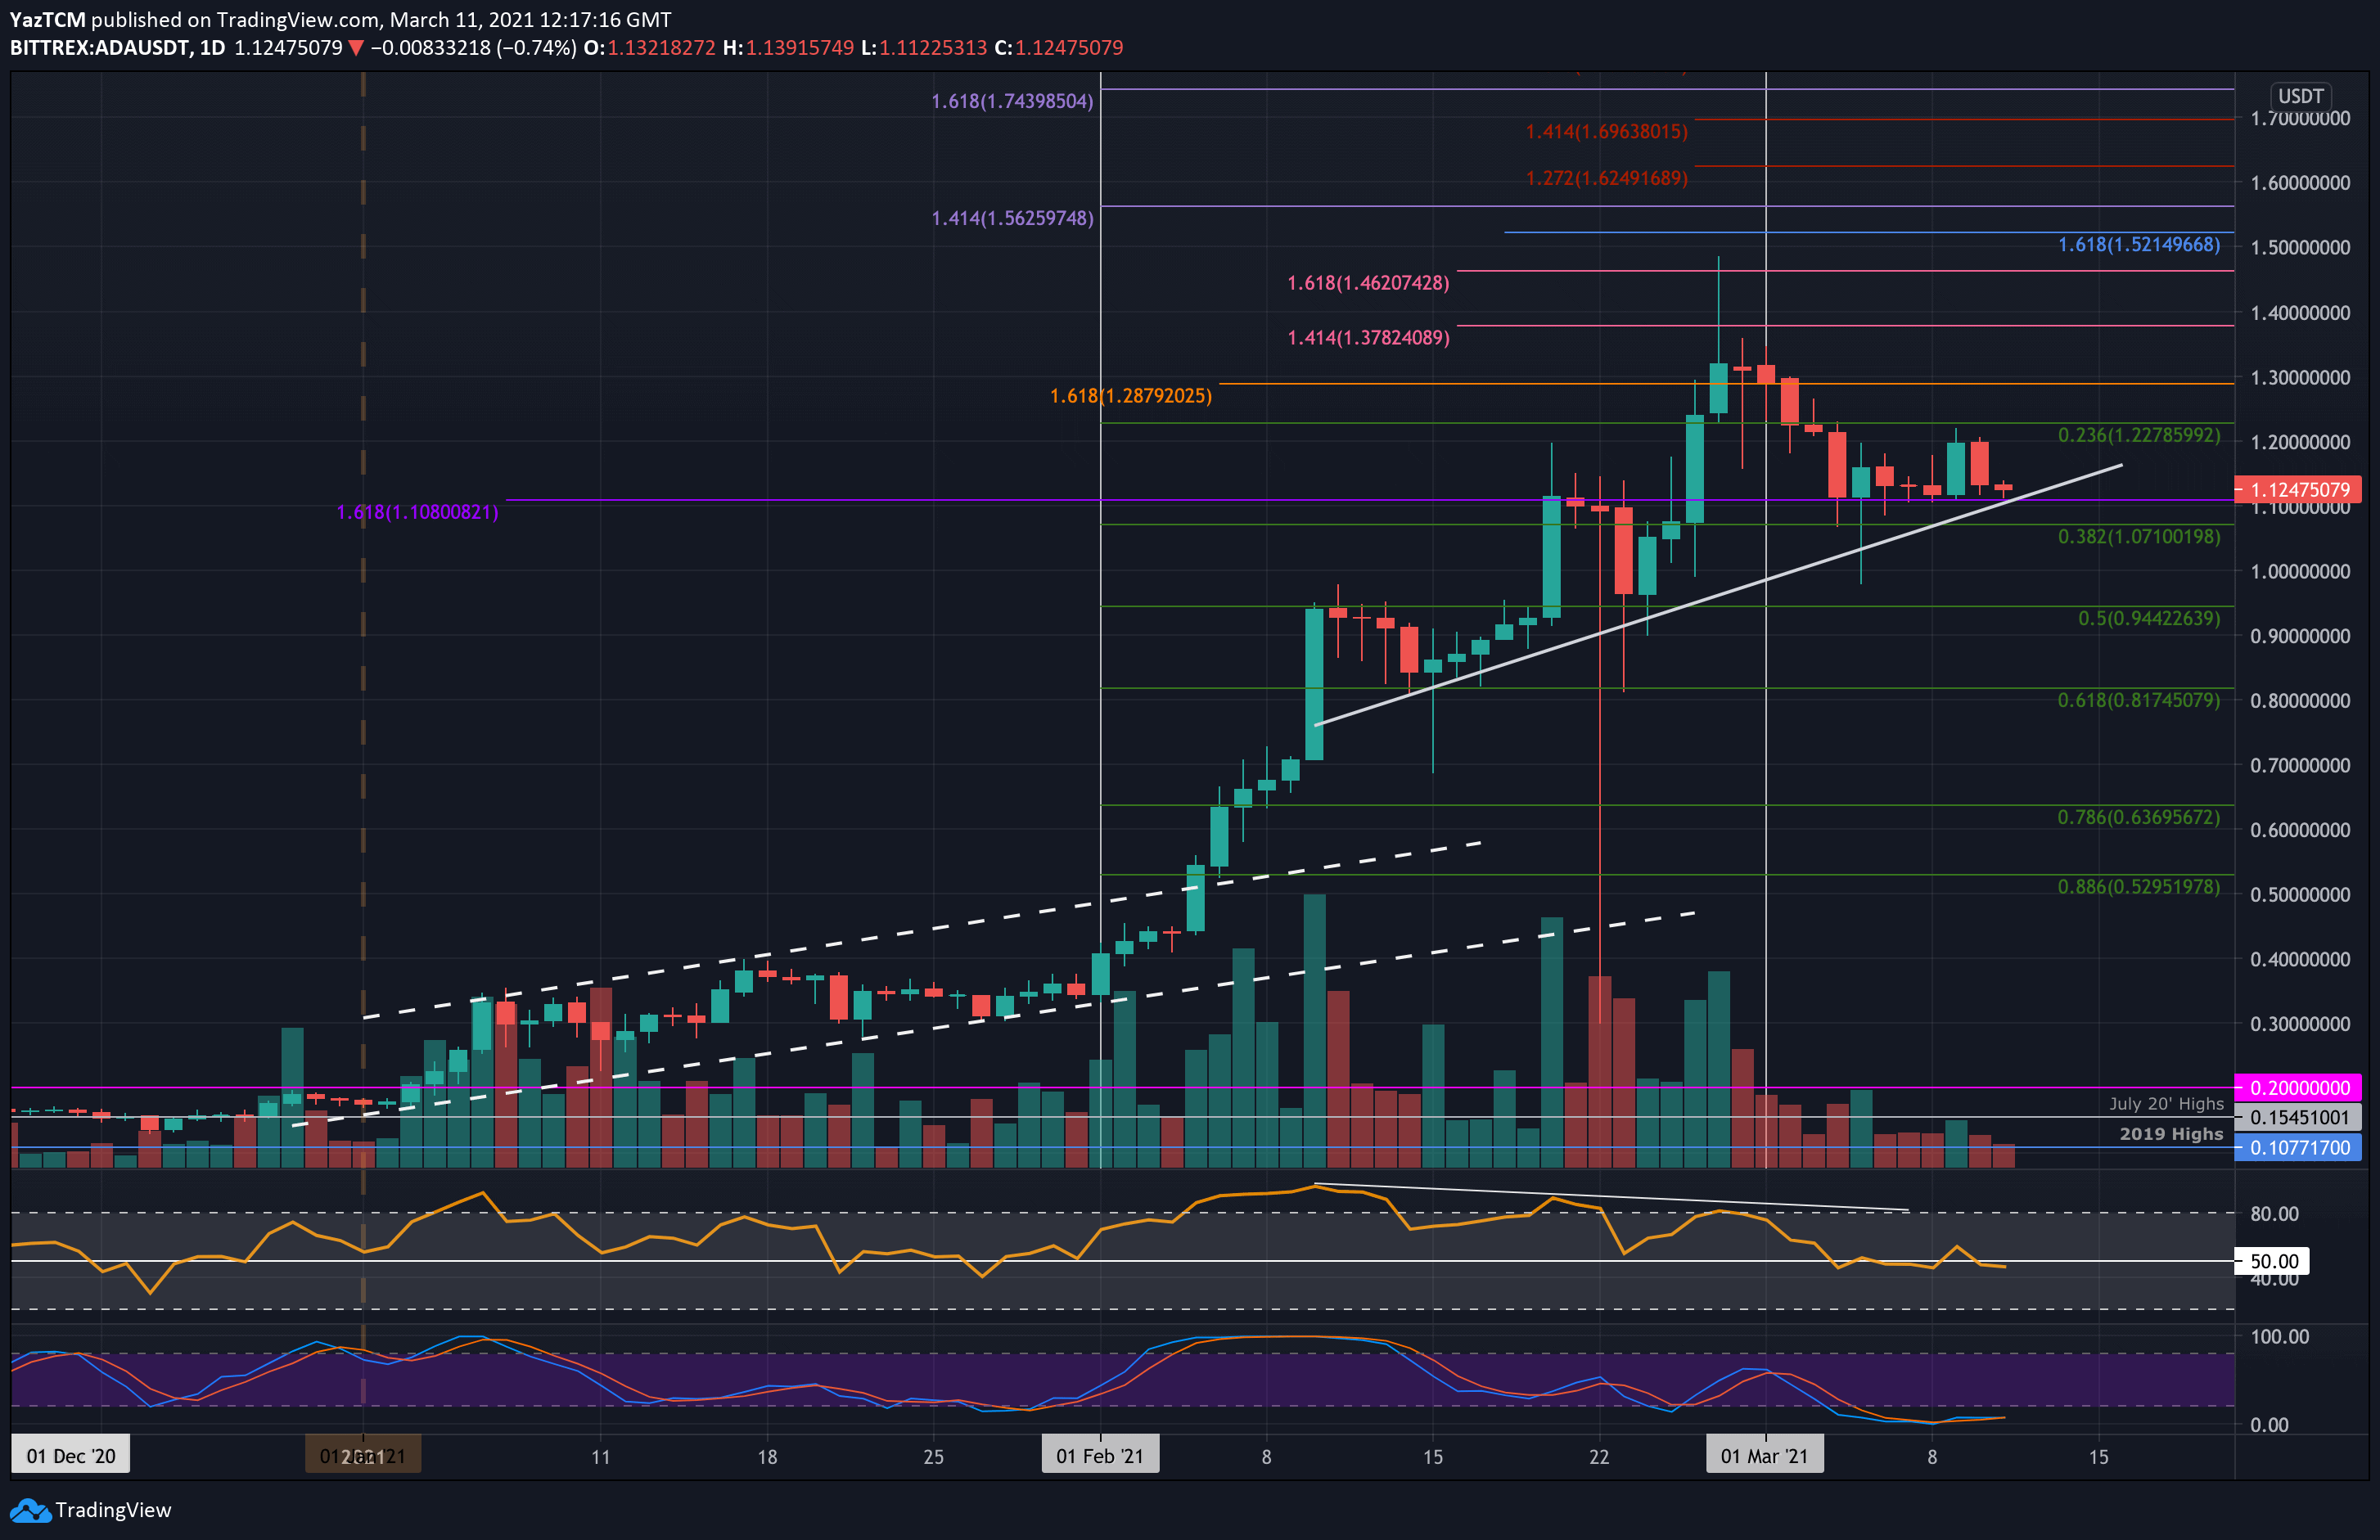
ADA-USD Short Term Price Prediction
Looking ahead, if the sellers break the support at $1.10 (and the ascending trend line), the first level of support beneath lies at $1.07 (.382 Fib). This is followed by $1.00, $0.95 (.5 Fib), $0.9, and $0.817 (.618 Fib).
On the other side, the first level of resistance lies at $1.20 (upper boundary of the current range). This is followed by $1.30, $1.38 (1.414 Fib Extension), and $1.48 (ATH). Above the ATH, resistance is expected at $1.52, $1.56, and $1.62.
The RSI is toying with the midline, indicating indecision within the market. If the RSI dips beneath the midline, the bearish momentum will increase and is likely to push ADA beneath the $1.10 support.
ADA/BTC – ADA Drops Into 2000 SAT
Key Support Levels: 1950 SAT, 1800 SAT, 1600 SAT.
Key Resistance Levels: 2100 SAT, 2300 SAT, 2456 SAT.
ADA continues to struggle against Bitcoin. It has been dropping during the entire period of March as it started to fall from 2900 SAT. The coin initially found support at 2300 SAT (.5 Fib), but the buyers could not defend this support as ADA fell beneath it over the weekend.
Yesterday, ADA dropped beneath additional support at 2086 SAT (.618 Fib) and continued to meet the current 2000 SAT level.
It’s worth noting that the last time ADA traded below the current price against BTC was on February 24th.
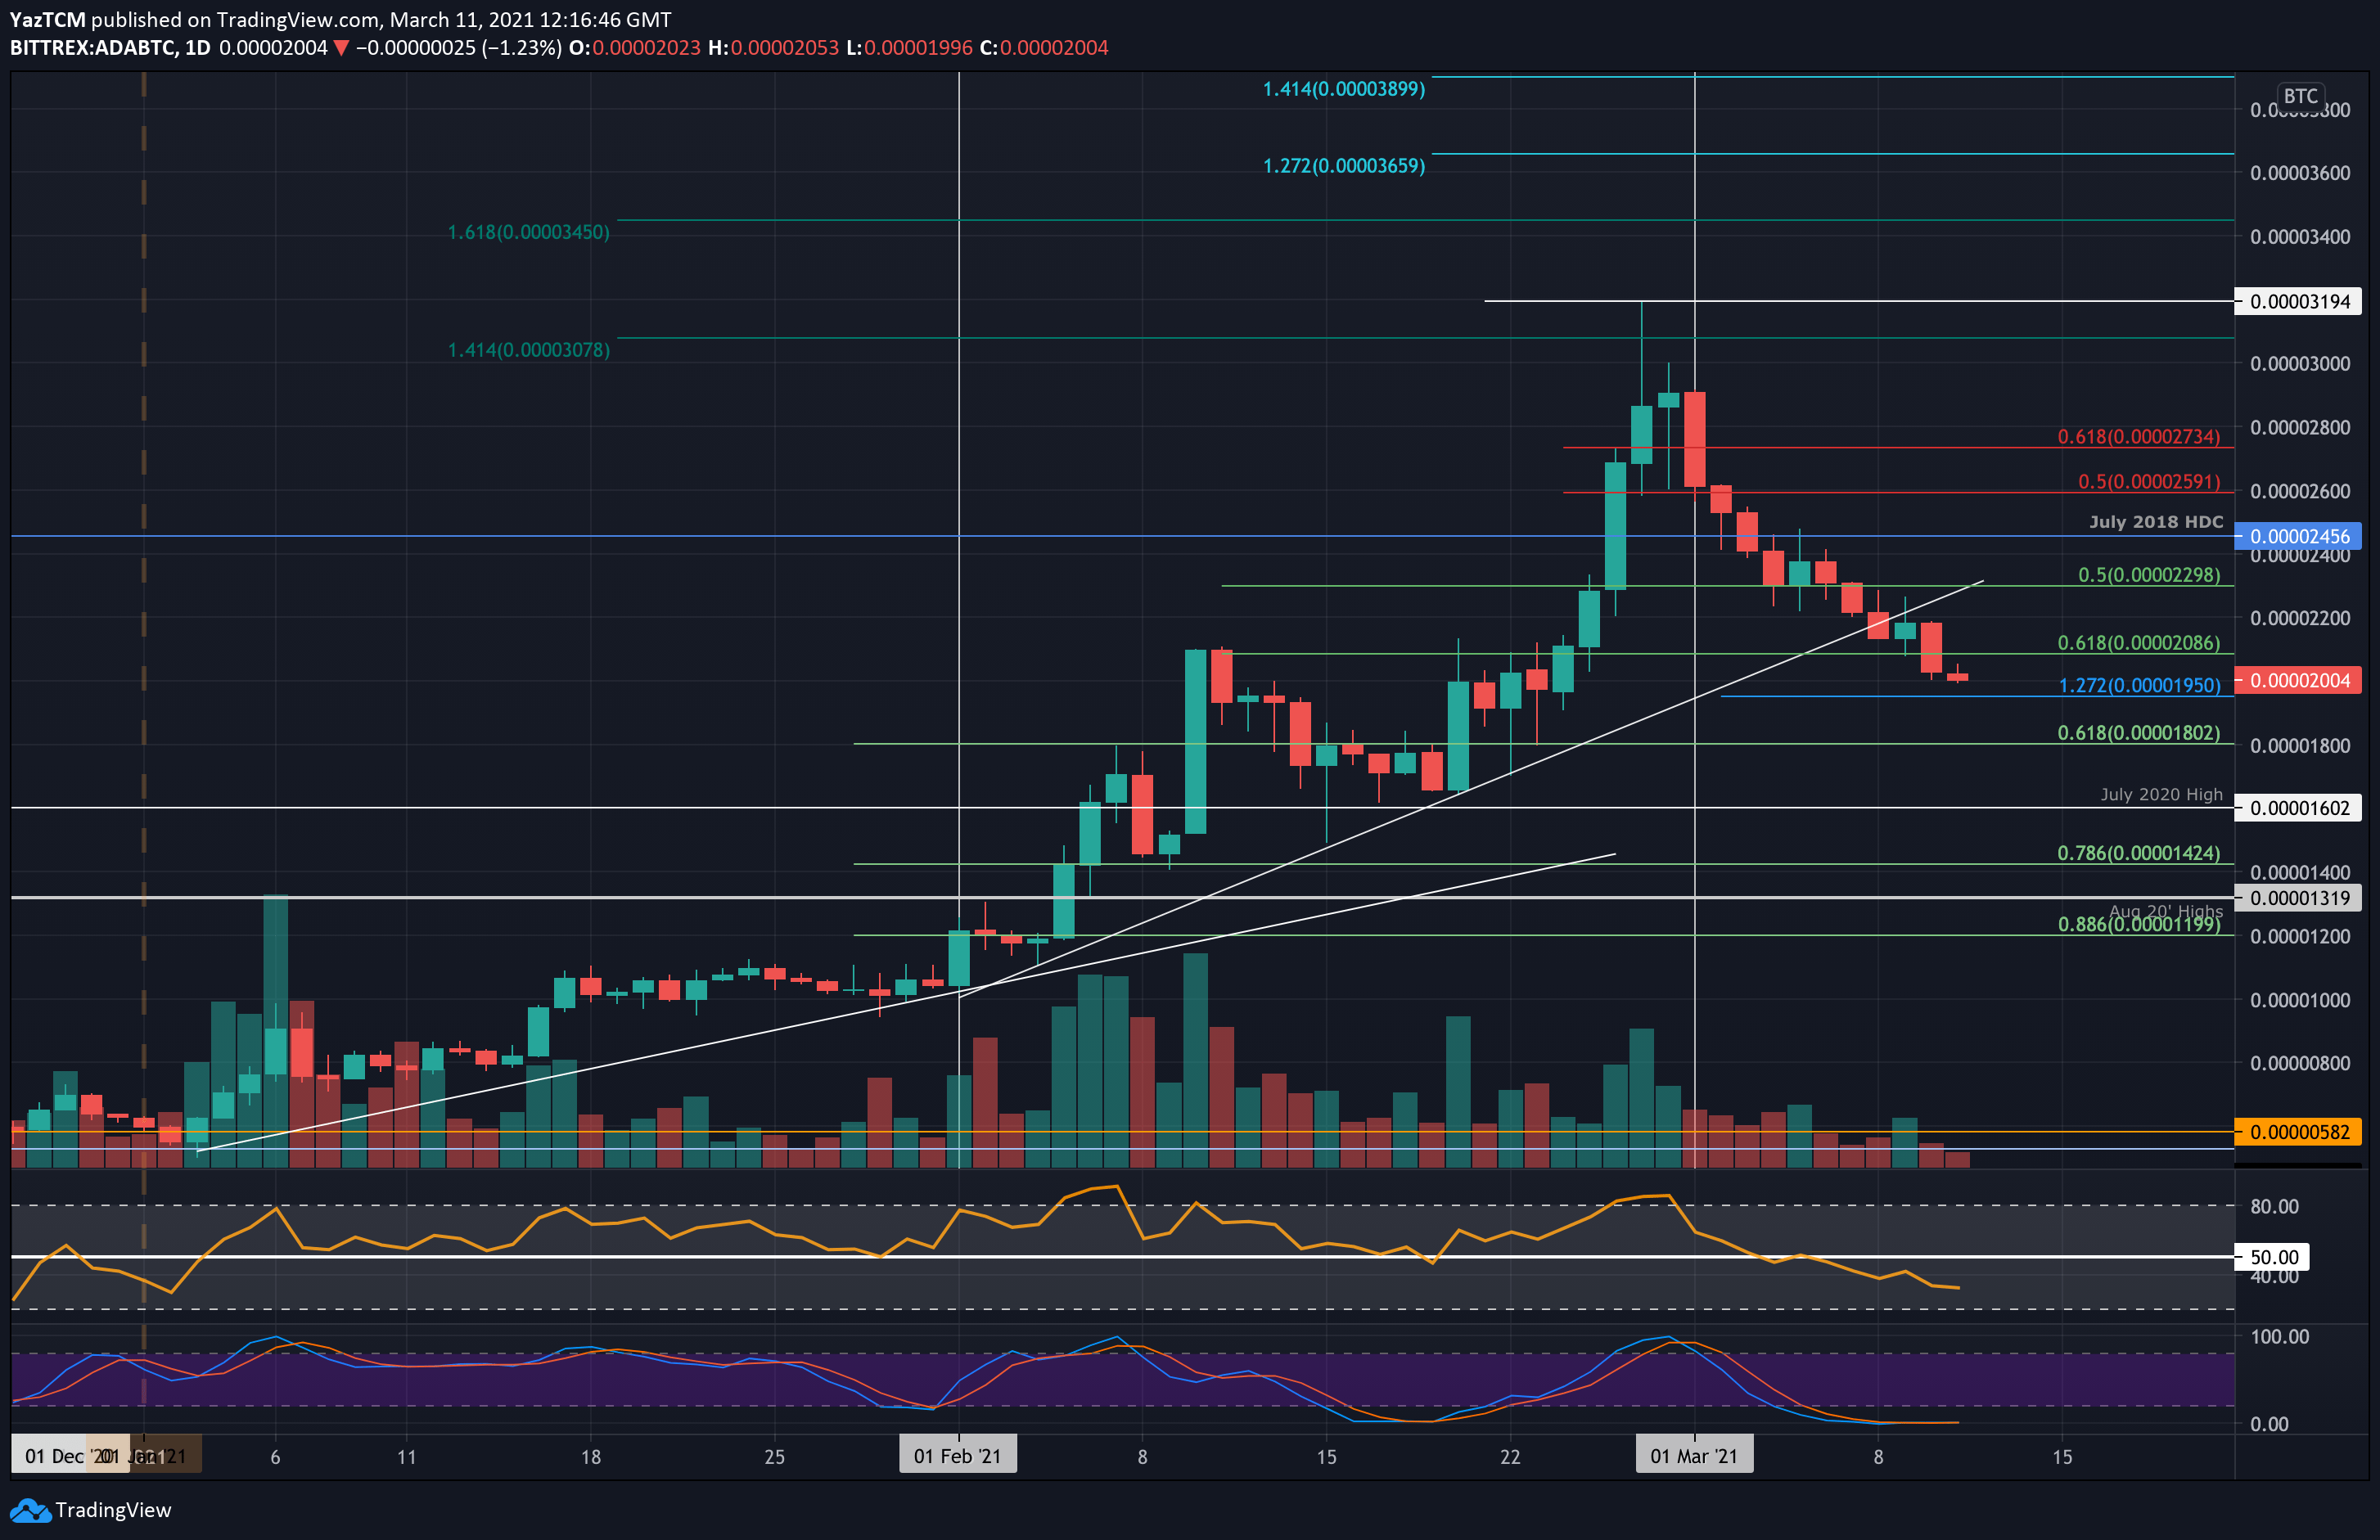
ADA-BTC Short Term Price Prediction
Looking ahead, if the bears break below 2000 SAT, the first level of support lies at 1950 SAT (downside 1.272 Fib Extension). This is followed by 1800 SAT (long-term .618 Fib), 1600 SAT (July 2020 High), and 1424 (.786 Fib).
On the other side, the first level of resistance lies at 2100 SAT. This is followed by 2300 SAT, 2456 SAT (July 2018 High-Day close), and 2600 SAT (bearish .5 Fib).
The RSI is well within the bearish favor as it falls beneath the 40 level. Interestingly, the Stochastic RSI is extremely oversold, and a bullish crossover would be the first signal to indicate that the downtrend is about to conclude.