Despite the recent market-wide crash, Ethereum continues to lead amid the large-cap cryptocurrencies. Today, we take a closer look into the following cryptos: Bitcoin Bitcoin is down by a total of 10% this week as it saw turbulence over the past two days with Telsa removing BTC payments for its vehicles. The cryptocurrency failed to break a falling resistance trend line at around ,000 at the start of the week and started to head lower from there. On Wednesday, the announcement from Tesla saw BTC dropping from the 50-days MA at around ,500 to reach as low as ,440 by the end of the day. The plummet continued yesterday as BTC dropped as low as ,000. Luckily, it rebounded by the end of the day to climb above a long-term ascending trend line. Today, it has pushed
Topics:
Yaz Sheikh considers the following as important: ADABTC, ADAUSD, Bitcoin (BTC) Price, BTC Analysis, BTCEUR, BTCGBP, btcusd, btcusdt, Cardano (ADA) Price, ETH Analysis, ETHBTC, Ethereum (ETH) Price, ethusd, Price Analysis, Ripple (XRP) Price, UNIBTC, uniswap, UNIUSD, XRP Analysis, xrpbtc, xrpusd
This could be interesting, too:
Bitcoin Schweiz News writes SEC gibt auf: Ermittlungen gegen Crypto.com offiziell eingestellt
Chayanika Deka writes XRP, SOL, and ADA Inclusion in US Crypto Reserve Pushes Traders on Edge
Chayanika Deka writes Why Arthur Hayes Is Bullish on Bitcoin Under Trump’s Economic Strategy
Mandy Williams writes Why the Bitcoin Market Is Stuck—and the Key Metric That Could Change It: CryptoQuant CEO
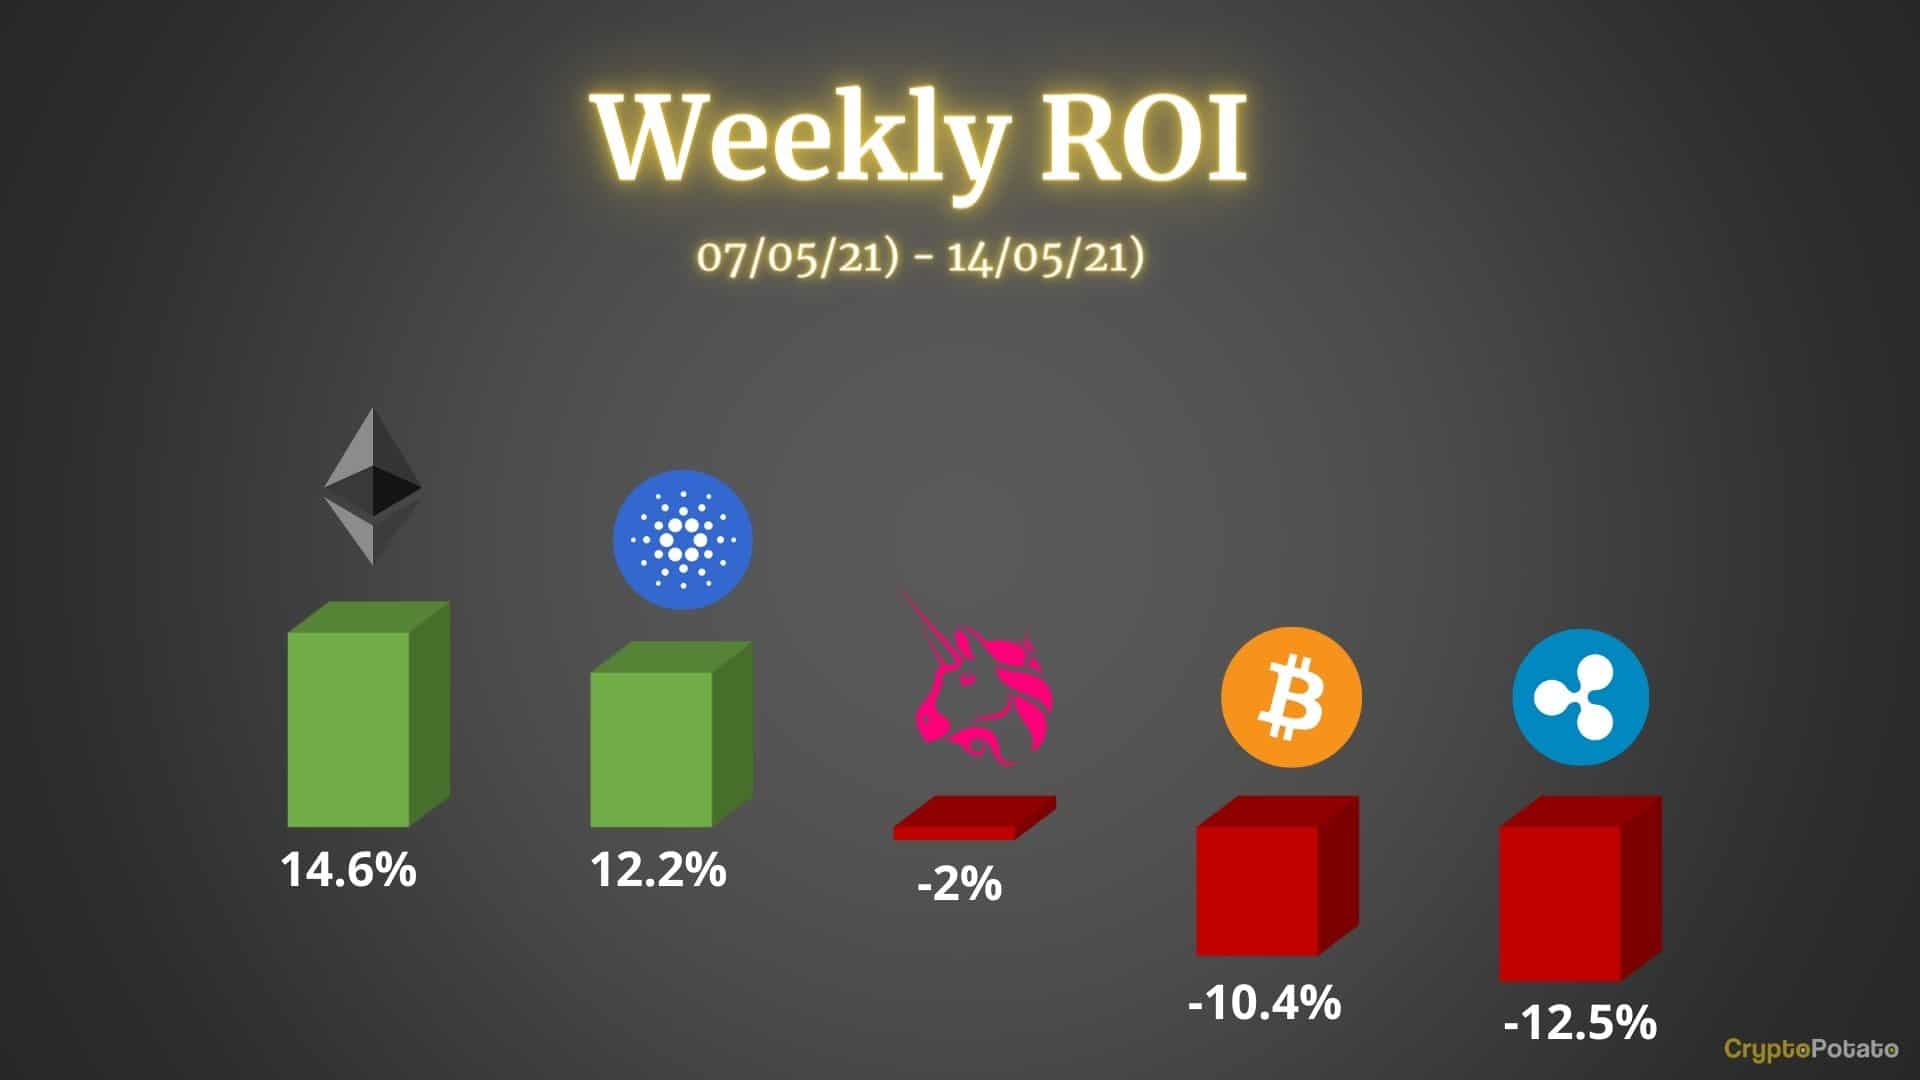
Despite the recent market-wide crash, Ethereum continues to lead amid the large-cap cryptocurrencies. Today, we take a closer look into the following cryptos:
Bitcoin
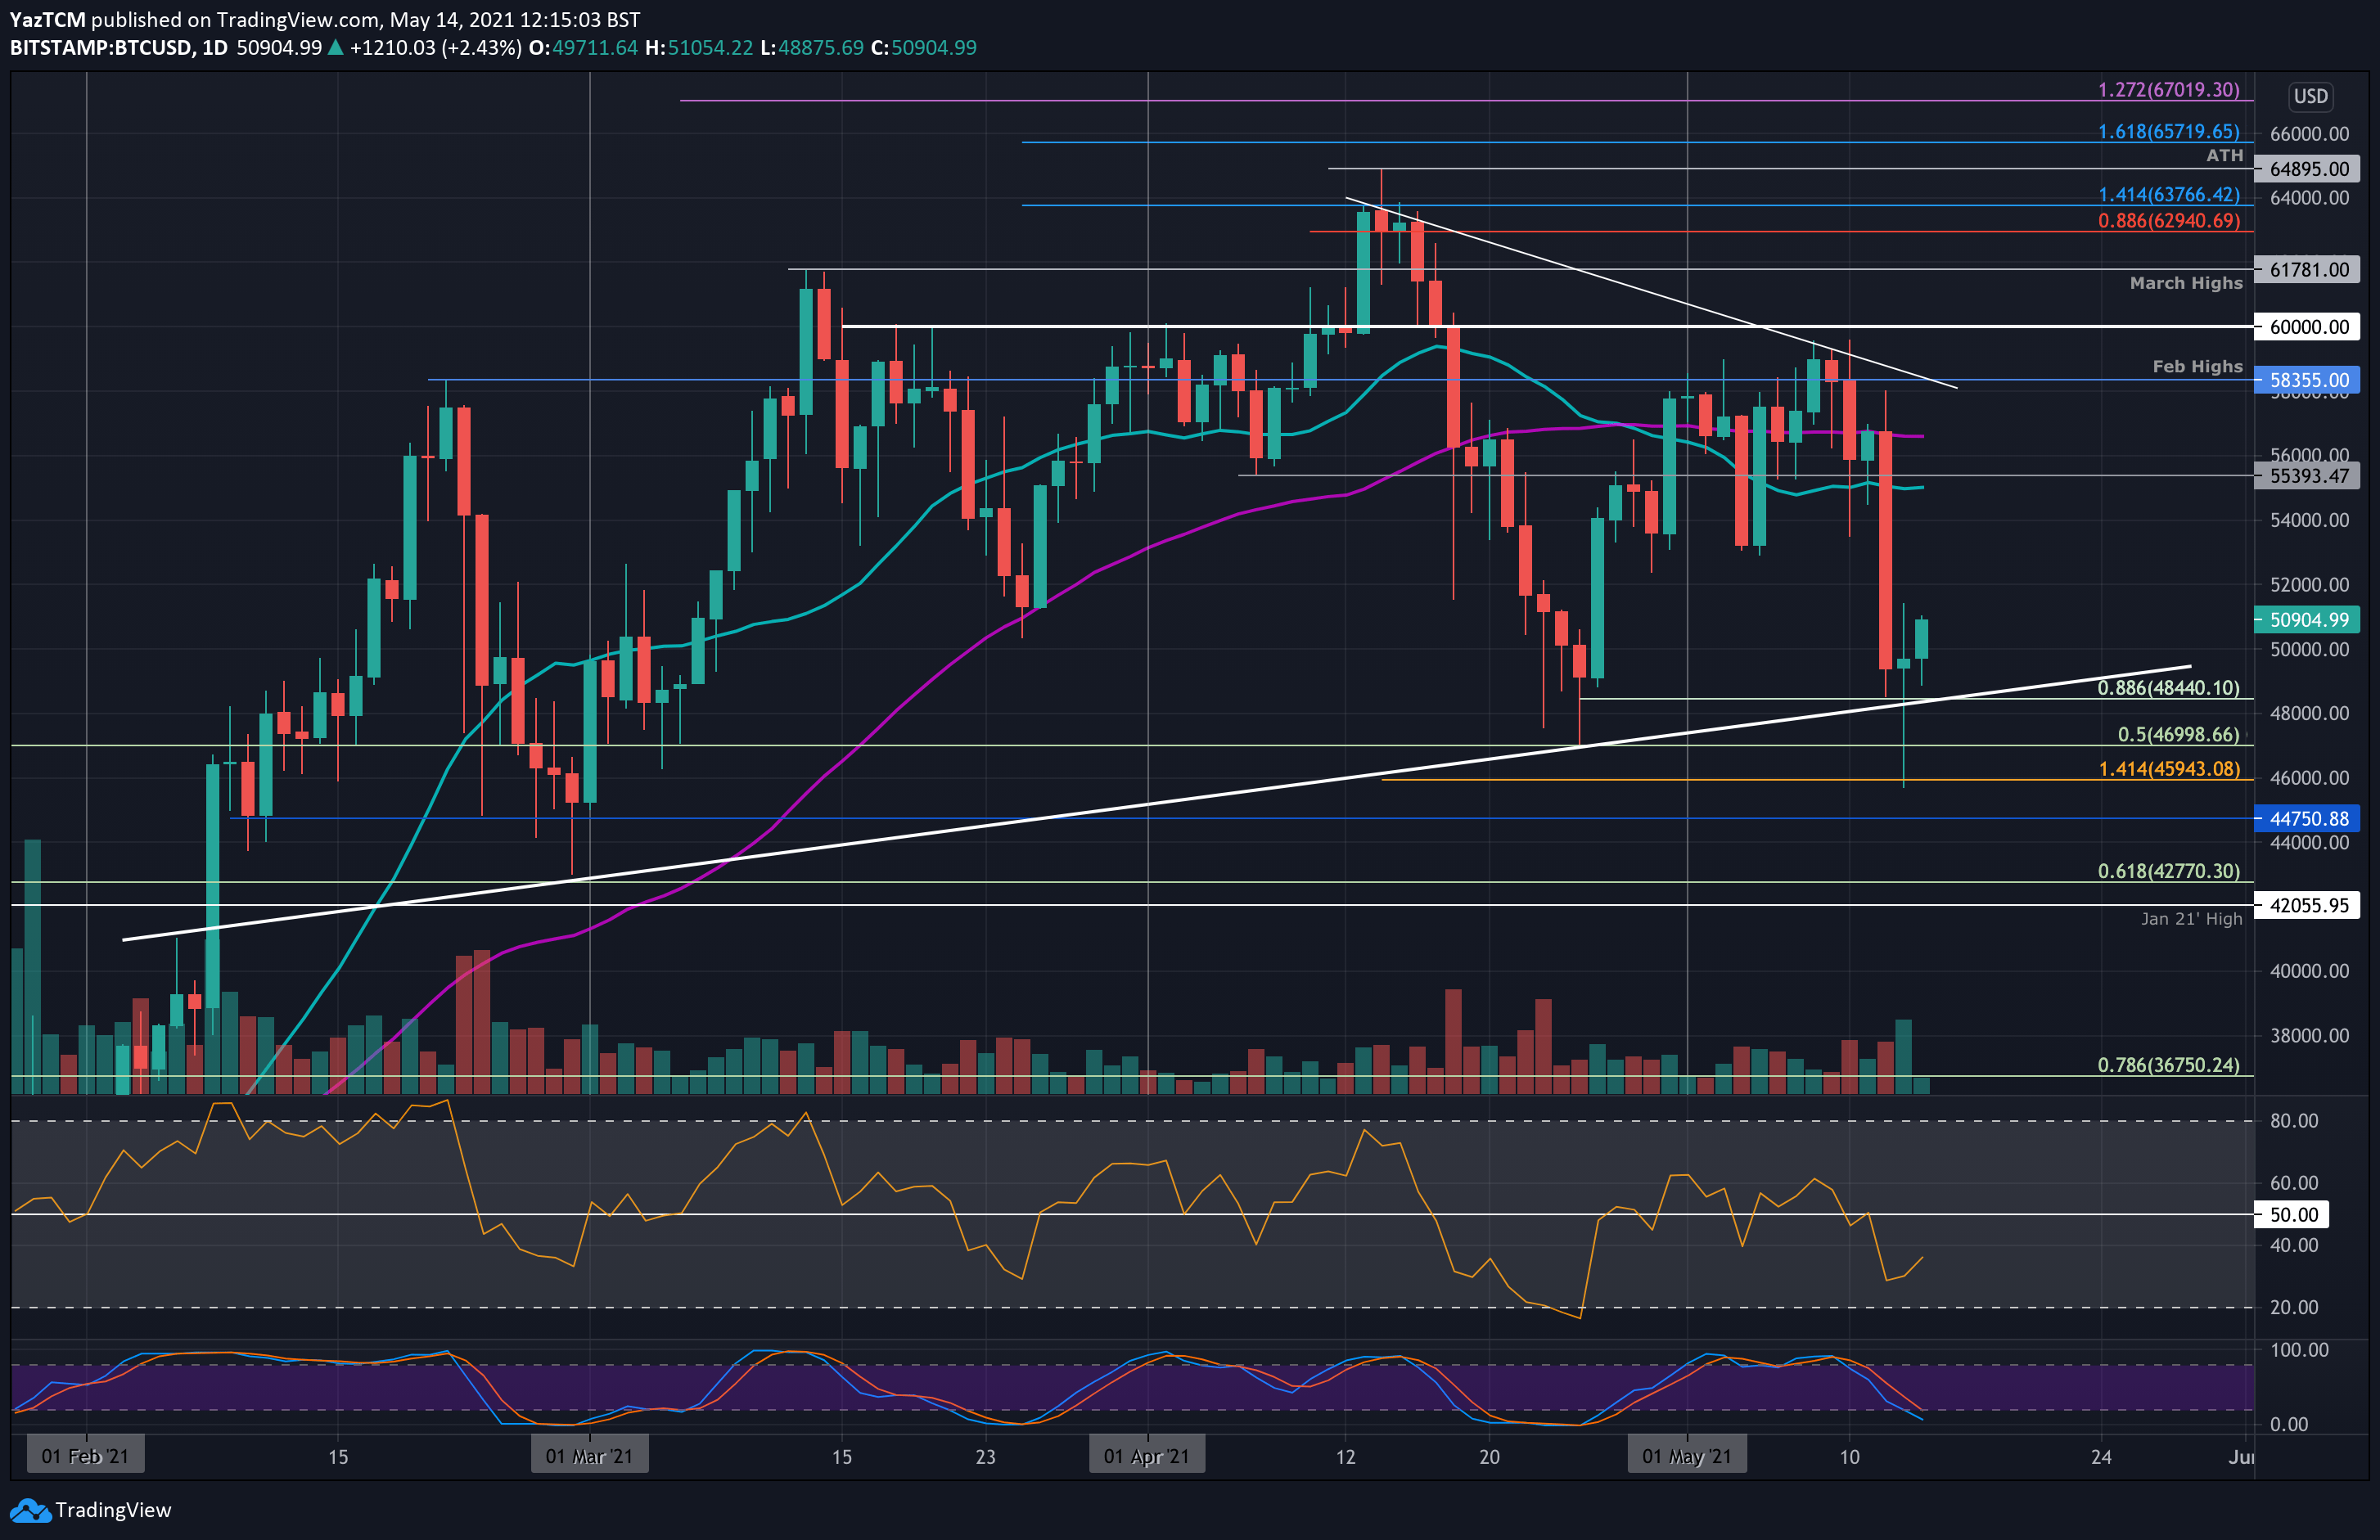
Bitcoin is down by a total of 10% this week as it saw turbulence over the past two days with Telsa removing BTC payments for its vehicles. The cryptocurrency failed to break a falling resistance trend line at around $59,000 at the start of the week and started to head lower from there.
On Wednesday, the announcement from Tesla saw BTC dropping from the 50-days MA at around $56,500 to reach as low as $48,440 by the end of the day. The plummet continued yesterday as BTC dropped as low as $46,000. Luckily, it rebounded by the end of the day to climb above a long-term ascending trend line. Today, it has pushed higher back above $50,000.
Looking ahead, the first resistance lies at $51,000 (bearish .382 Fib). This is followed by $52,650 (bearish .5 Fib), $54,275 (bearish .618 Fib), and $56,500 (50-days MA).
On the other side, the first support now lies at $50,000. This is followed by $48,440 (rising trend line), $47,000 (long term .5 Fib), $46,000 (weekly low), and $44,750.
Ethereum
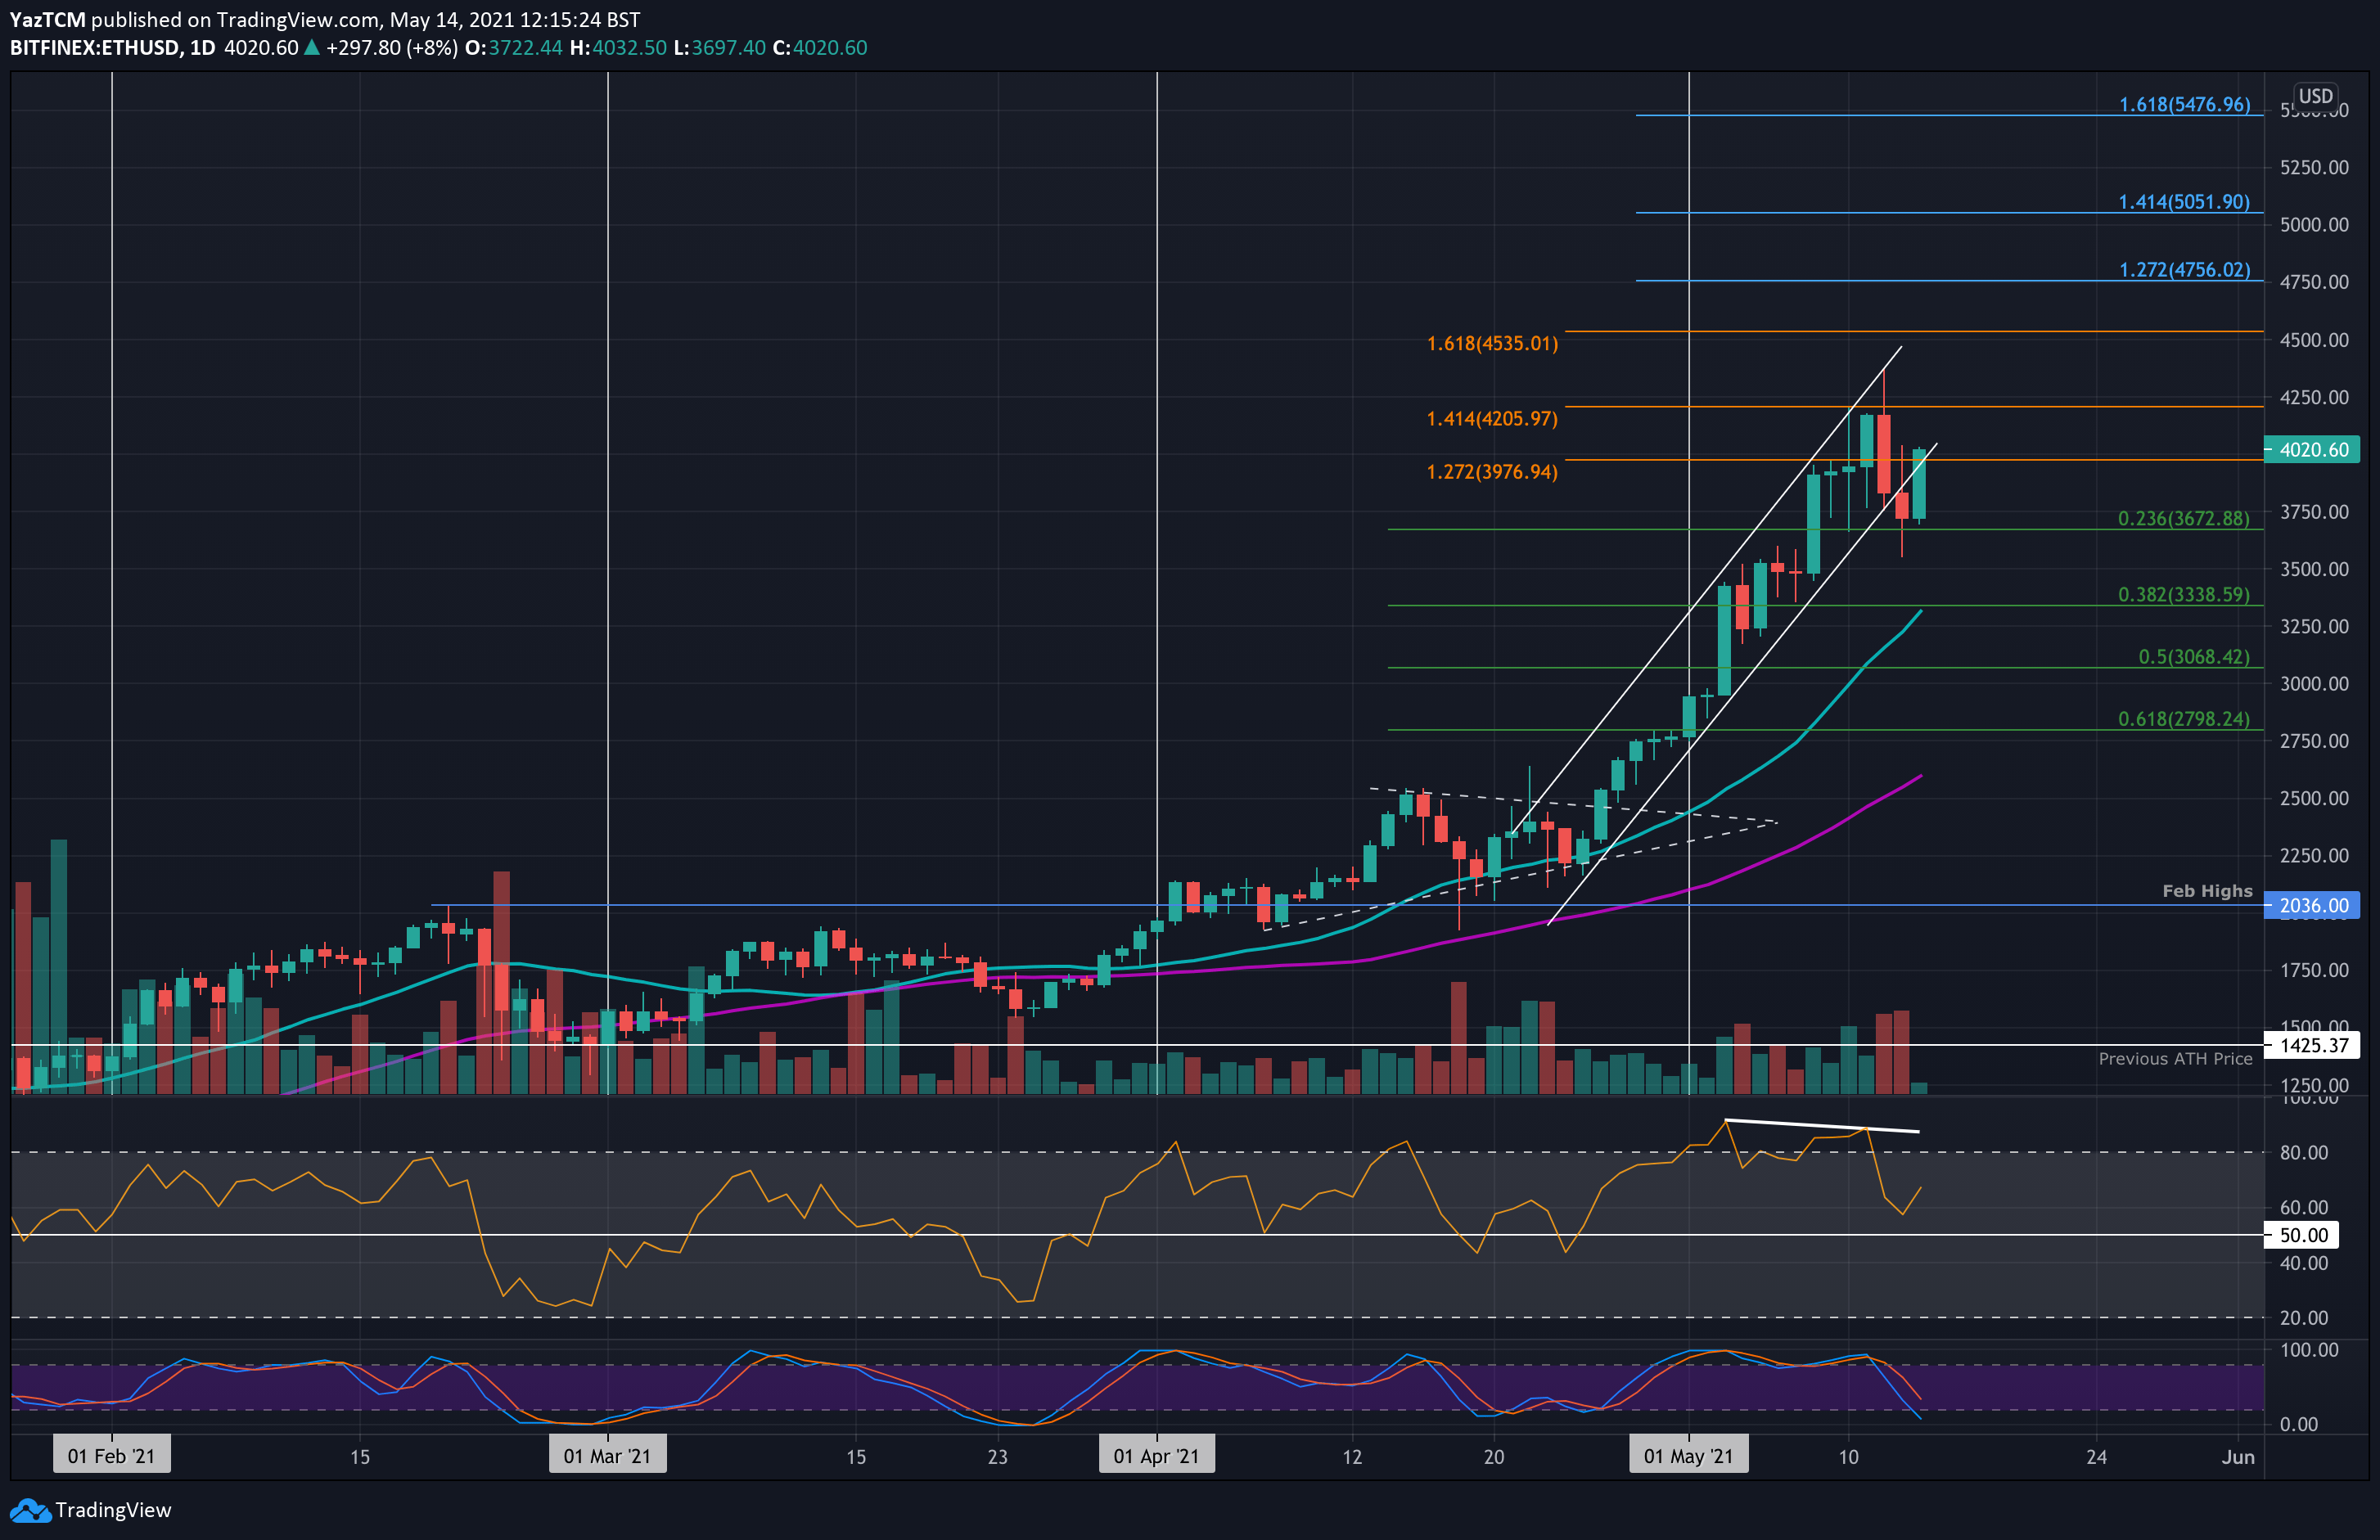
Ethereum is up by a total of 14.6% from last week’s price as it currently sits at $4,000. The coin was trading inside a steep ascending price channel since the end of April as it pushed higher to set a new ATH this week at $4373.
From there, ETH rolled over when BTC collapsed beneath $50,000 – causing ETH to drop beneath the price channel. It found support around $3670 (.236 Fib) and rebounded today to break back above $4000.
Looking ahead, the first resistance lies at $4200 (1.414 Fib Extension). This is followed by the ATH at $4373, $4535 (1.618 Fib Extension), and $4755 (1.272 Fib Extension – blue).
On the other side, the first support comes in at $3672 (.236 Fib). This is followed by $3500, $3338 (.382 Fib & 20-day MA), $3250, and $3070 (.5 Fib).
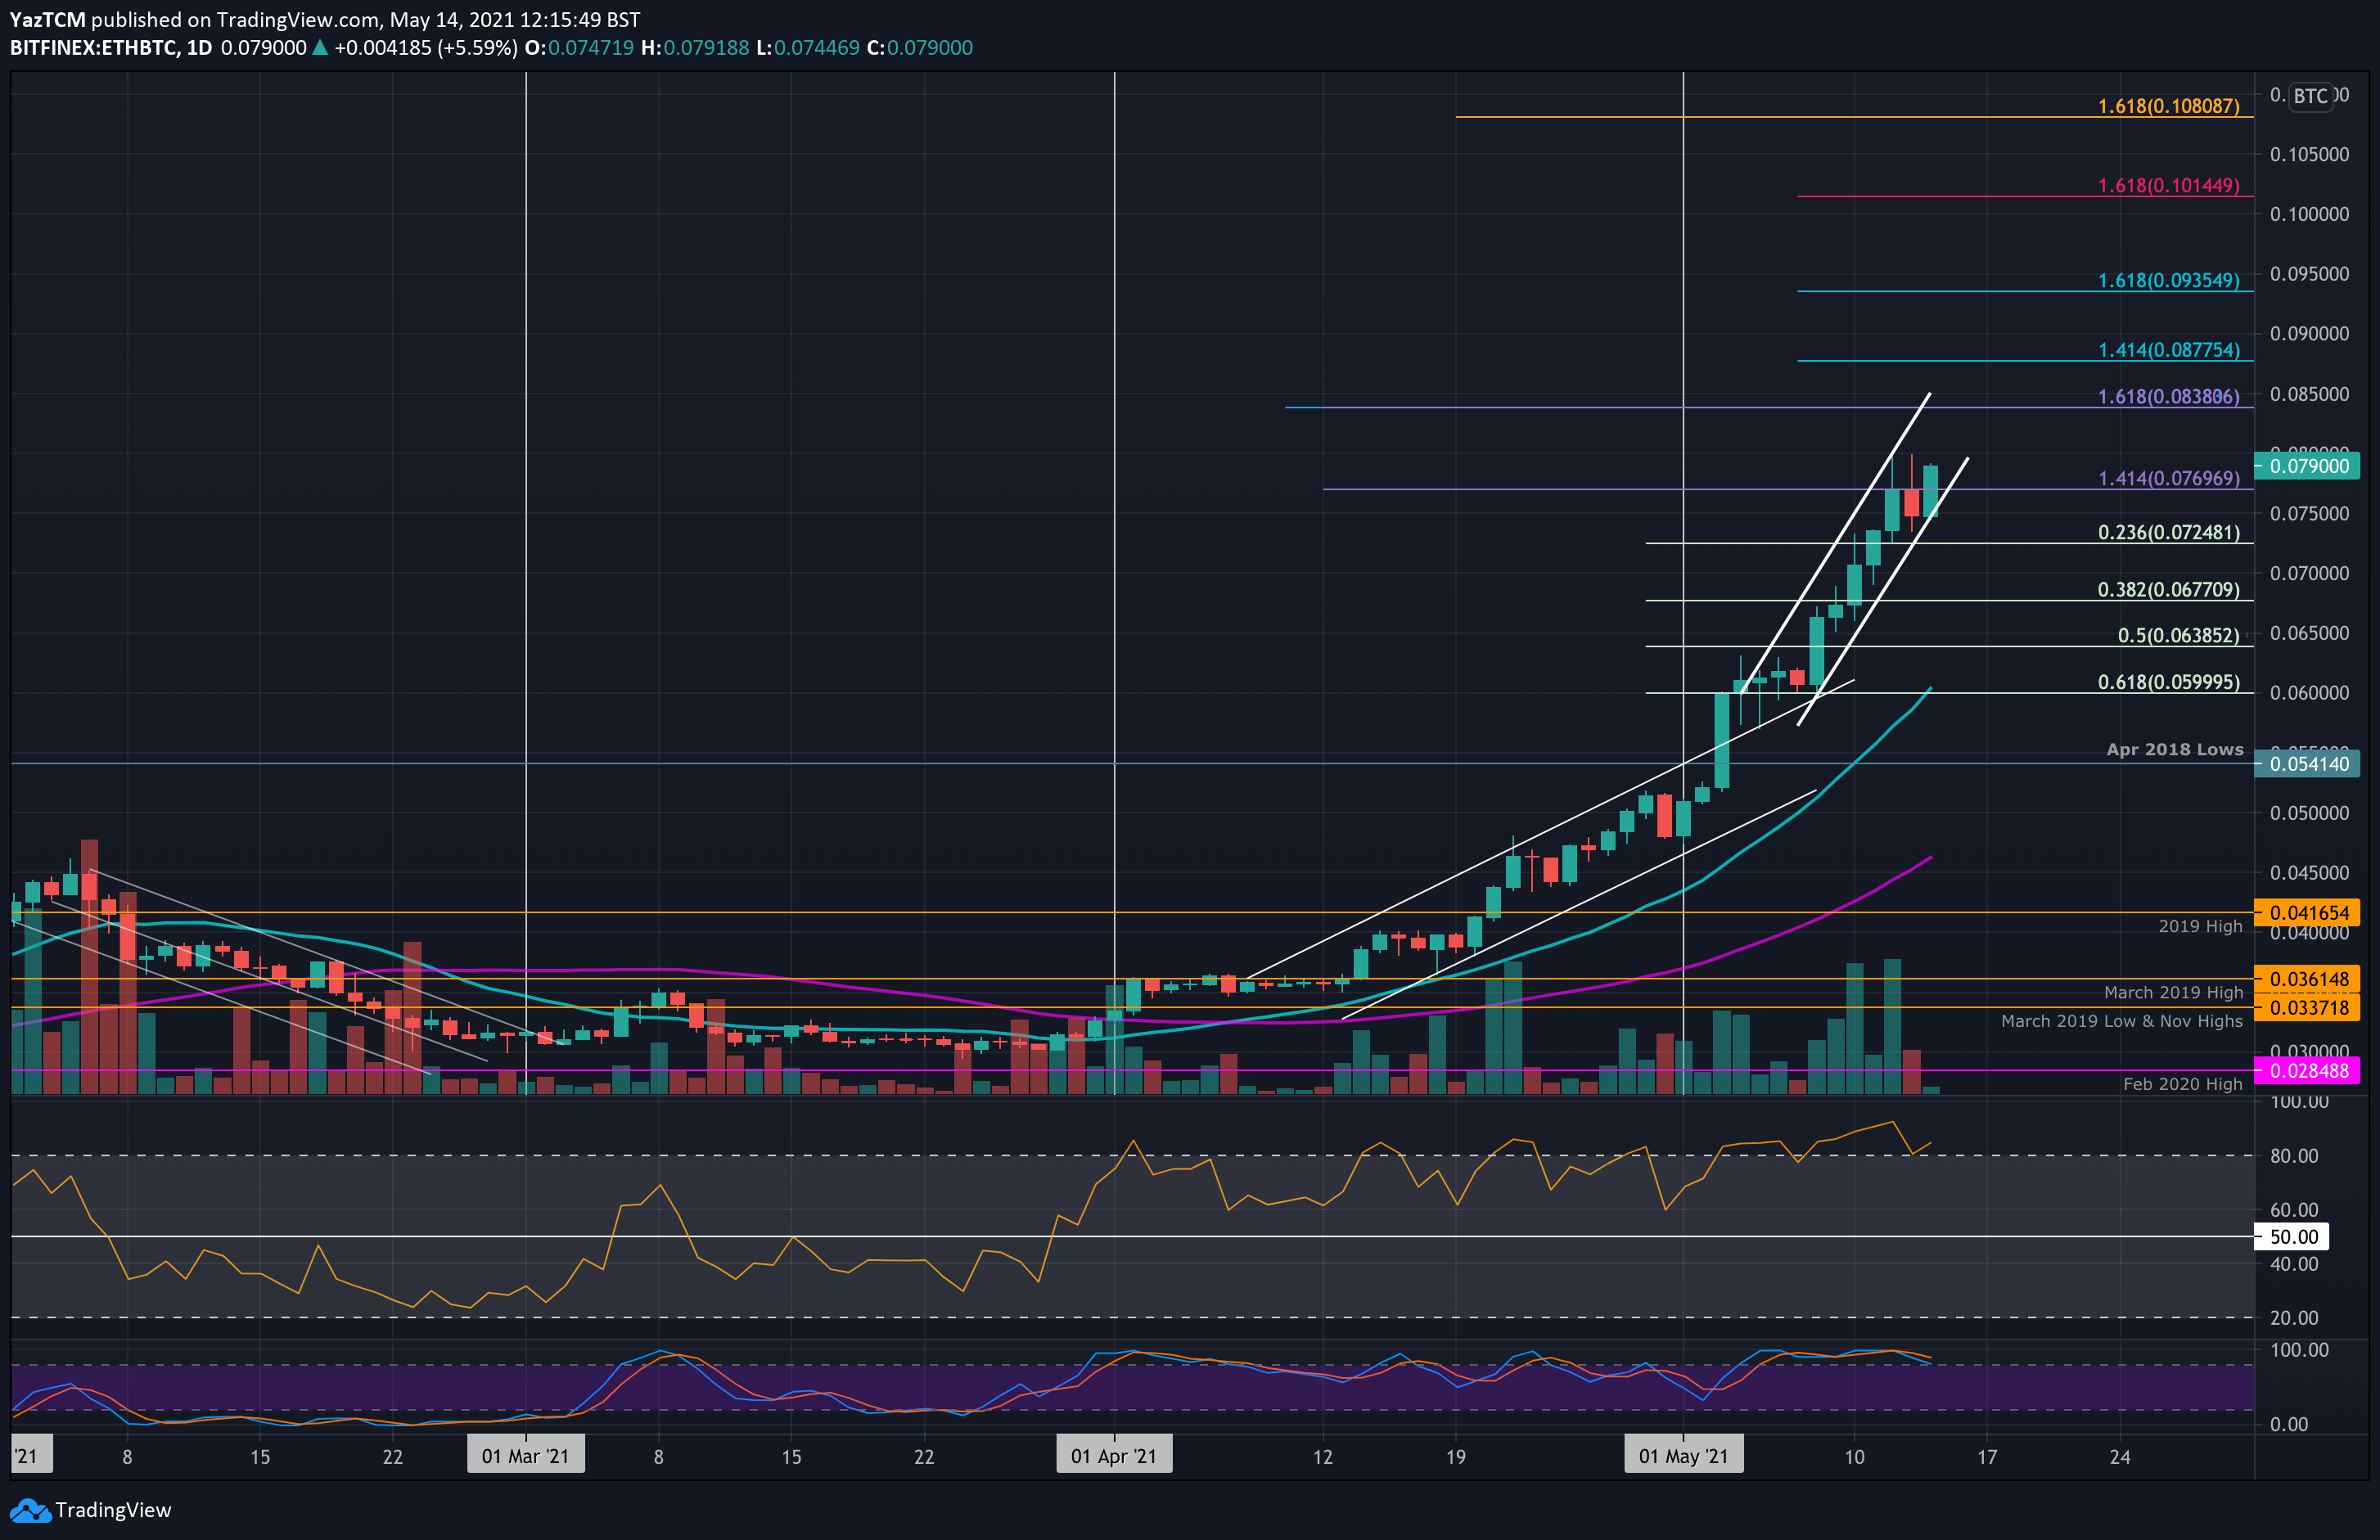
ETH is also outperforming bitcoin itself this week as it sets a new 2021 high at 0.08 BTC. The coin was trading at around 0.06 BTC at the start of the week as it started to shoot higher inside an ascending price channel.
After hitting 0.08 BTC, ETH dropped slightly but found support at the lower boundary of the price channel. It is now trading around 0.079 BTC.
Looking ahead, the first resistance lies at 0.08 BTC. This is followed by 0.083 BTC (1.618 Fib Extension), 0.0875 BTC (1.414 Fib Extension – blue), and 0.09 BTC.
On the other side, the first support lies at 0.075 BTC. This is followed by 0.0725 BTC (.236 Fib), 0.07 BTC, 0.0677 BTC (.382 Fib), and 0.0638 BTC (.5 Fib).
Ripple
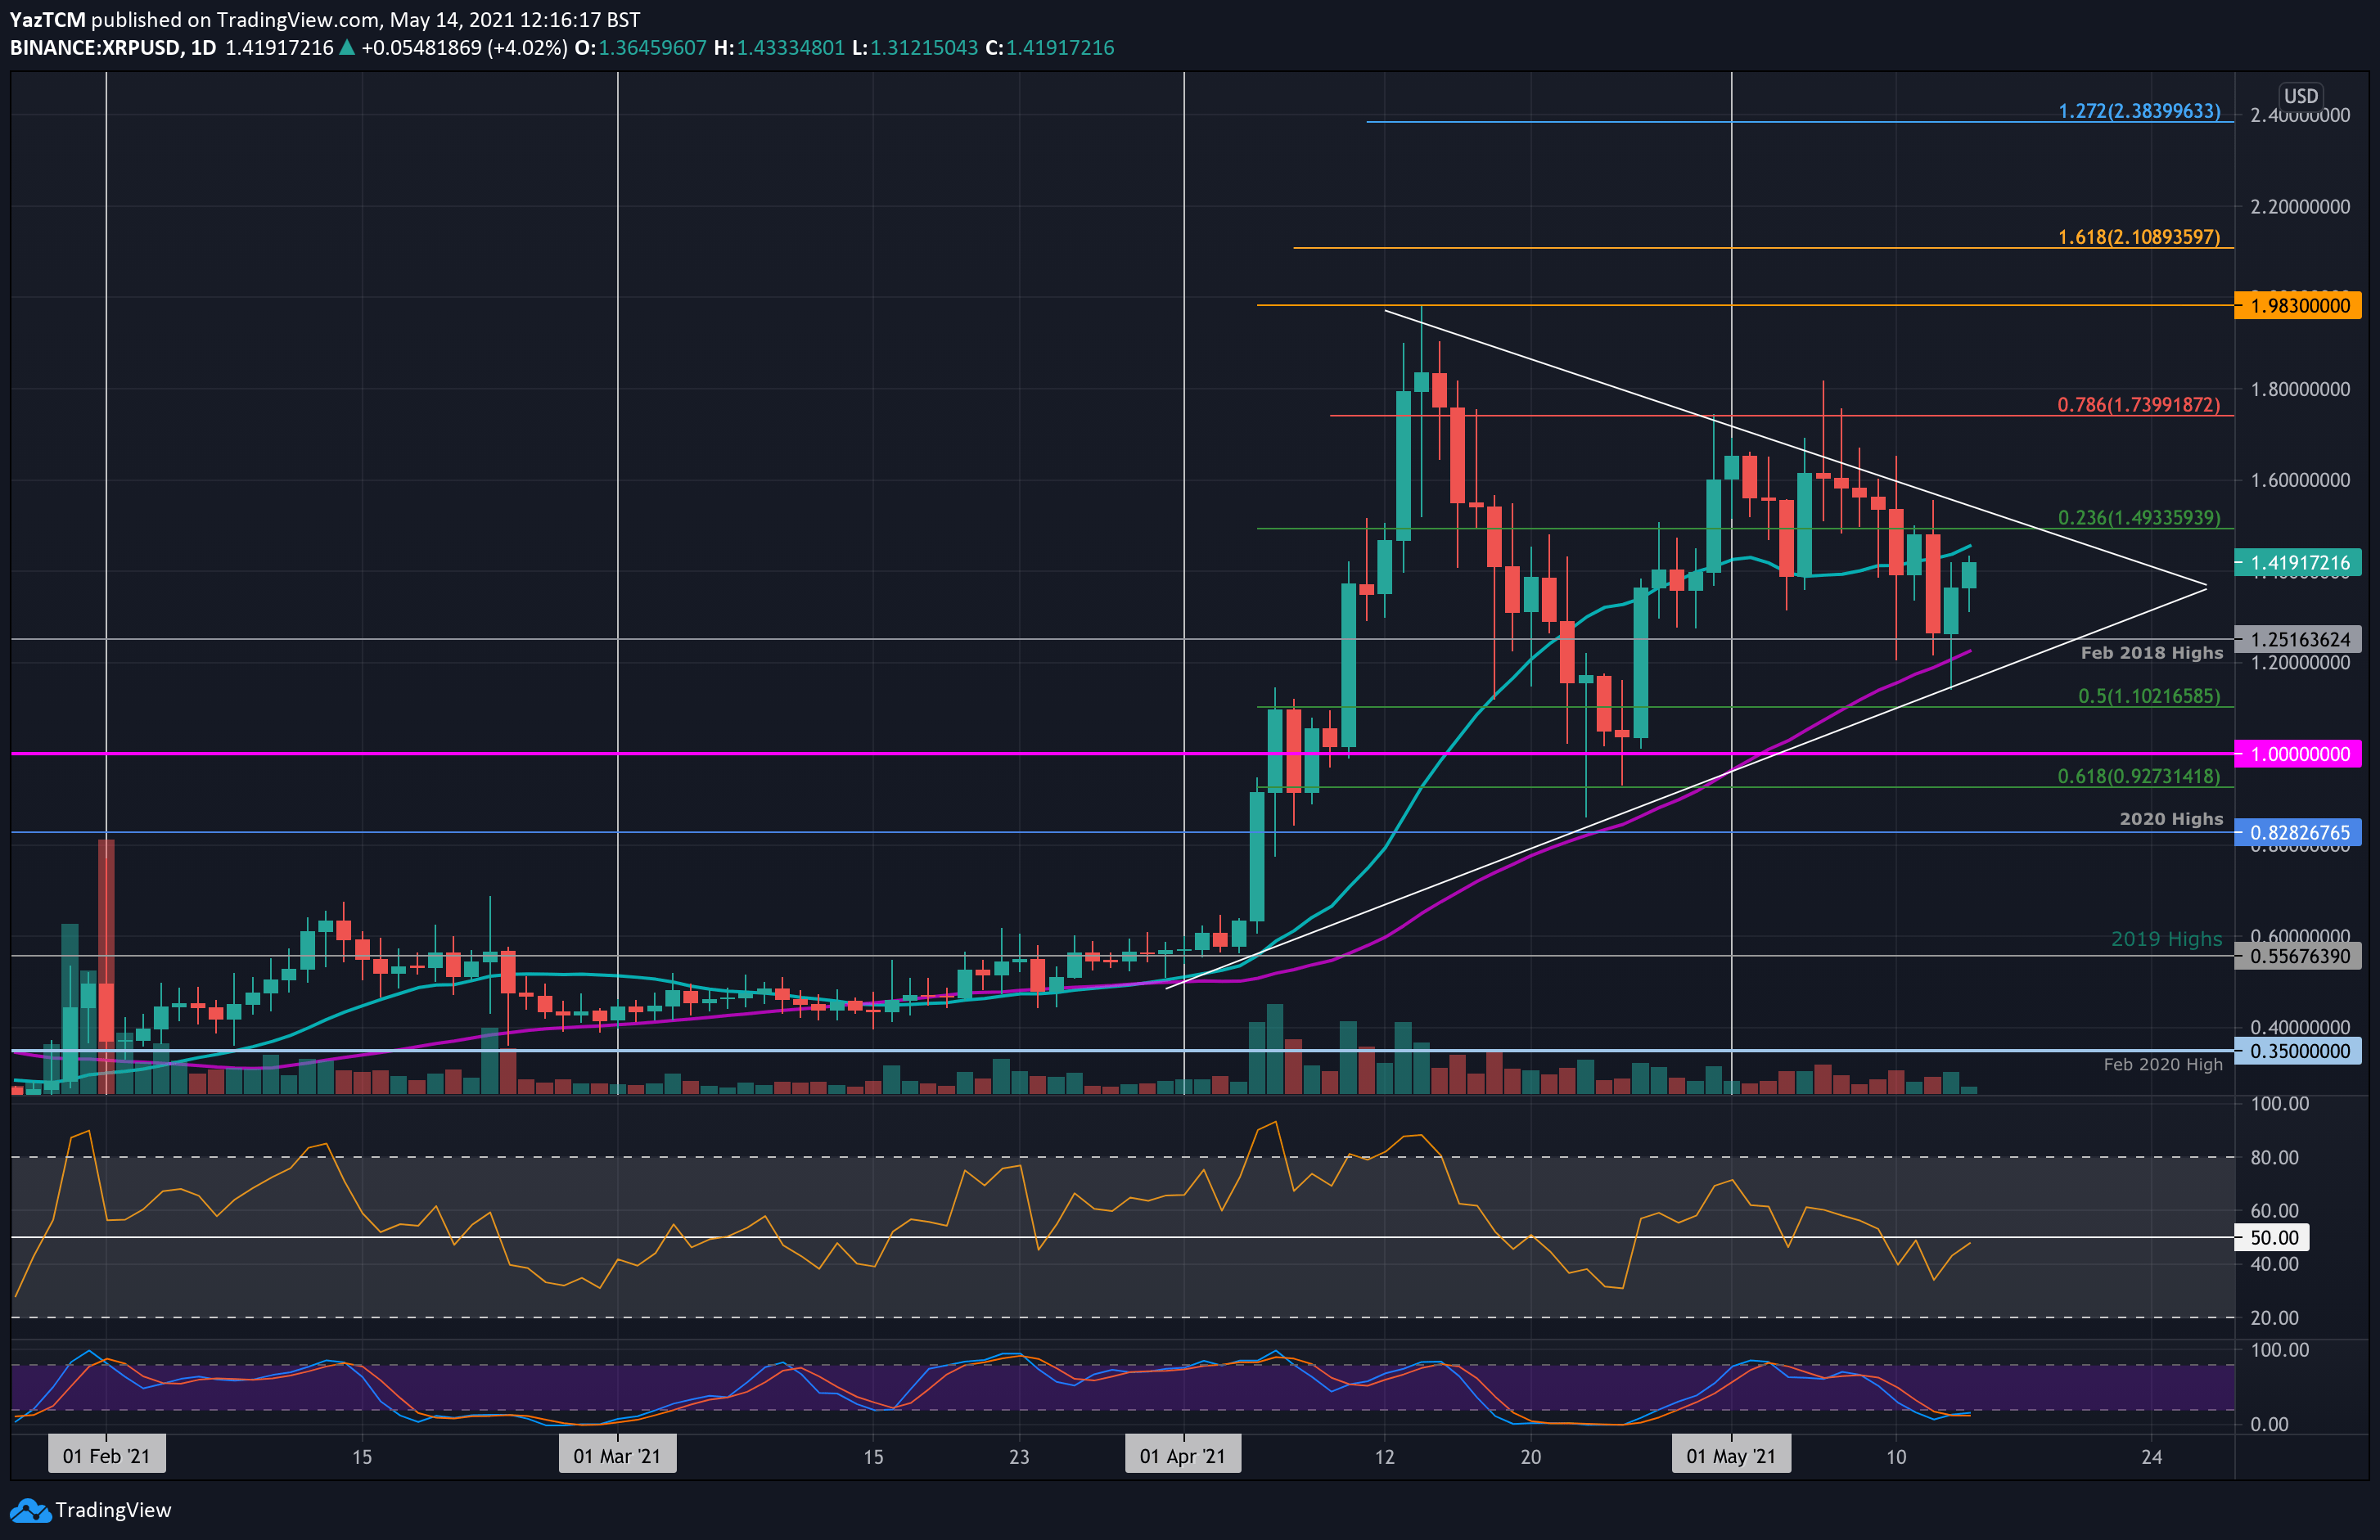
XRP suffered a sharp 12.5% price fall this week as it sits at $1.42. The coin was trading inside a symmetrical triangle pattern and failed to break above the upper boundary of this triangle at around $1.60 during the beginning of the week.
During the BTC price drop, XRP fell as low as $1.15, where it met support at the lower boundary of the triangle. It closed the daily candle at $1.25 (Feb 2018 highs) and rebounded from there yesterday to trade at $1.42 today.
Looking ahead, the first resistance lies at $1.50. This is followed by the upper boundary of the triangle, $1.60, $1.75 (bearish .786 Fib), and $1.82 (May highs).
On the other side, the first support lies at $1.25 (Fen 2018 highs). This is followed by the lower boundary of the triangle, $1.10 (.5 Fib) and $1.00.
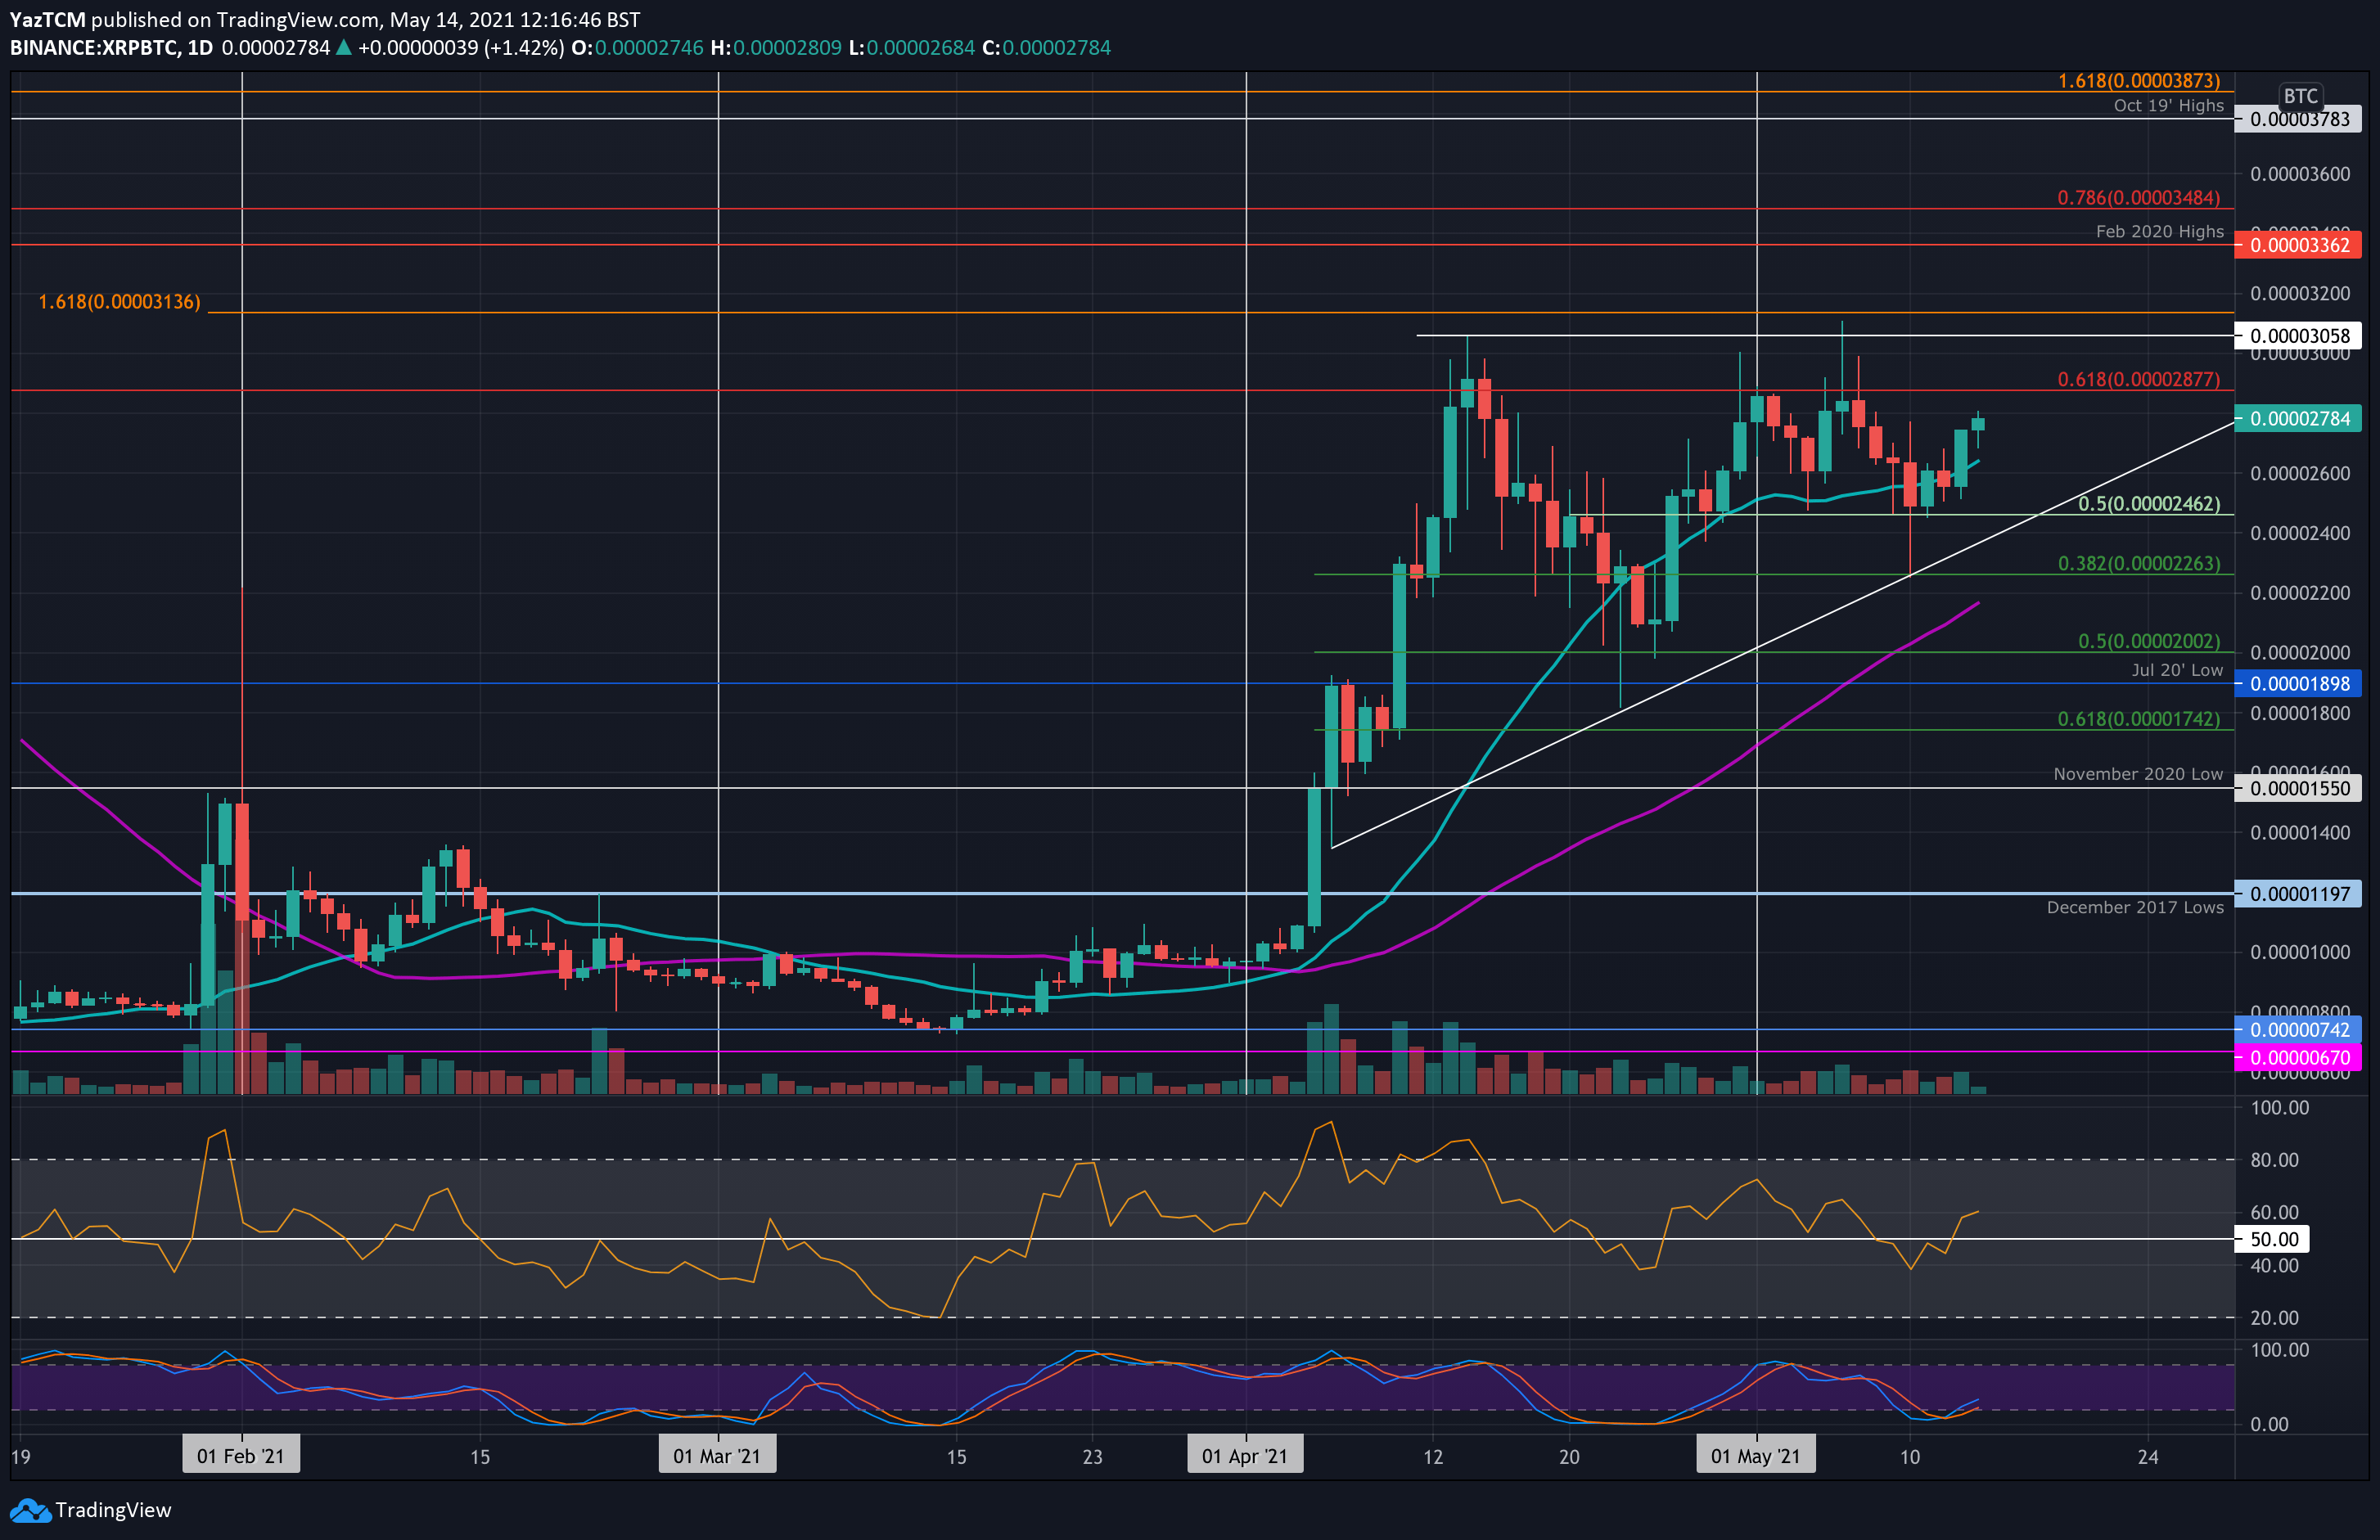
Against bitcoin, XRP is currently trading inside an ascending price channel with the roof at around 3058 SAT (April highs). The coin started the week by dropping from 2877 SAT as it started to slide into the 2462 SAT (.5 Fib) support.
It did drop as low as 2263 SAT on Monday but found support at the lower boundary of the triangle and rebounded back above 2462 SAT. It has since pushed higher to trade around 2800 SAT.
Looking ahead, the first resistance lies at 2877 SAT (bearish .618 Fib). This is followed by 3058 SAT (upper boundary of the triangle), 3200 SAT, and 3362 SAT (Feb 2020 Highs).
On the other side, the first support lies at 2600 SAT (20-day MA). This is followed by the lower boundary of the triangle at around 2462 SAT (short-term .5 Fib), 2260 SAT (.382 Fib), 2200 SAT (50-day MA), and 2000 SAT (.5 Fib).
Cardano
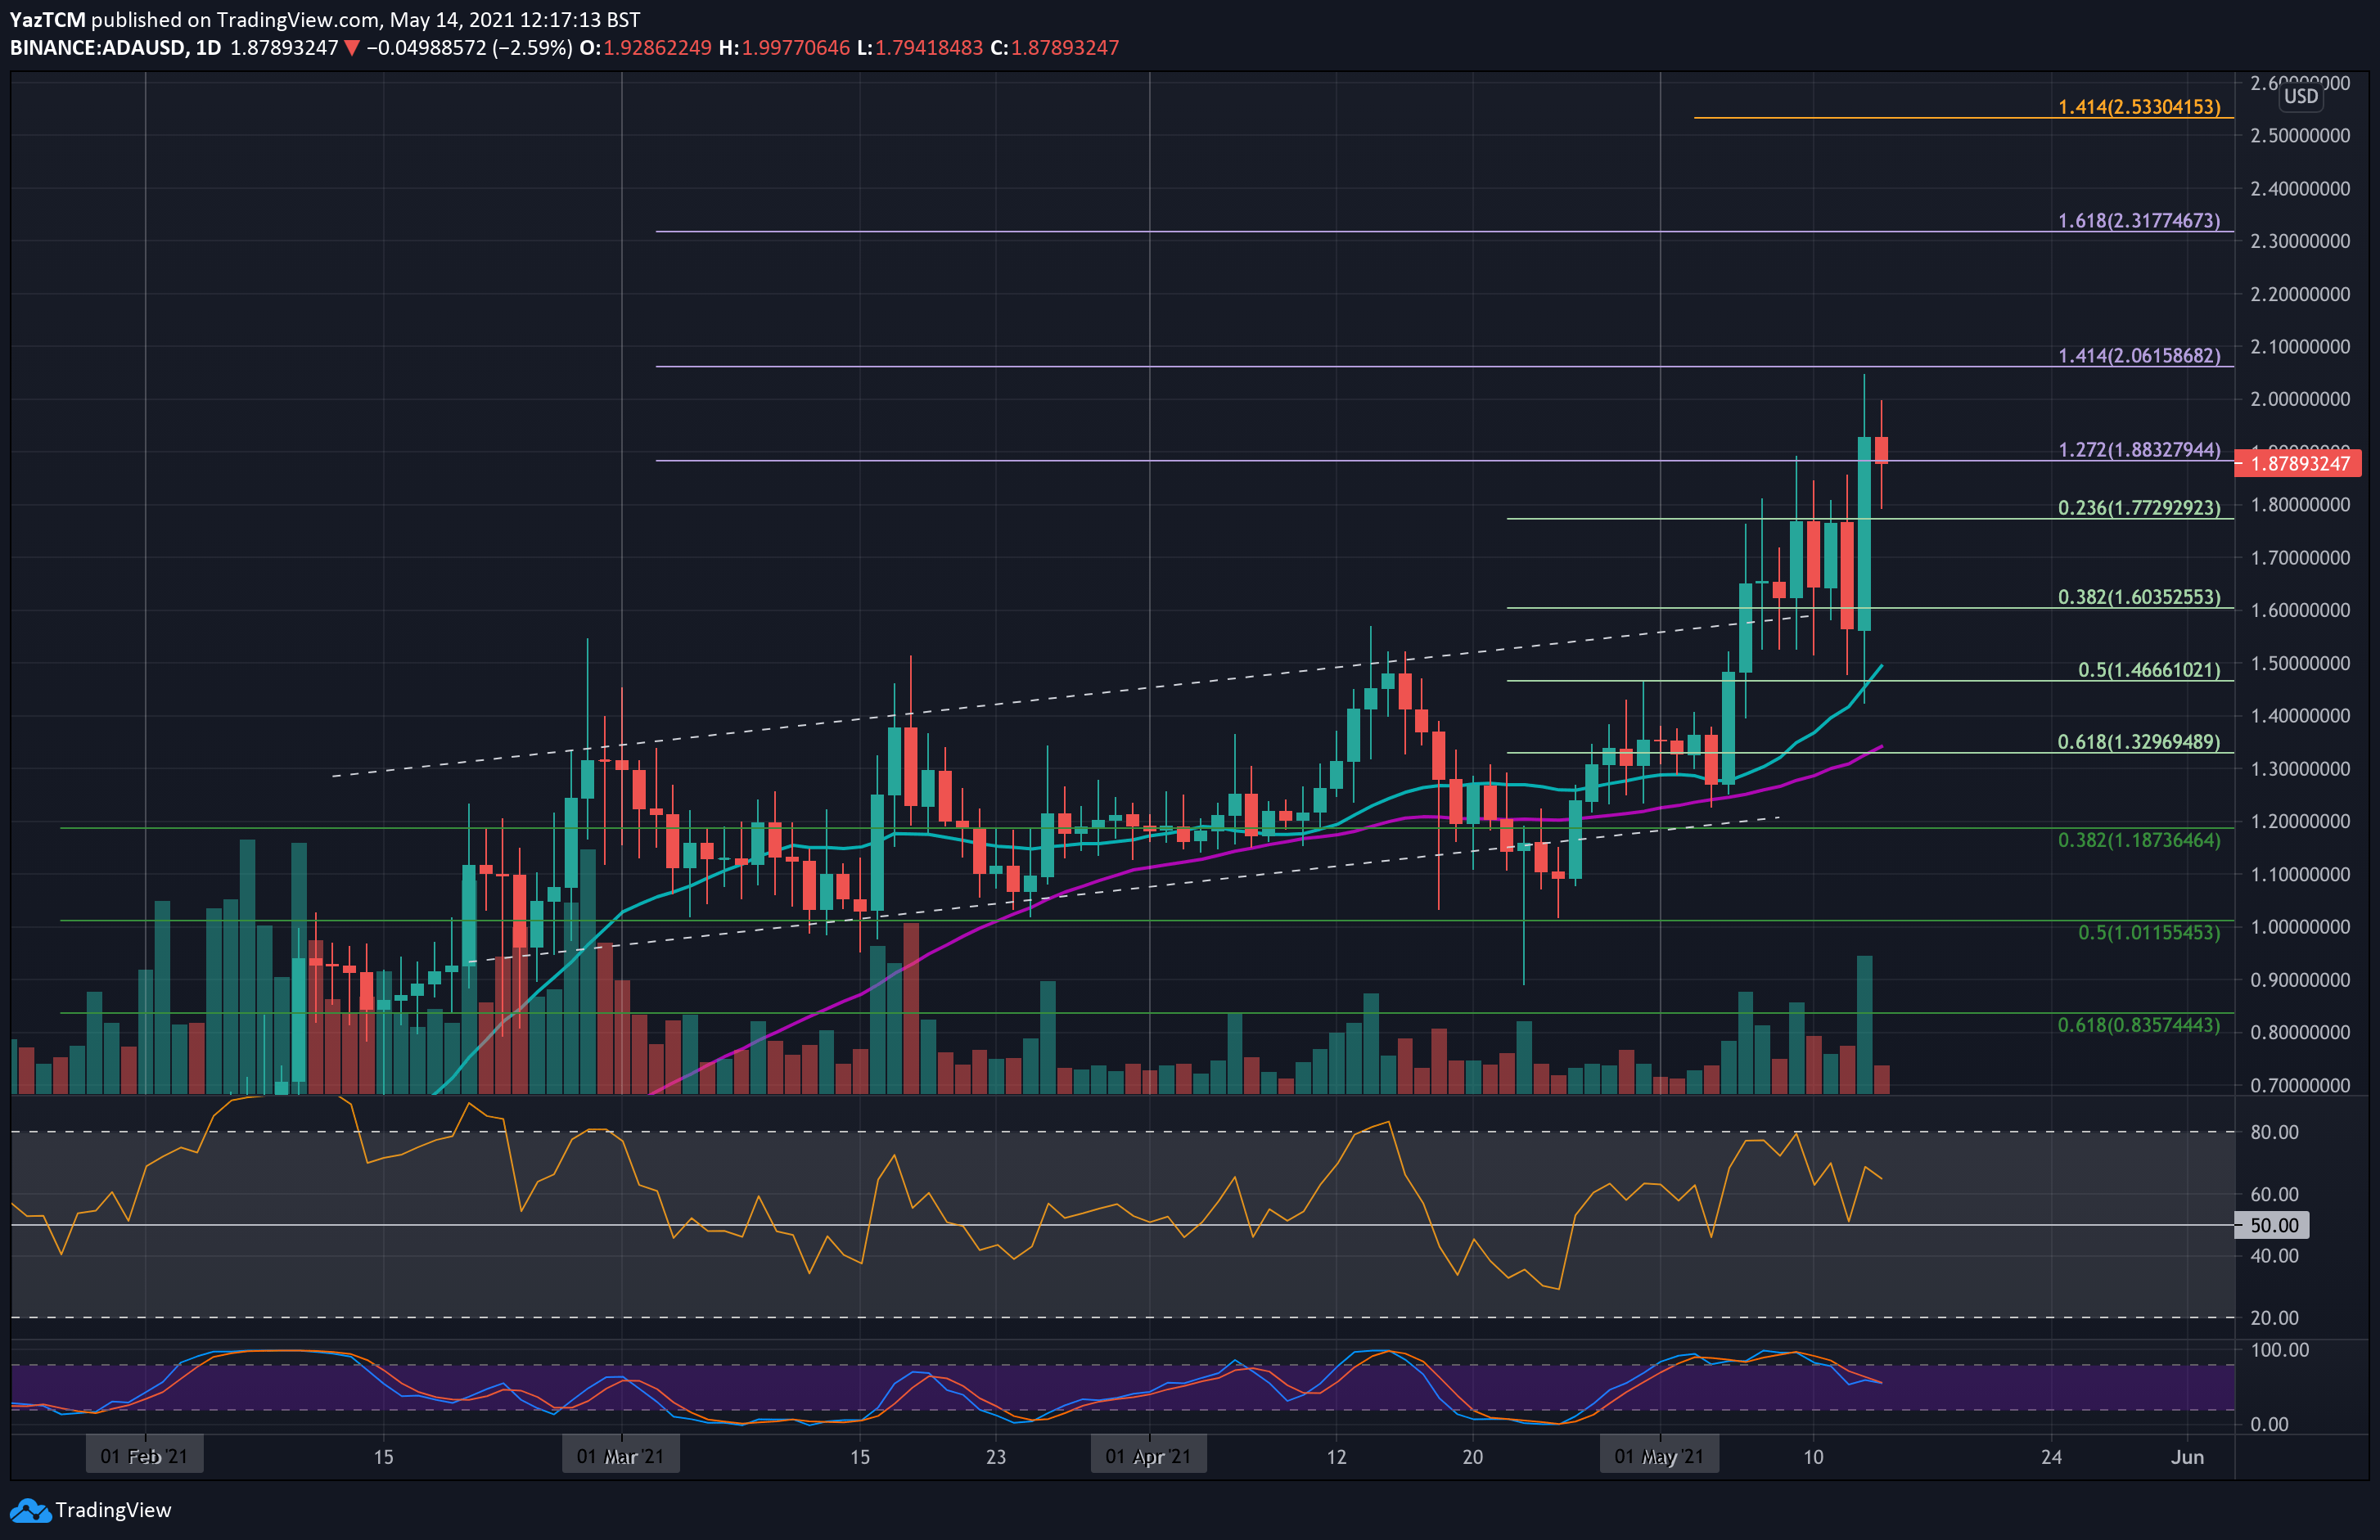
ADA is up by a solid 12.2% this week and set a new ATH price at $2.05 yesterday. The coin had surged higher over the weekend to break above a long-term ascending price channel and meet resistance at around $1.80 during the majority of the week.
The resistance at $1.80 was not penetrated until yesterday when ADA managed to surge to around $2.05. It has since dropped from there to trade at $1.87 today.
Looking ahead, the first resistance lies at $2.00. This is followed by $2.06 (1.414 Fib Extension), $2.20, and $2.31 (1.618 Fib Extension). Added resistance is expected at $2.40 and $2.53.
On the other side, the first support lies at $1.77 (.236 Fib). This is followed by $1.70, $1.60 (.382 Fib), $1.50 (20-day MA), and $1.46 (.5 Fib).
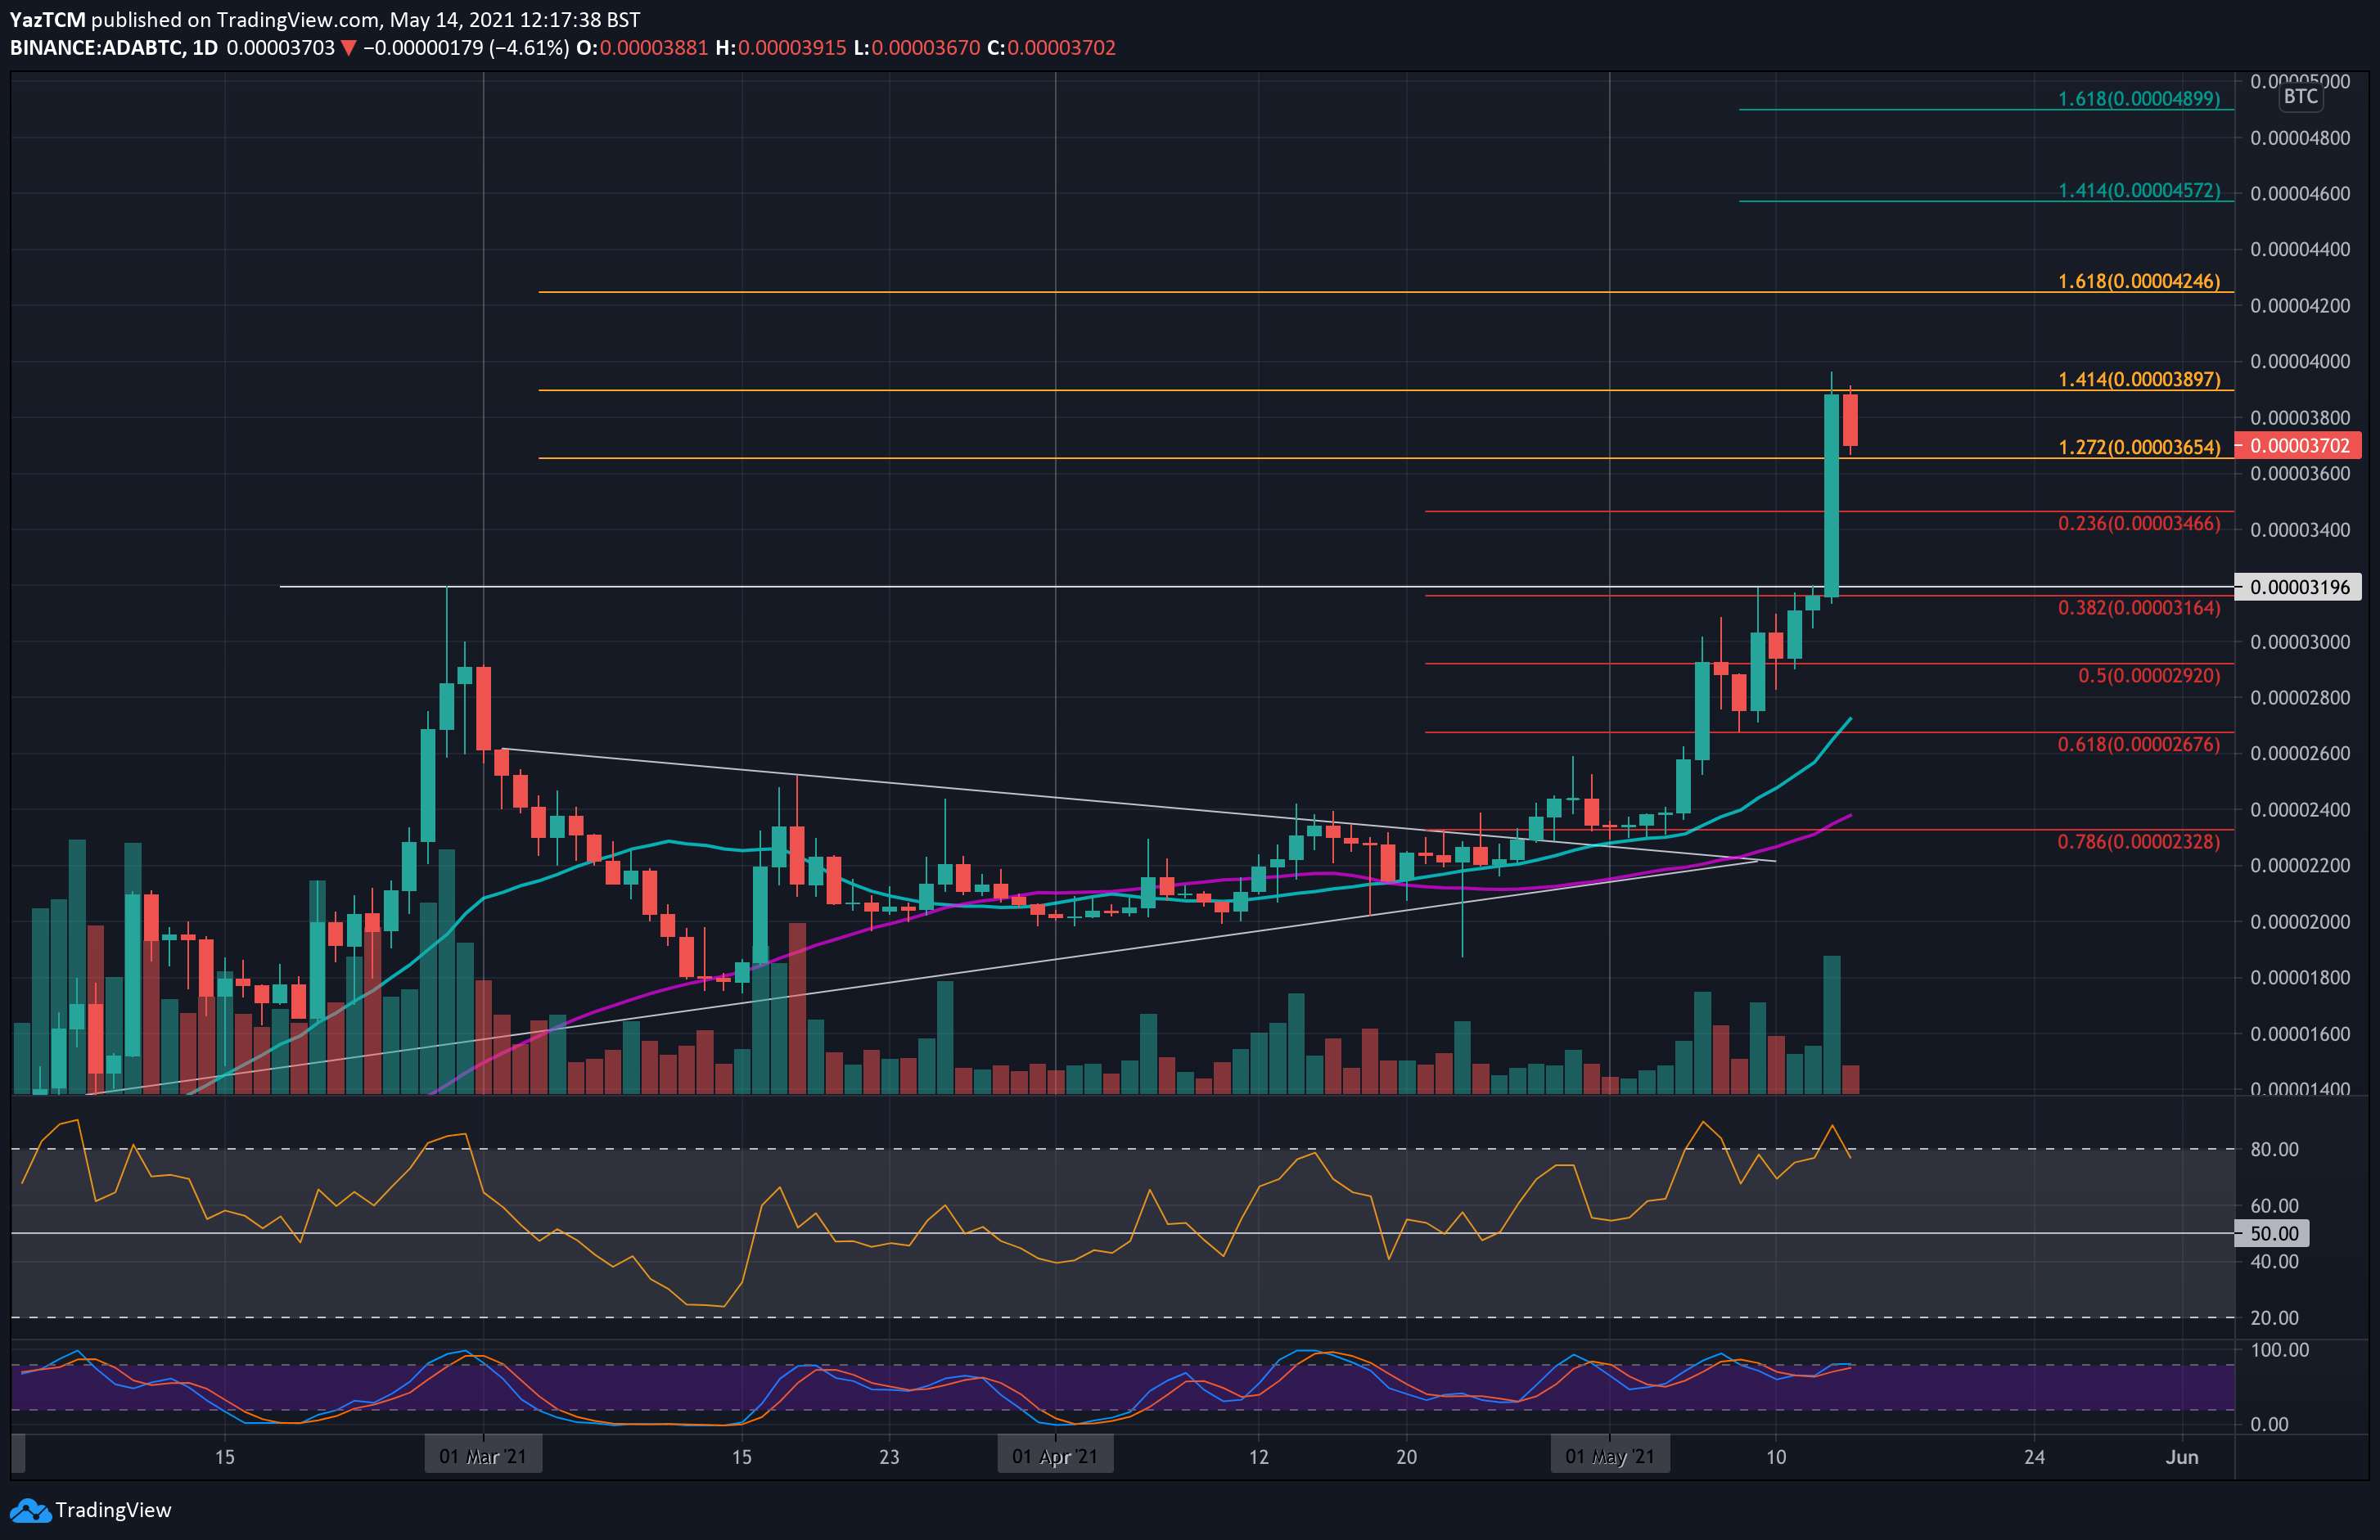
ADA also surged higher against bitcoin. It started the week beneath 2800 SAT as it started to push higher to meet the resistance at 3200 SAT (February highs).
Yesterday, ADA surged higher to break the February highs and reach 3900 SAT, where it met resistance at a 1.414 Fibonacci Extension level. It could not overcome this level and has since dropped to 3700 SAT.
Moving forward, the first resistance lies at 3900 SAT (1.414 Fib Extension). This is followed by 4000 SAT, 4246 SAT (1.618 Fib Extension), 4400 SAT, and 4572 SAT (1.414 Fib Extension -blue).
On the other side, the first support lies at 3600 SAT. This is followed by 3466 SAT (.236 Fib), 3200 SAT, 3165 SAT (.382 Fib), and 3000 SAT.
Uniswap
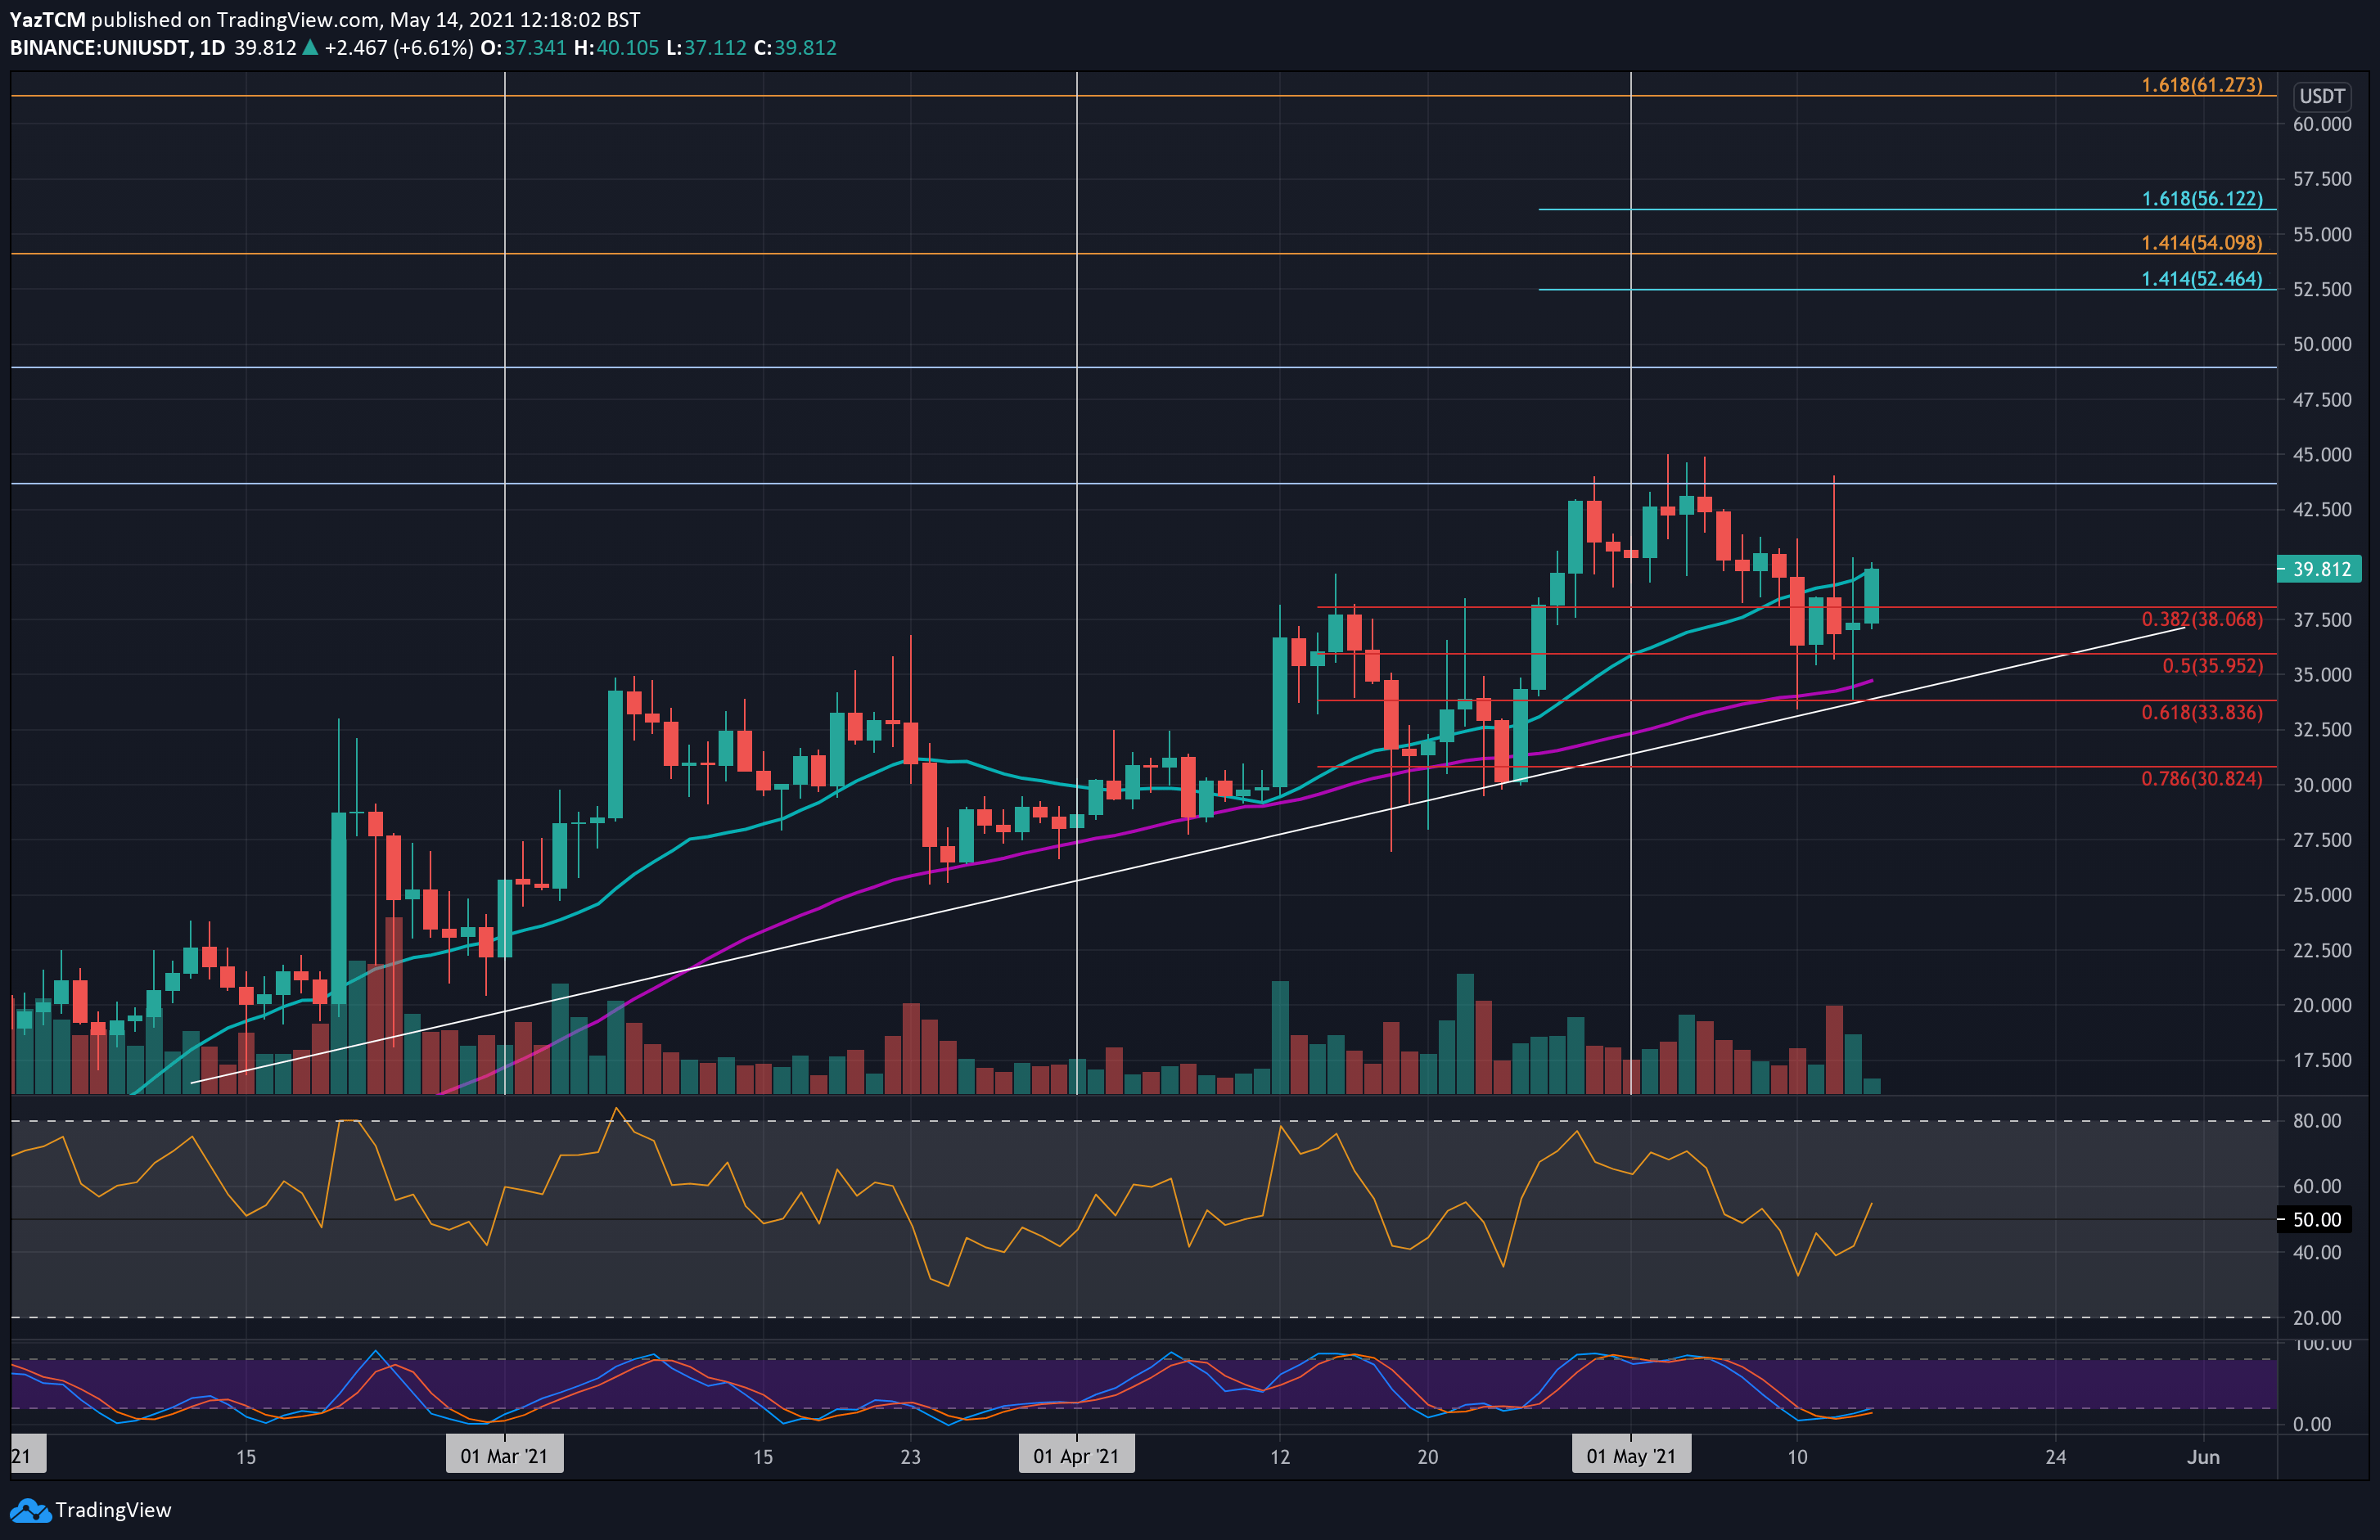
UNI remained stagnant this week as it continues to trade at $39.80 (20-days MA), the same level it was trading at last week. The coin started the month by setting a new ATH at $45 but started to head lower from there.
Yesterday, it did drop as low as 33.83 (.618 Fib) but quickly rebounded to hit the 20-day MA level again today.
Looking ahead, the first resistance above $40 lies at $42.50. This is followed by $45 (ATH), $47.50, $50, and $52.45.
On the other side, the first support lies at $38 (.382 Fib). This is followed by $35.95 (.5 Fib), $33.83 (.618 Fib), and $30.92.
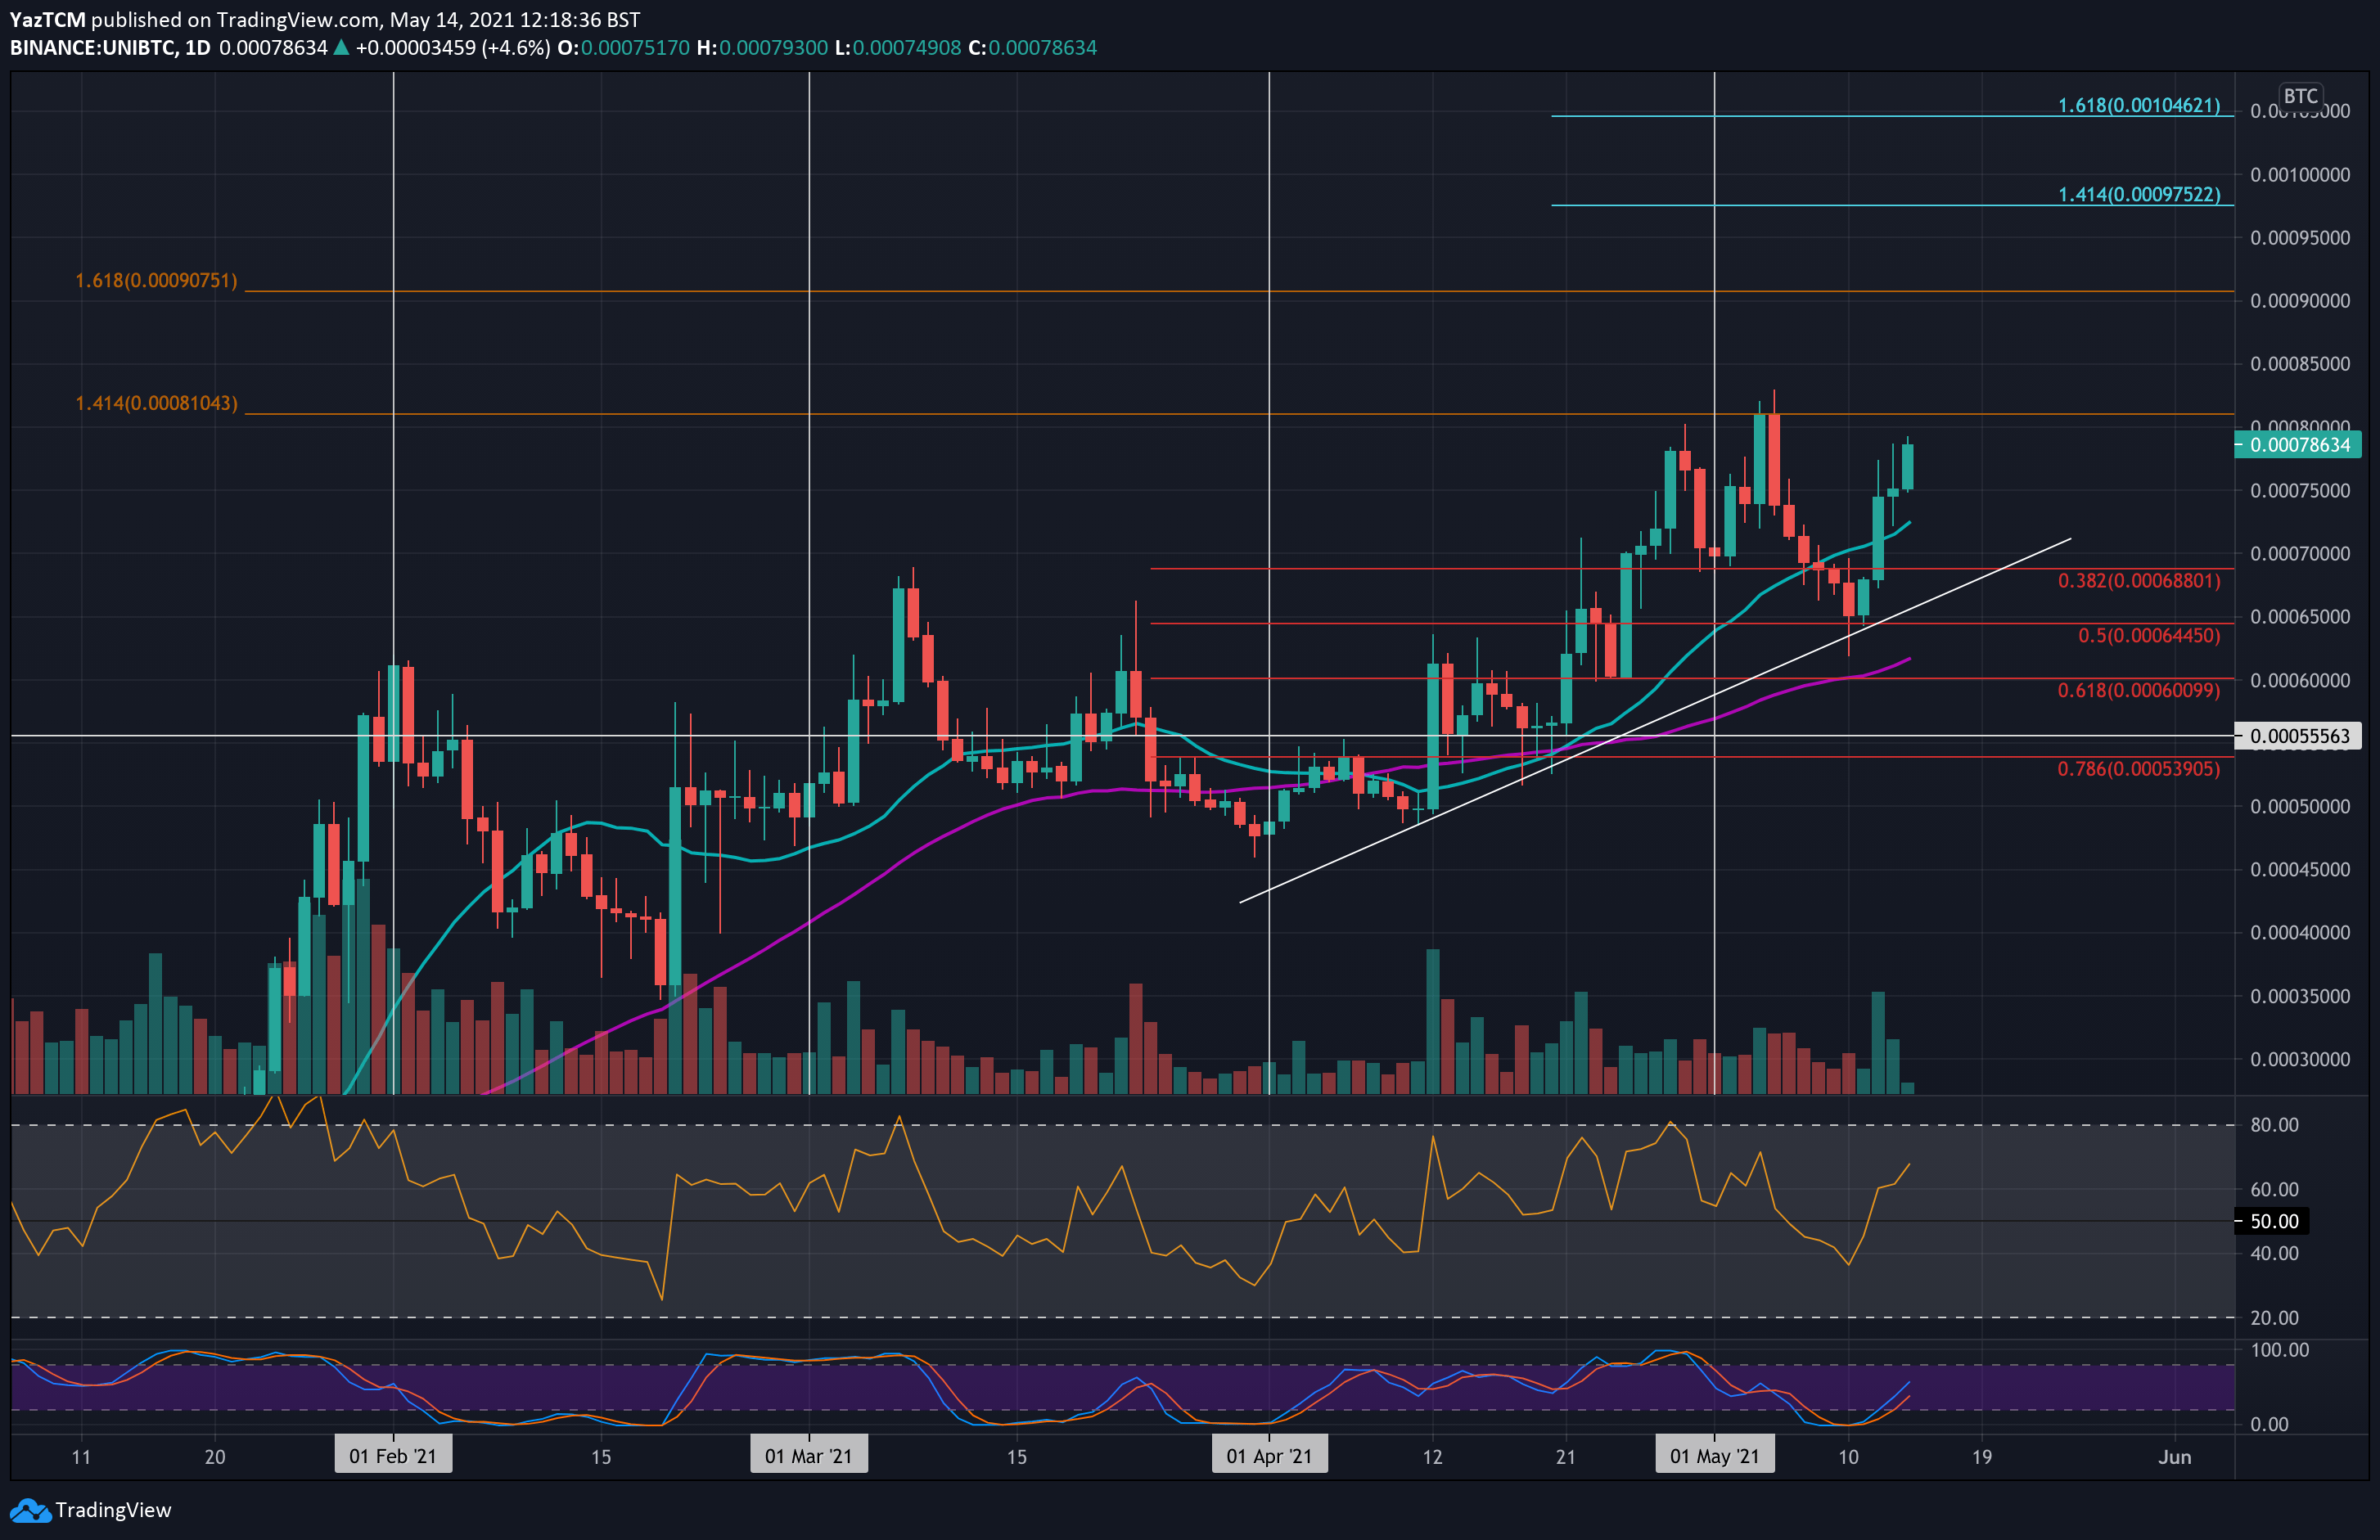
UNI saw a strong rebound this week against bitcoin. It had dropped beneath 0.0007 BTC at the start of the week and continued to fall until support was found at 0.000644 (.5 Fib). It rebounded from this support on Tuesday and started to push higher.
Since rebounding, UNI managed to break the 20-day MA above 0.0007 BTC and push as high as 0.000786 BTC today.
Looking ahead, the first resistance lies at 0.00081 BTC (1.414 Fib Extension). This is followed by 0.00085 BTC, 0.000907 BTC (1.618 Fib Extension), 0.00095 BTC, 0.000975 BTC (1.414 Fib Extension), and 0.001 BTC.
On the other side, the first support lies at 0.00075 BTC. This is followed by 0.00072 BTC (20-day MA), 0.0007 BTC, 0.000688 BTC (.382 Fib), and 0.000655 BTC (.5 Fib).