Bitcoin Bitcoin saw a strong 13.9% price hike this week as the cryptocurrency continues the bullish run that started in late July when it penetrated above the descending wedge consolidation pattern. Last Friday, BTC was trading beneath ,000 but eventually surged higher above the resistance by the end of the day. By the weekend, BTC managed to hit the 200-day MA level at around ,750. It continued to surge higher on Monday to hit ,500. However, BTC stalled there and started to head lower over the past few days until support was found at ,000. It has since rebounded from there and is now back above ,300. Looking ahead, the first level of resistance lies at ,500. This is followed by ,800 (bearish .618 Fib Retracement), ,400 (1.272 Fib Extension), and
Topics:
Yaz Sheikh considers the following as important: ADABTC, Binance Coin (BNB) Price, Bitcoin (BTC) Price, BNBBTC, bnbusd, BTCEUR, BTCGBP, btcusd, btcusdt, Cardano (ADA) Price, ETH Analysis, ETHBTC, Ethereum (ETH) Price, ethusd, Price Analysis, Ripple (XRP) Price, XRP Analysis, xrpbtc, xrpusd
This could be interesting, too:
Chayanika Deka writes XRP, SOL, and ADA Inclusion in US Crypto Reserve Pushes Traders on Edge
Chayanika Deka writes Why Arthur Hayes Is Bullish on Bitcoin Under Trump’s Economic Strategy
Mandy Williams writes Why the Bitcoin Market Is Stuck—and the Key Metric That Could Change It: CryptoQuant CEO
Wayne Jones writes Metaplanet Acquires 156 BTC, Bringing Total Holdings to 2,391
Bitcoin
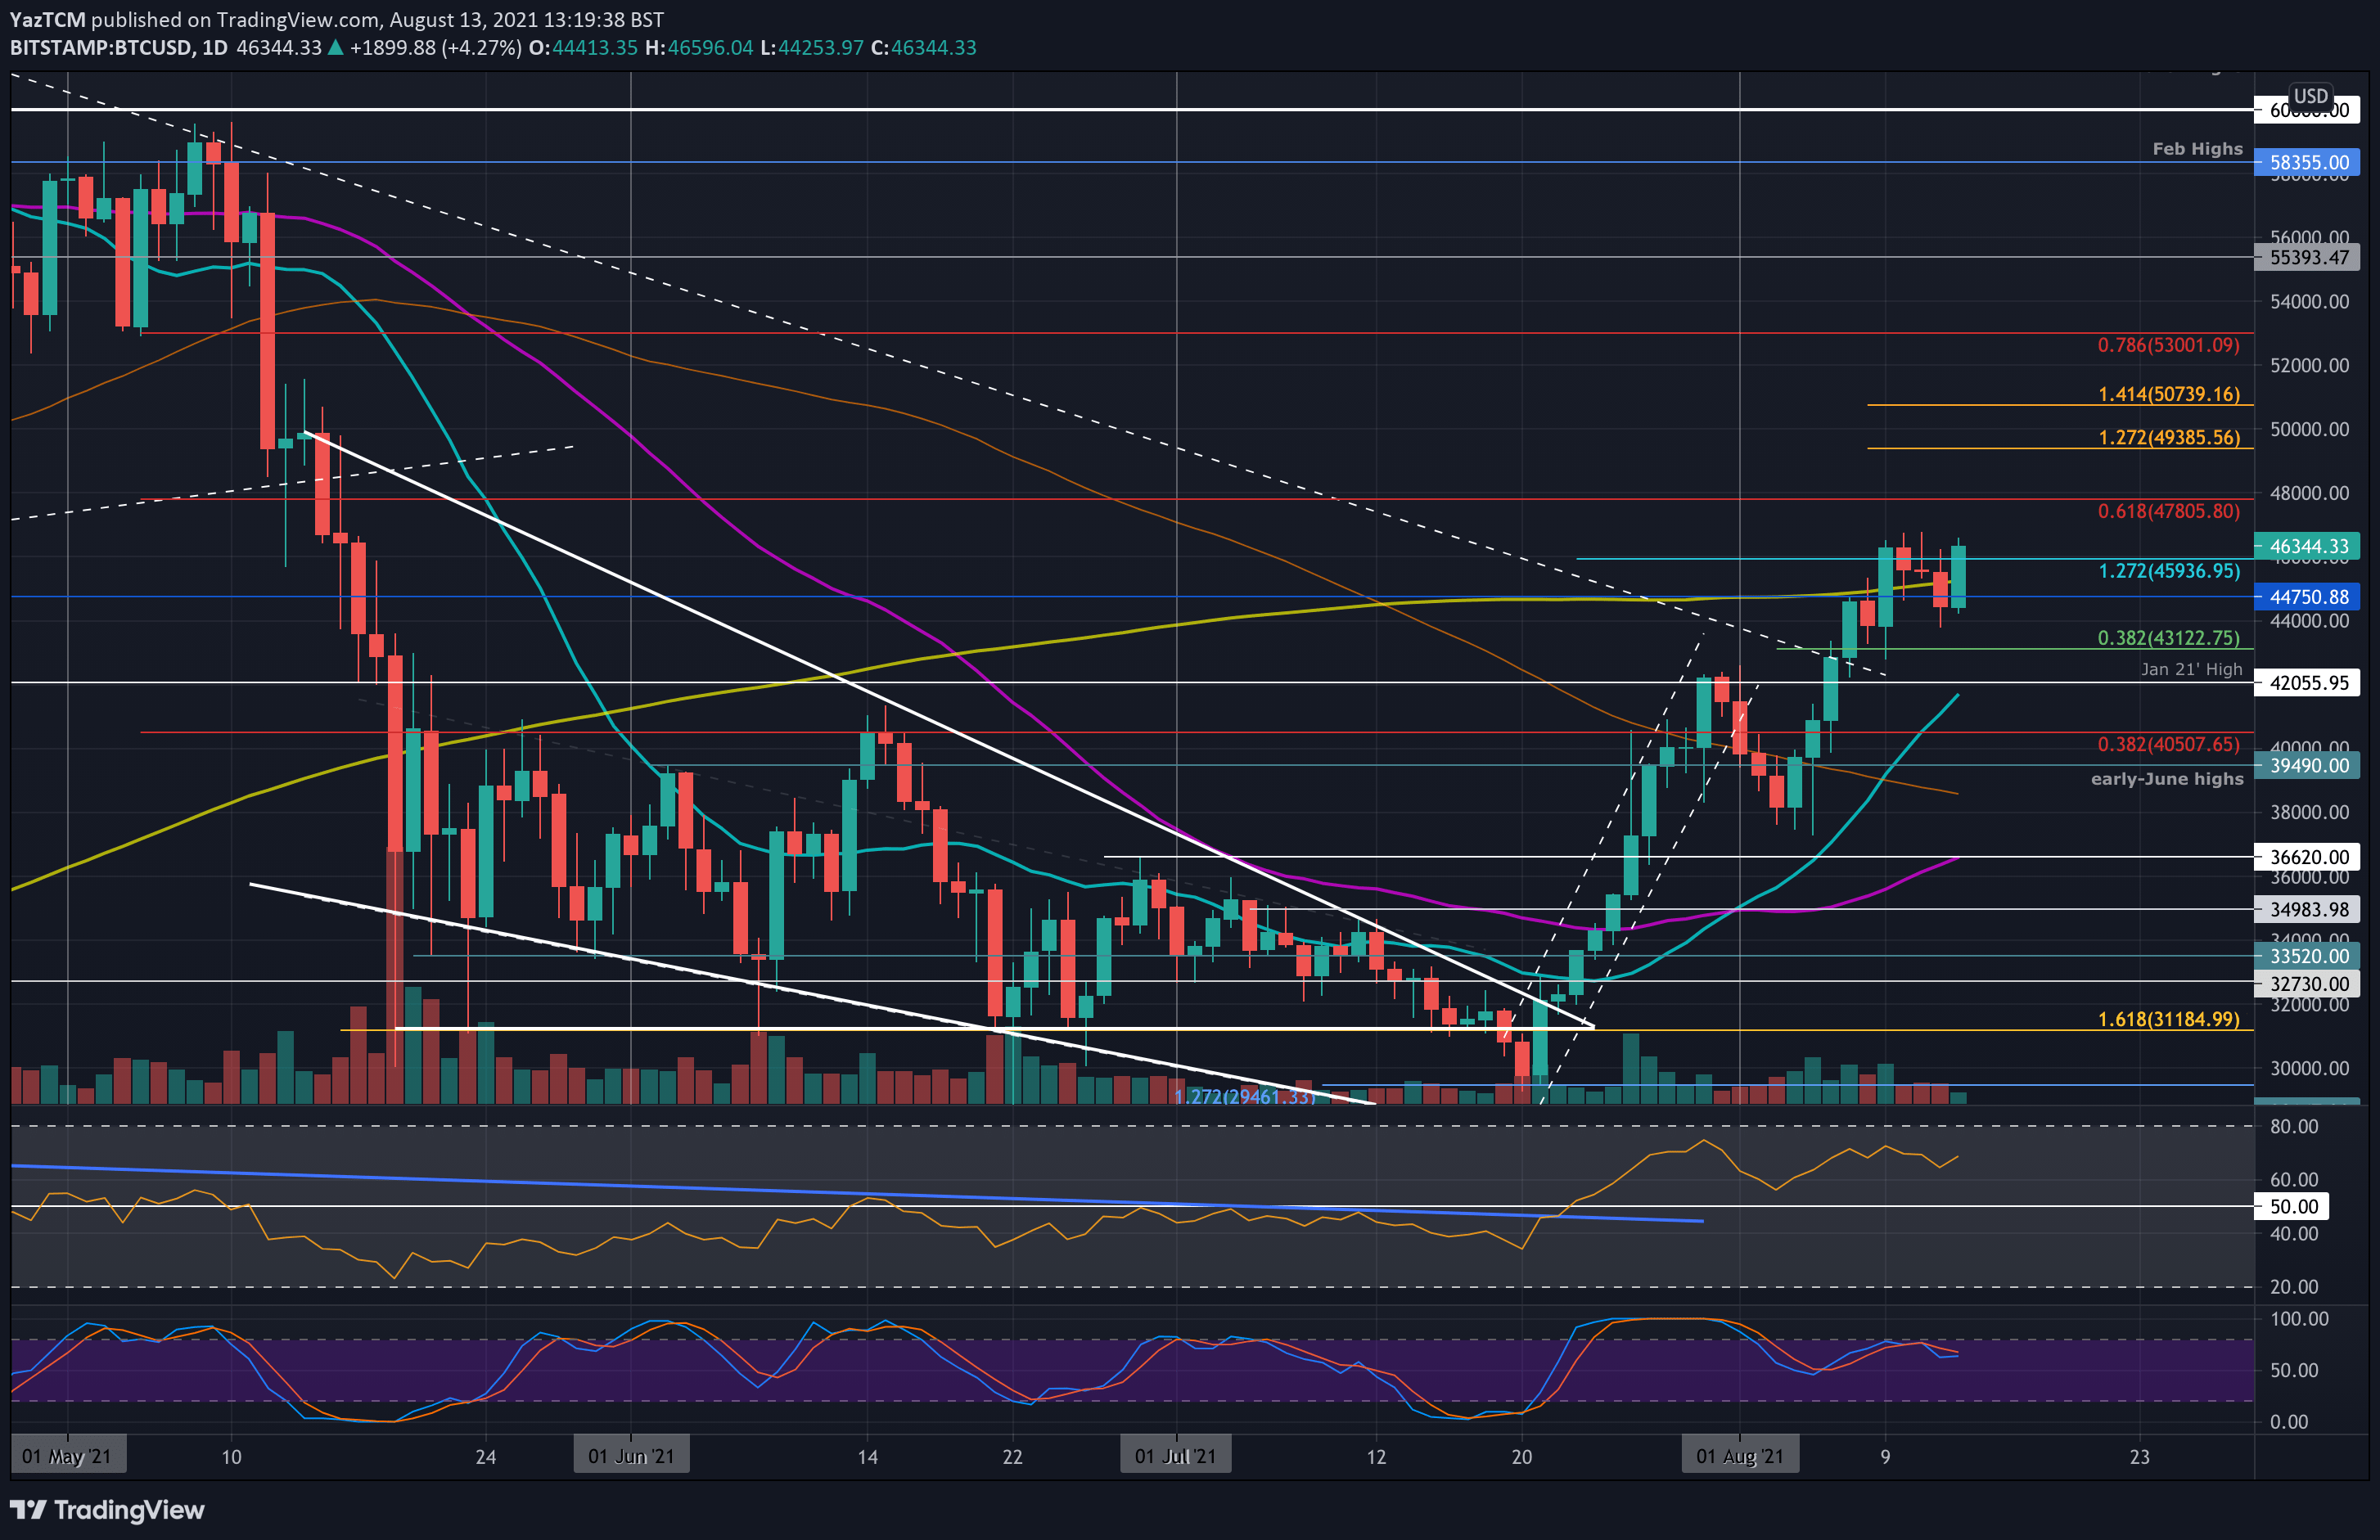
Bitcoin saw a strong 13.9% price hike this week as the cryptocurrency continues the bullish run that started in late July when it penetrated above the descending wedge consolidation pattern.
Last Friday, BTC was trading beneath $42,000 but eventually surged higher above the resistance by the end of the day. By the weekend, BTC managed to hit the 200-day MA level at around $44,750.
It continued to surge higher on Monday to hit $46,500. However, BTC stalled there and started to head lower over the past few days until support was found at $44,000. It has since rebounded from there and is now back above $46,300.
Looking ahead, the first level of resistance lies at $46,500. This is followed by $47,800 (bearish .618 Fib Retracement), $39,400 (1.272 Fib Extension), and $50,000. Beyond $50K, added resistance lies at $50,740 (1.414 Fib Extension), $52,000, and $53,000 (bearish .786 Fib Retracement).
On the other side, the first support lies around $45,000 (200-day MA). This is followed by $44,000, $43,100 (.382 Fib), $42,000 (Jan 2021 high & 20-day MA), and $40,500.
Ethereum
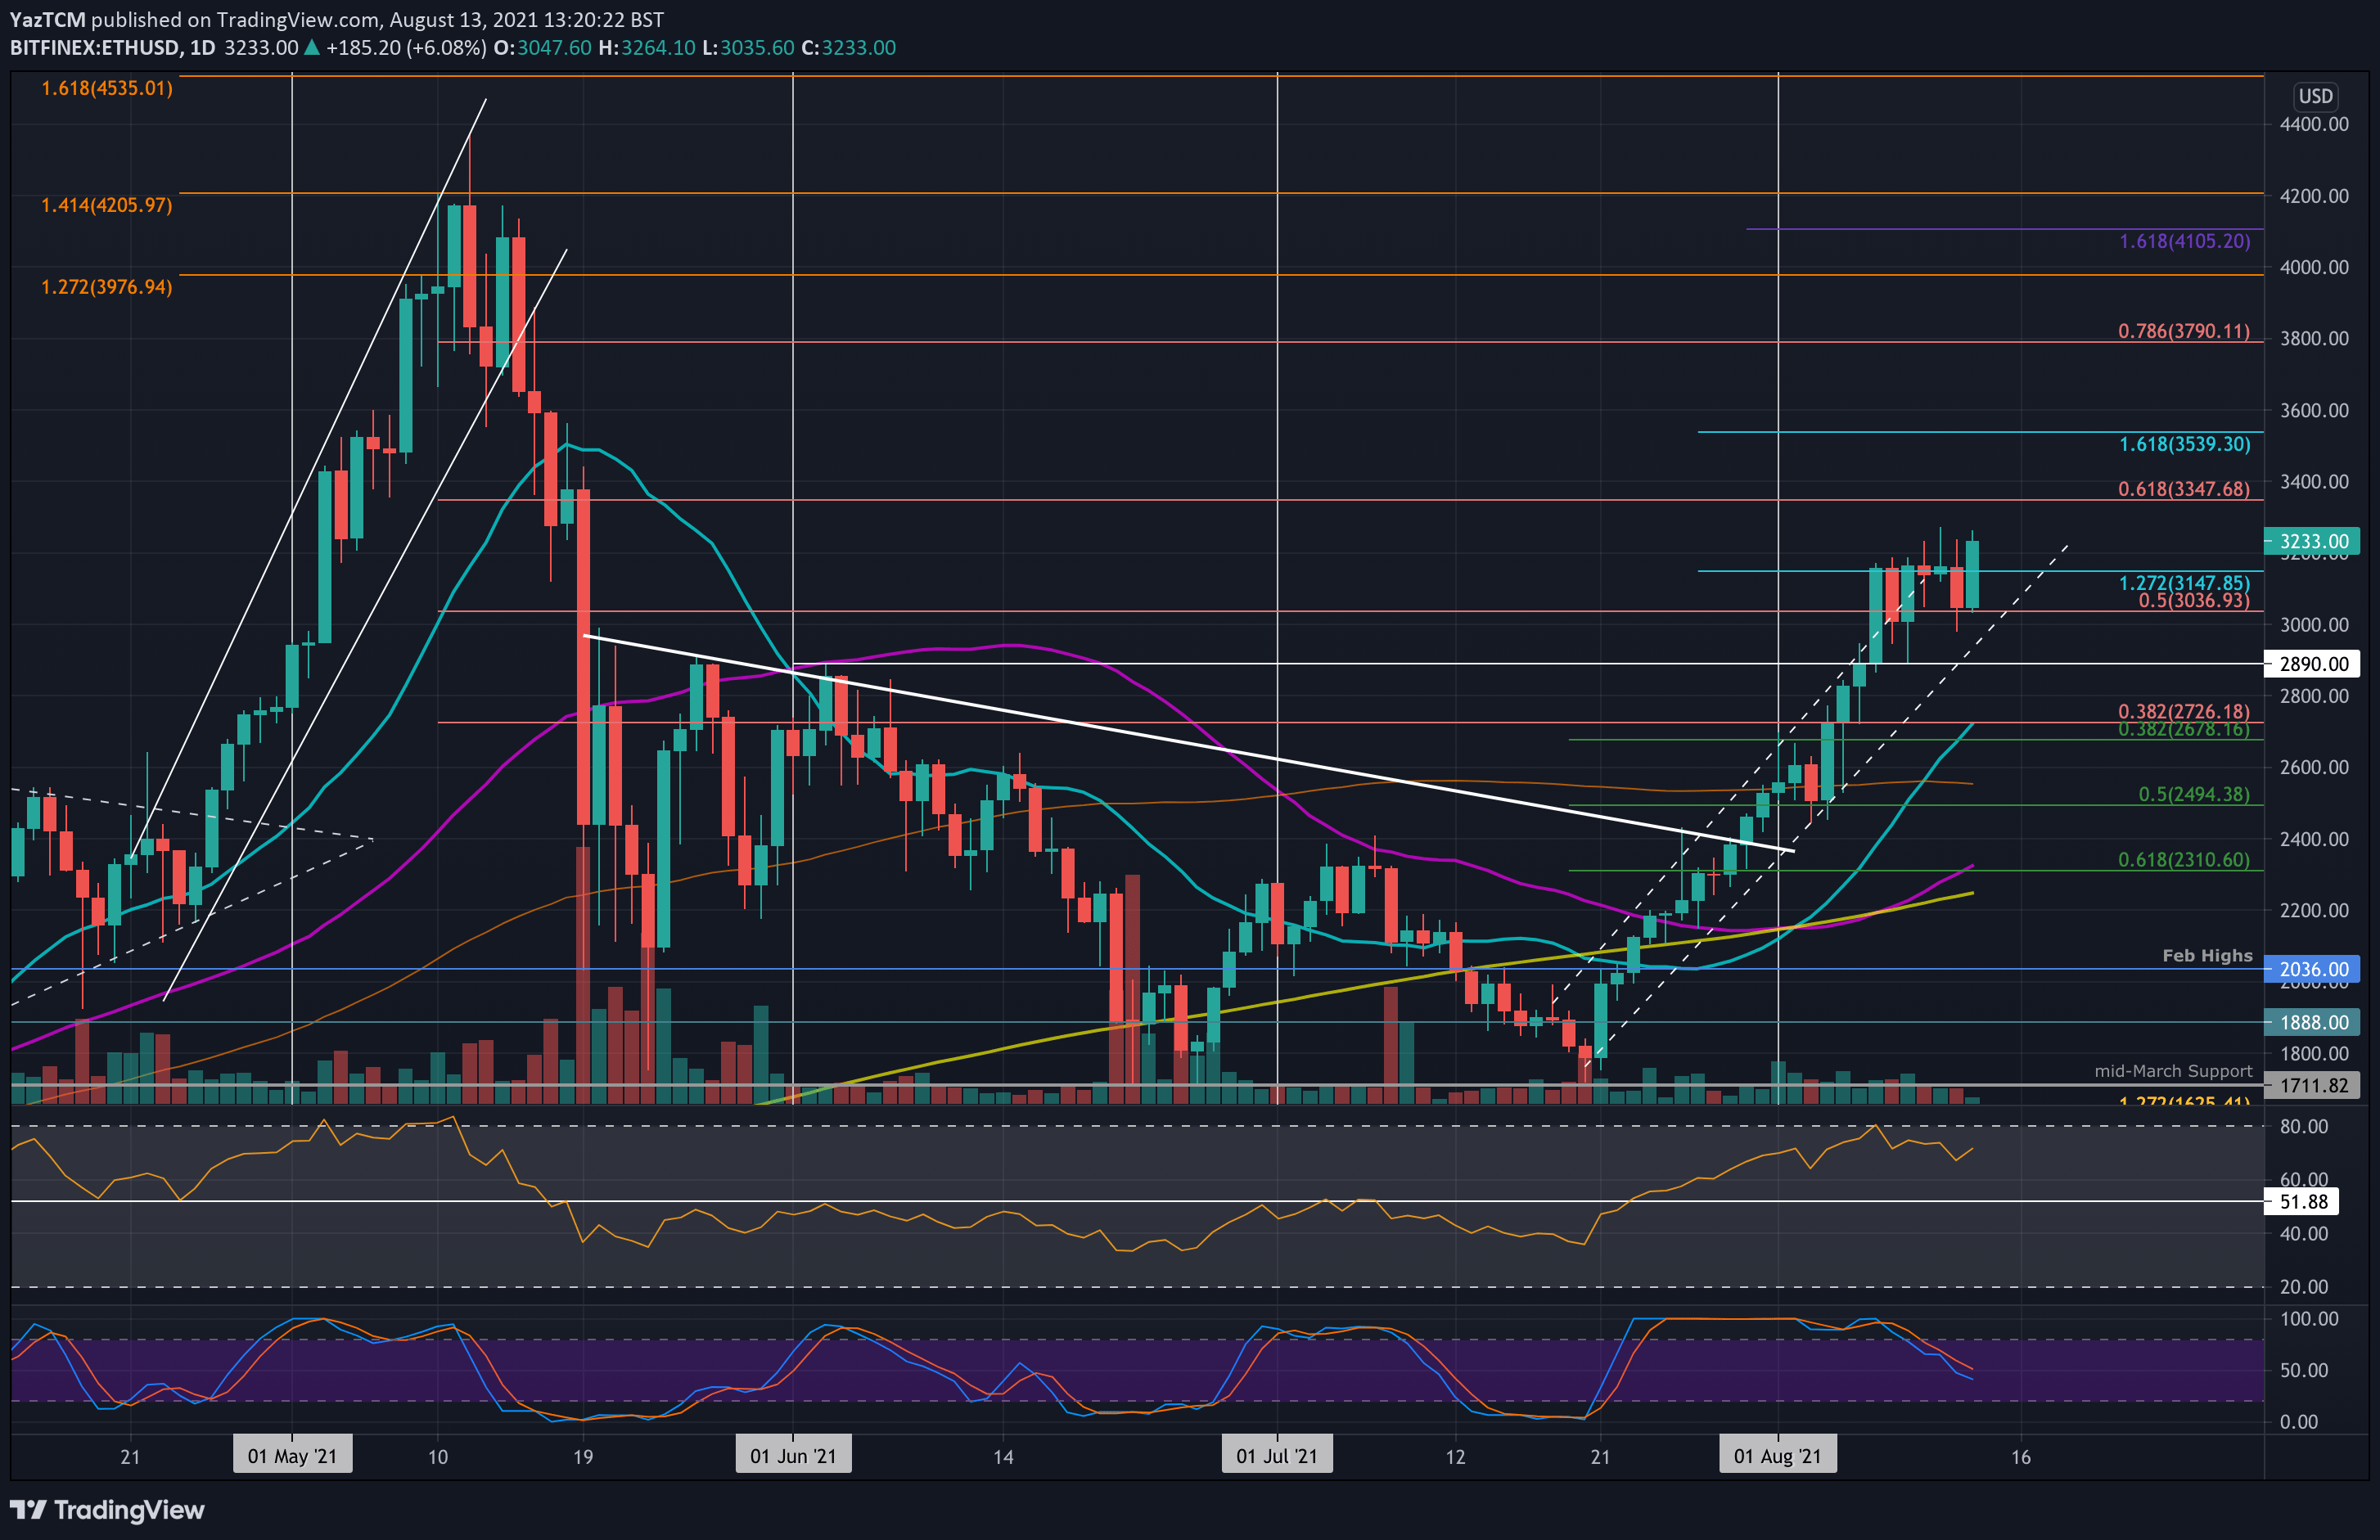
Ethereum also performed well this week as it surged by a strong 14.7% to hit the current $3230 level. The cryptocurrency surged above an ascending price channel last Friday to hit resistance at around $3170.
Throughout the week, ETH did spike higher above $3170 but was never able to close a daily candle above the resistance. Yesterday, it dropped lower into the support at $3000, closing the daily candle at $3036 (previous resistance). It has since rebounded from there today and is trading above $3200. A daily closing candle above $3200 today would signal that ETH is gearing up for another bullish swing into the following week.
Looking ahead, the first resistance lies at $3350 (bearish .618 Fib). This is followed by $3540 (1.618 Fib Extension), $3600, $3790 (bearish .786 Fib), and $4000.
On the other side, the first support lies around $3150. This is followed by $3036, $3000, $2890, and $2725 (20-day MA & previous resistance).
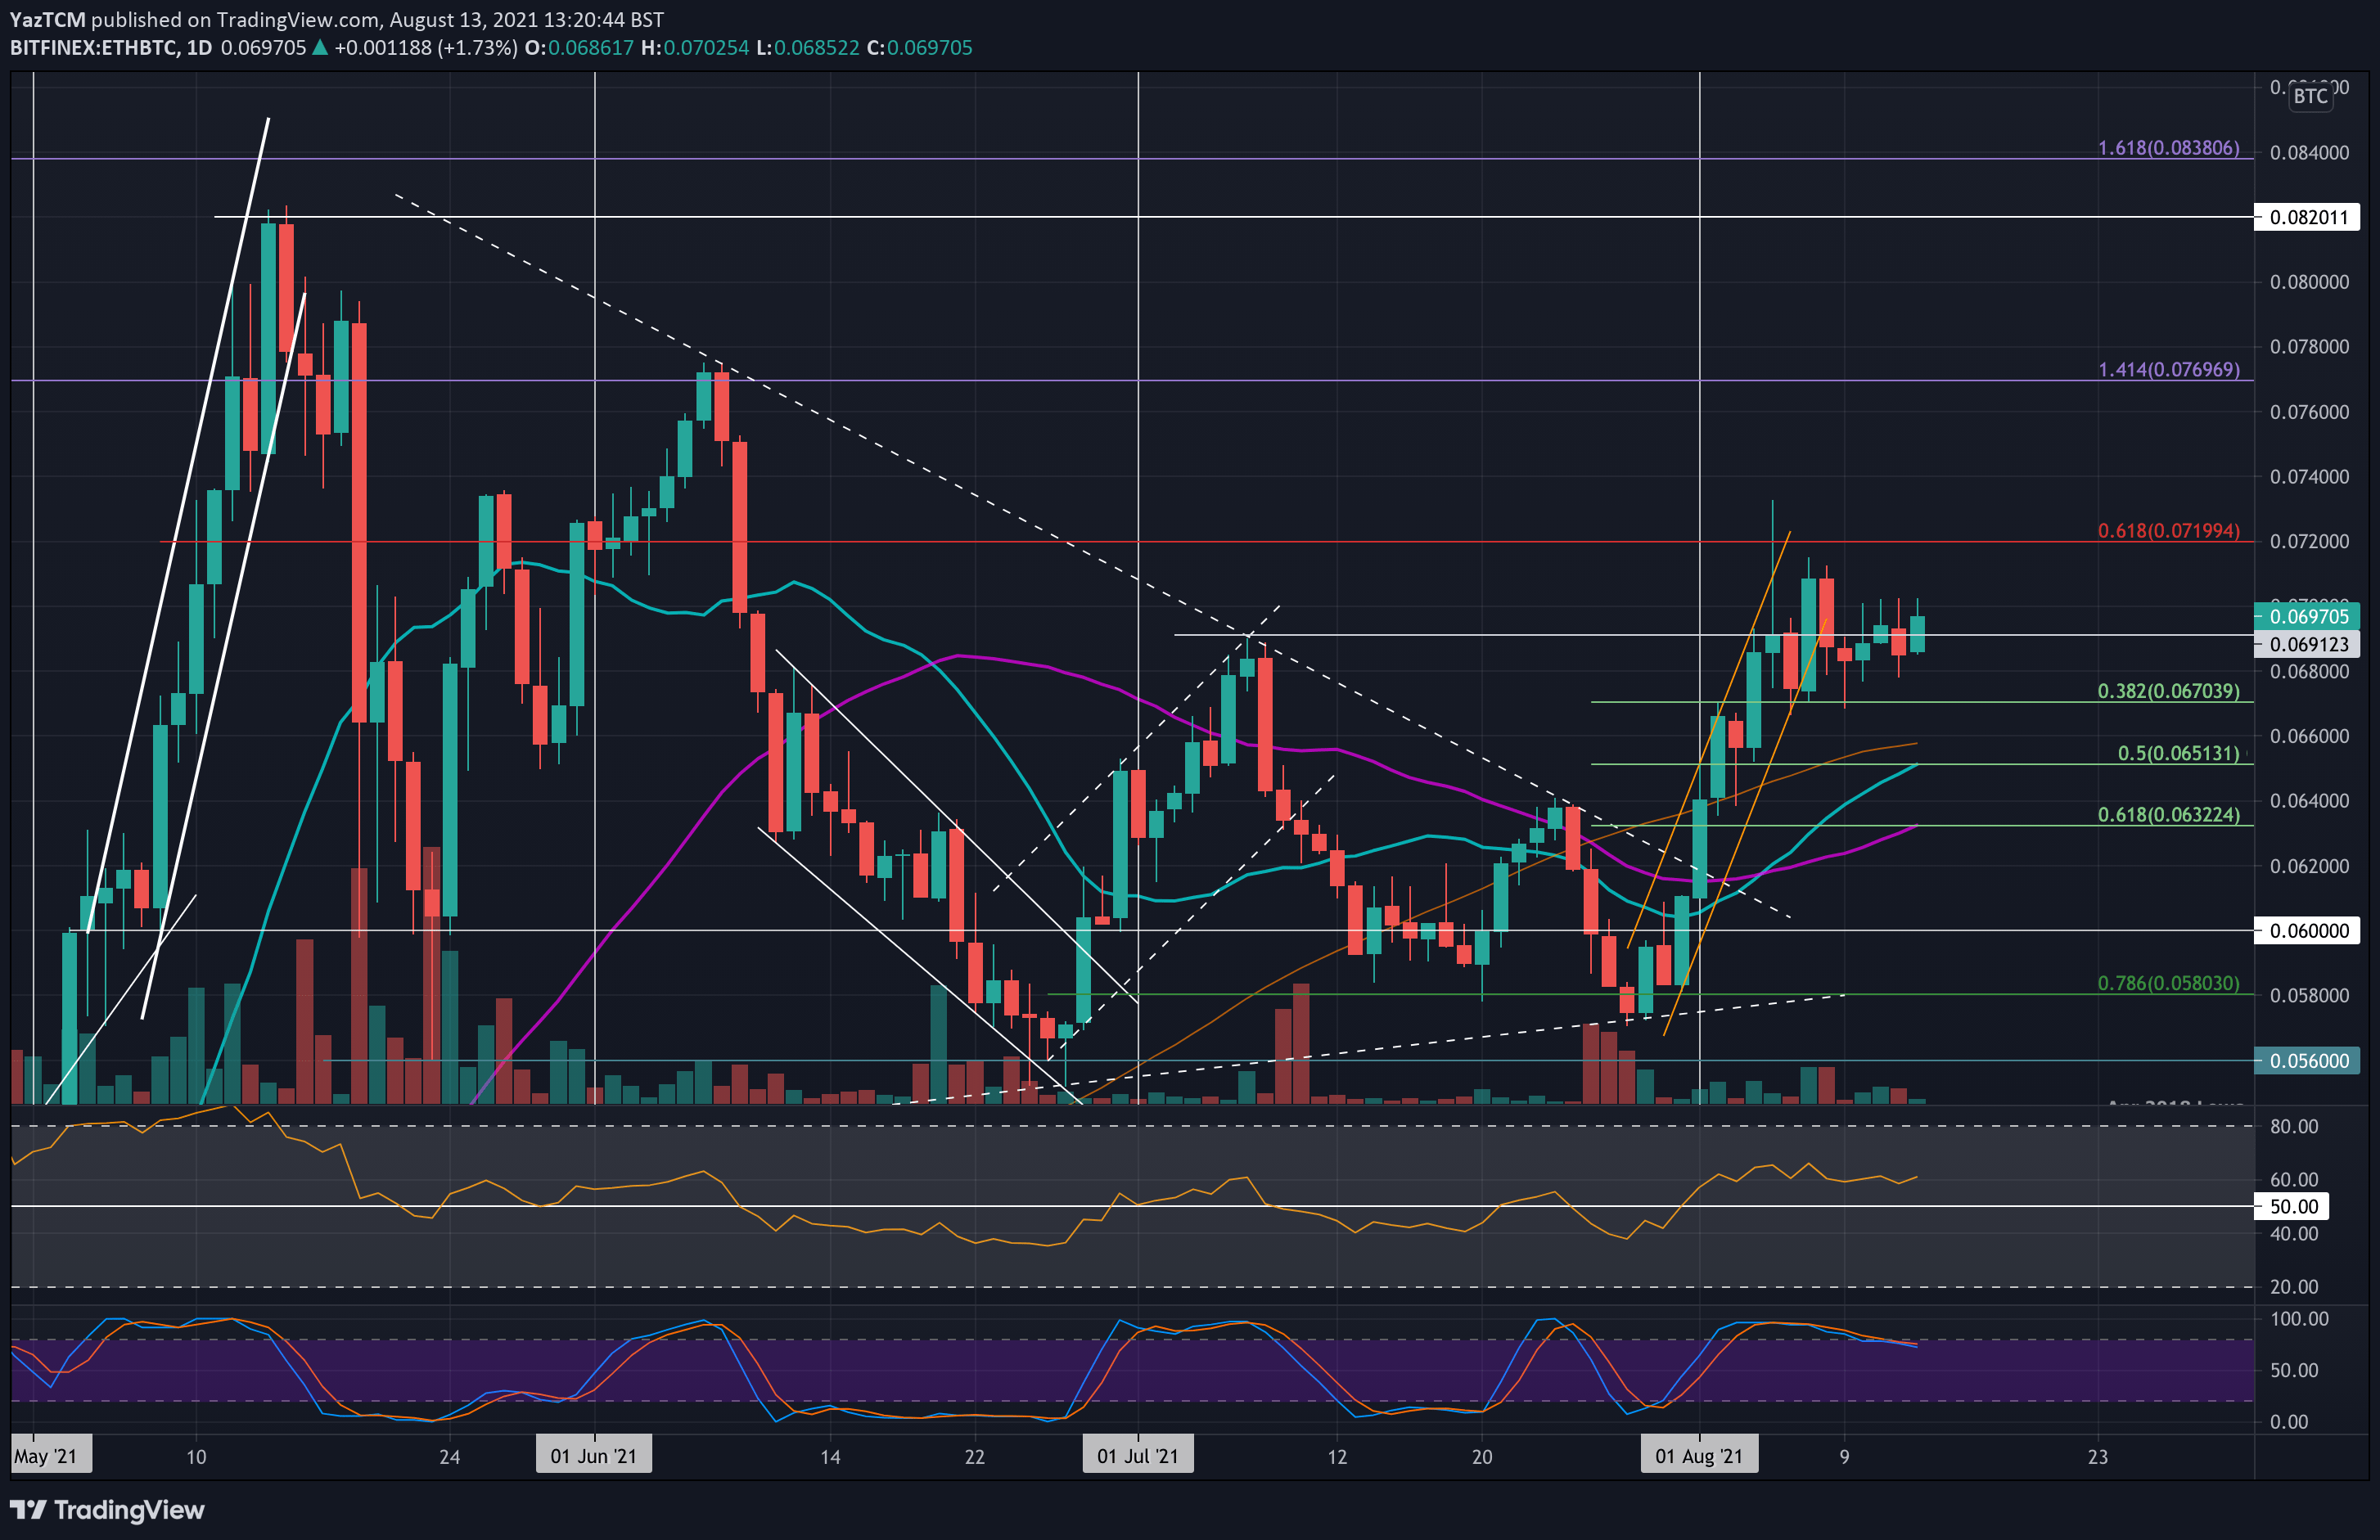
ETH saw relatively lackluster price movements against BTC this week. It had surged higher over the past fortnight and climbed above 0.07 BTC over the weekend. However, ETH quickly dropped back beneath 0.07 BTC and has not been able to climb back above it so far.
On Monday, ETH did find support at 0.067 BTC (.382 Fib) and has made numerous attempts to break 0.07 BTC but has failed on each occasion as it sits just below today.
Looking ahead, if the buyers break 0.07 BTC, the first strong resistance lies at 0.072 BTC (beraish .618 Fib). This is followed by 0.074 BTC, 0.077 BTC (1.414 Fib Extension), and 0.08 BTC.
On the other side, the first support lies at 0.068 BTC. This is followed by 0.067 BTC (.382 Fib), 0.066 BTC (100-day MA), 0.0651 BTC ).5 Fib & 20-day MA), and 0.0632 BTC (50-day MA & .618 Fib).
Ripple
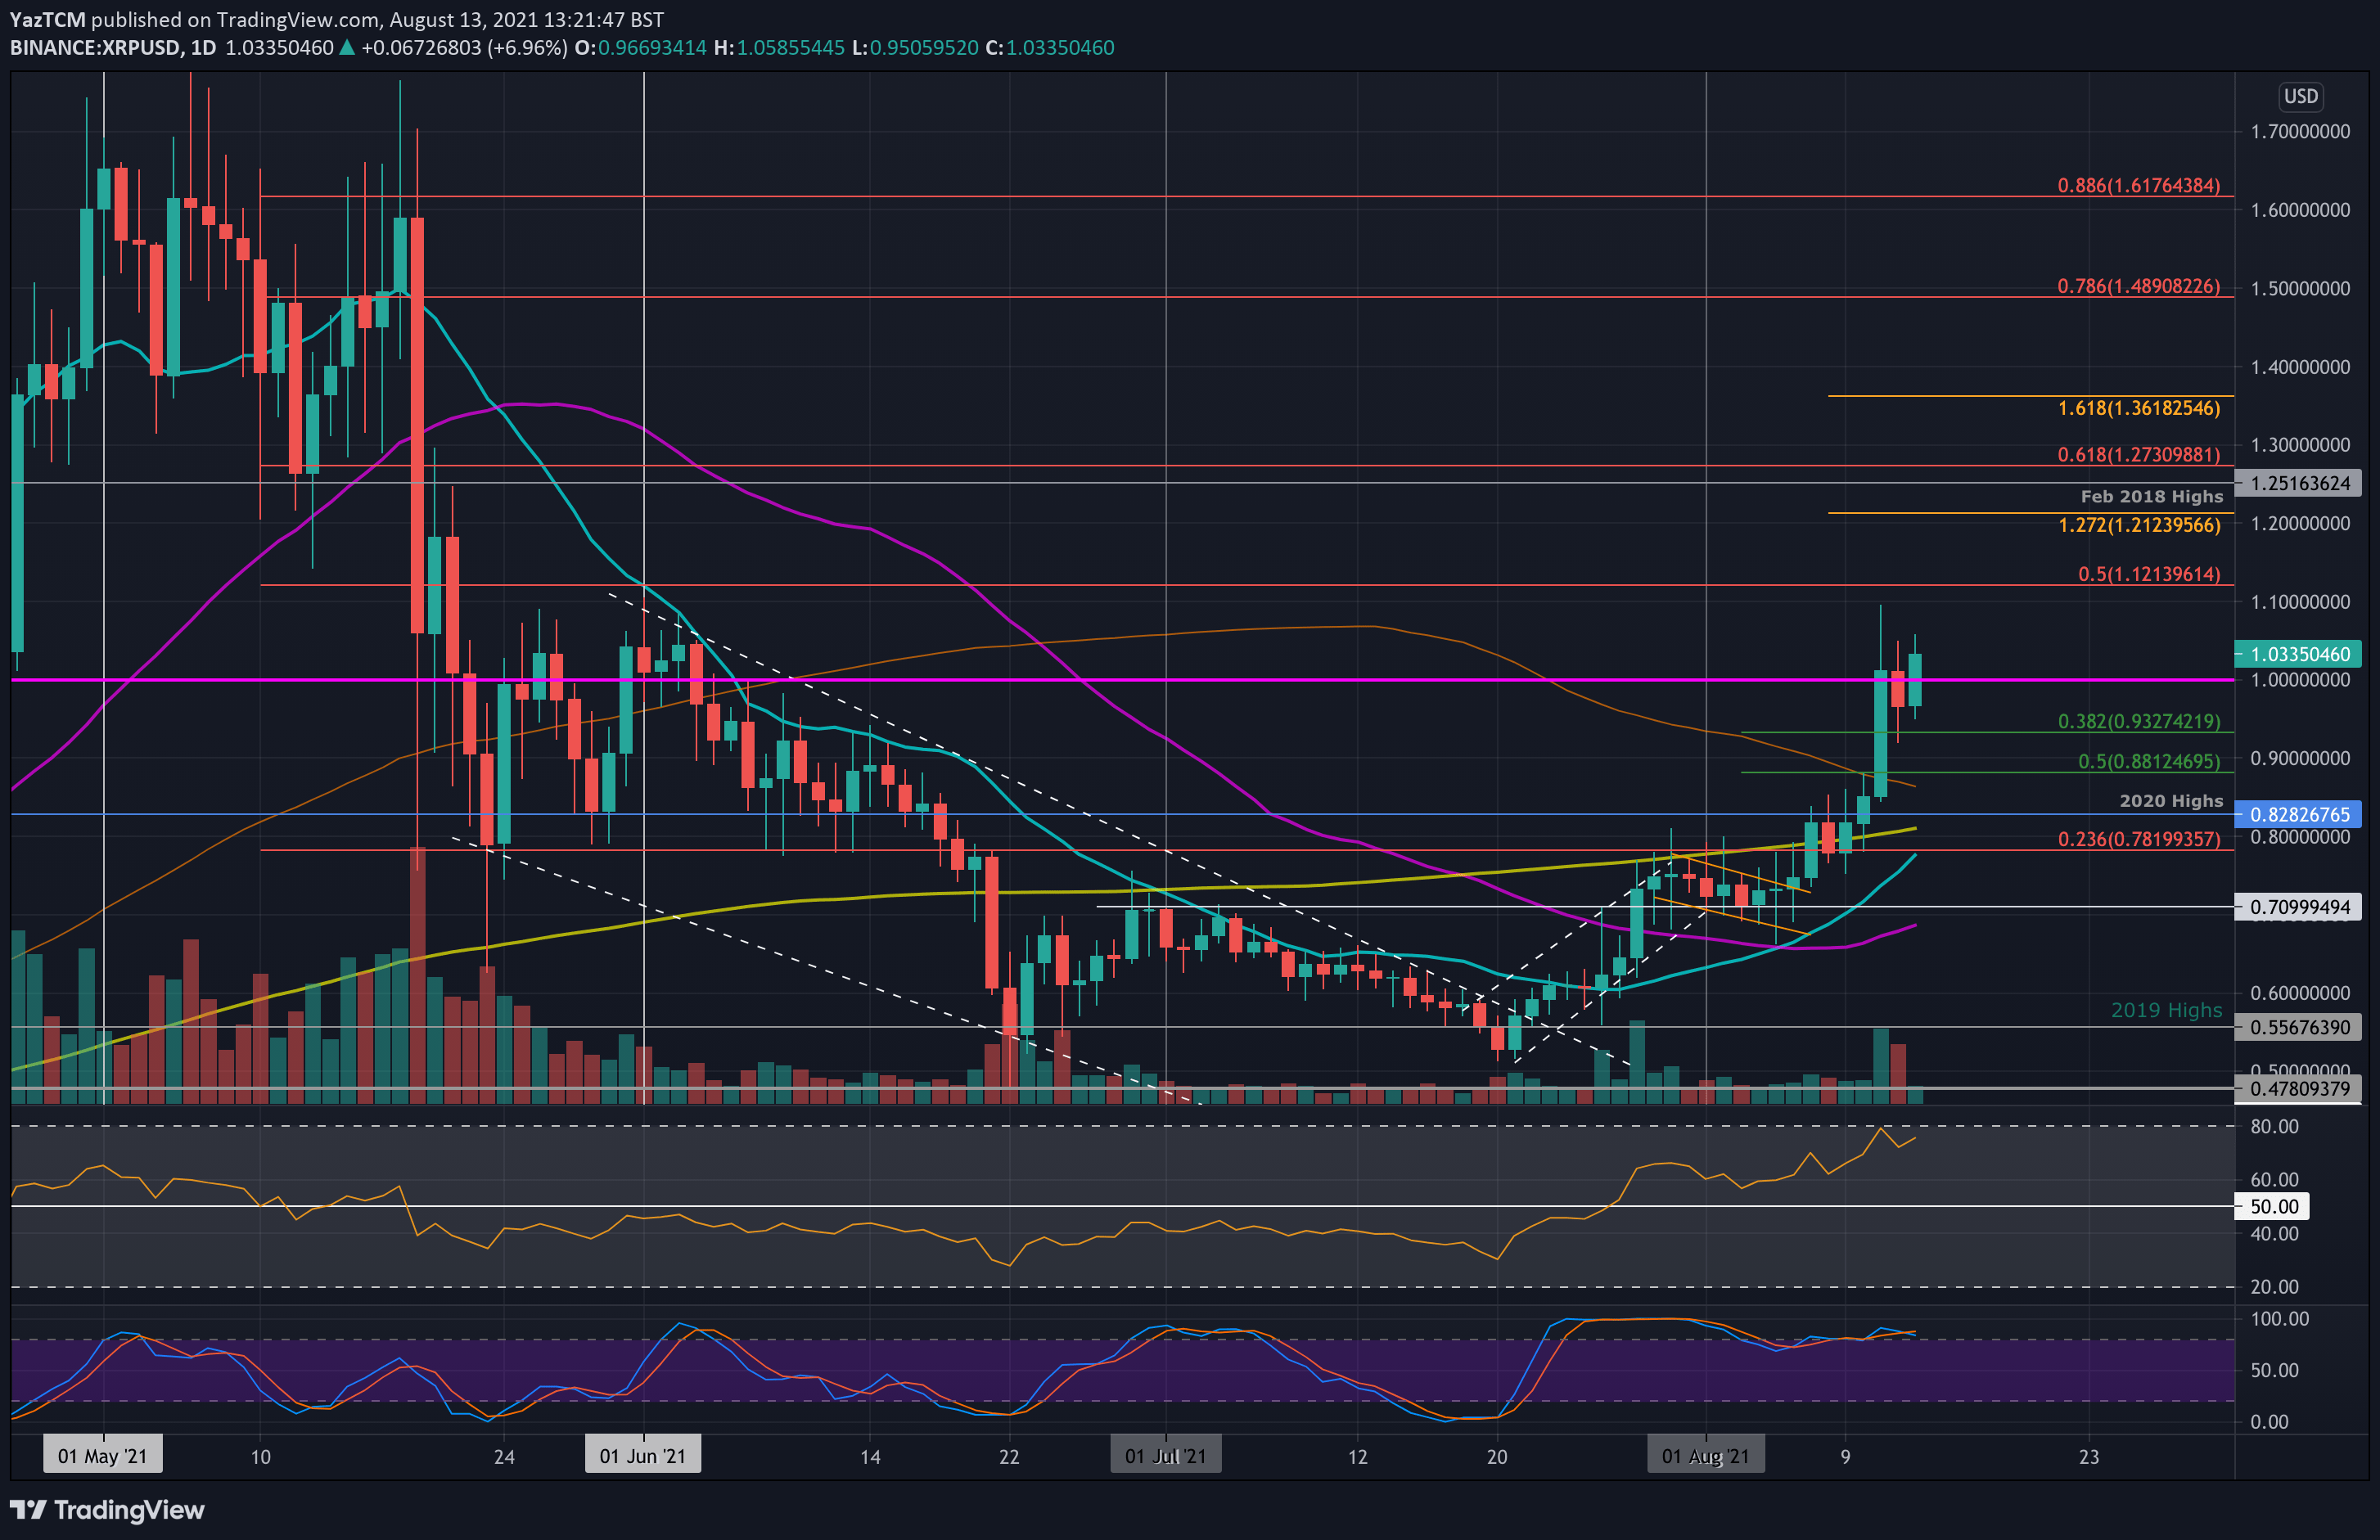
XRP saw an incredible 41% price hike over the past week as the coin finally breaks back above $1. It was trading around $0.71 last Friday as it started to surge higher above the 200-day MA into the 2020 high at $0.8282.
The 2020 high was finally penetrated on Tuesday as XRP hit the 100-day MA. On Wednesday, XRP exploded higher as it broke $1 and reached as high as $1.10. It dropped lower yesterday but found support at $0.93. Today, XRP climbed back above $1 as it trades at $1.03.
Looking ahead, the first resistance lies between $1.10-$1.12 (bearish .5 Fib). This is followed by $1.21 (1.272 Fib Extension), $1.25 (Fen 2018 highs), and $1.27 (bearish .618 Fib). Added resistance lies at $1.36 (1.618 Fib Extension) and $1.50 (bearish .786 Fib).
On the other side, the first support lies at $1. This is followed by $0.932 (.382 Fib), $0.88 (.5 Fib), $0.8282 (2020 high), and $0.78 (20-day MA).
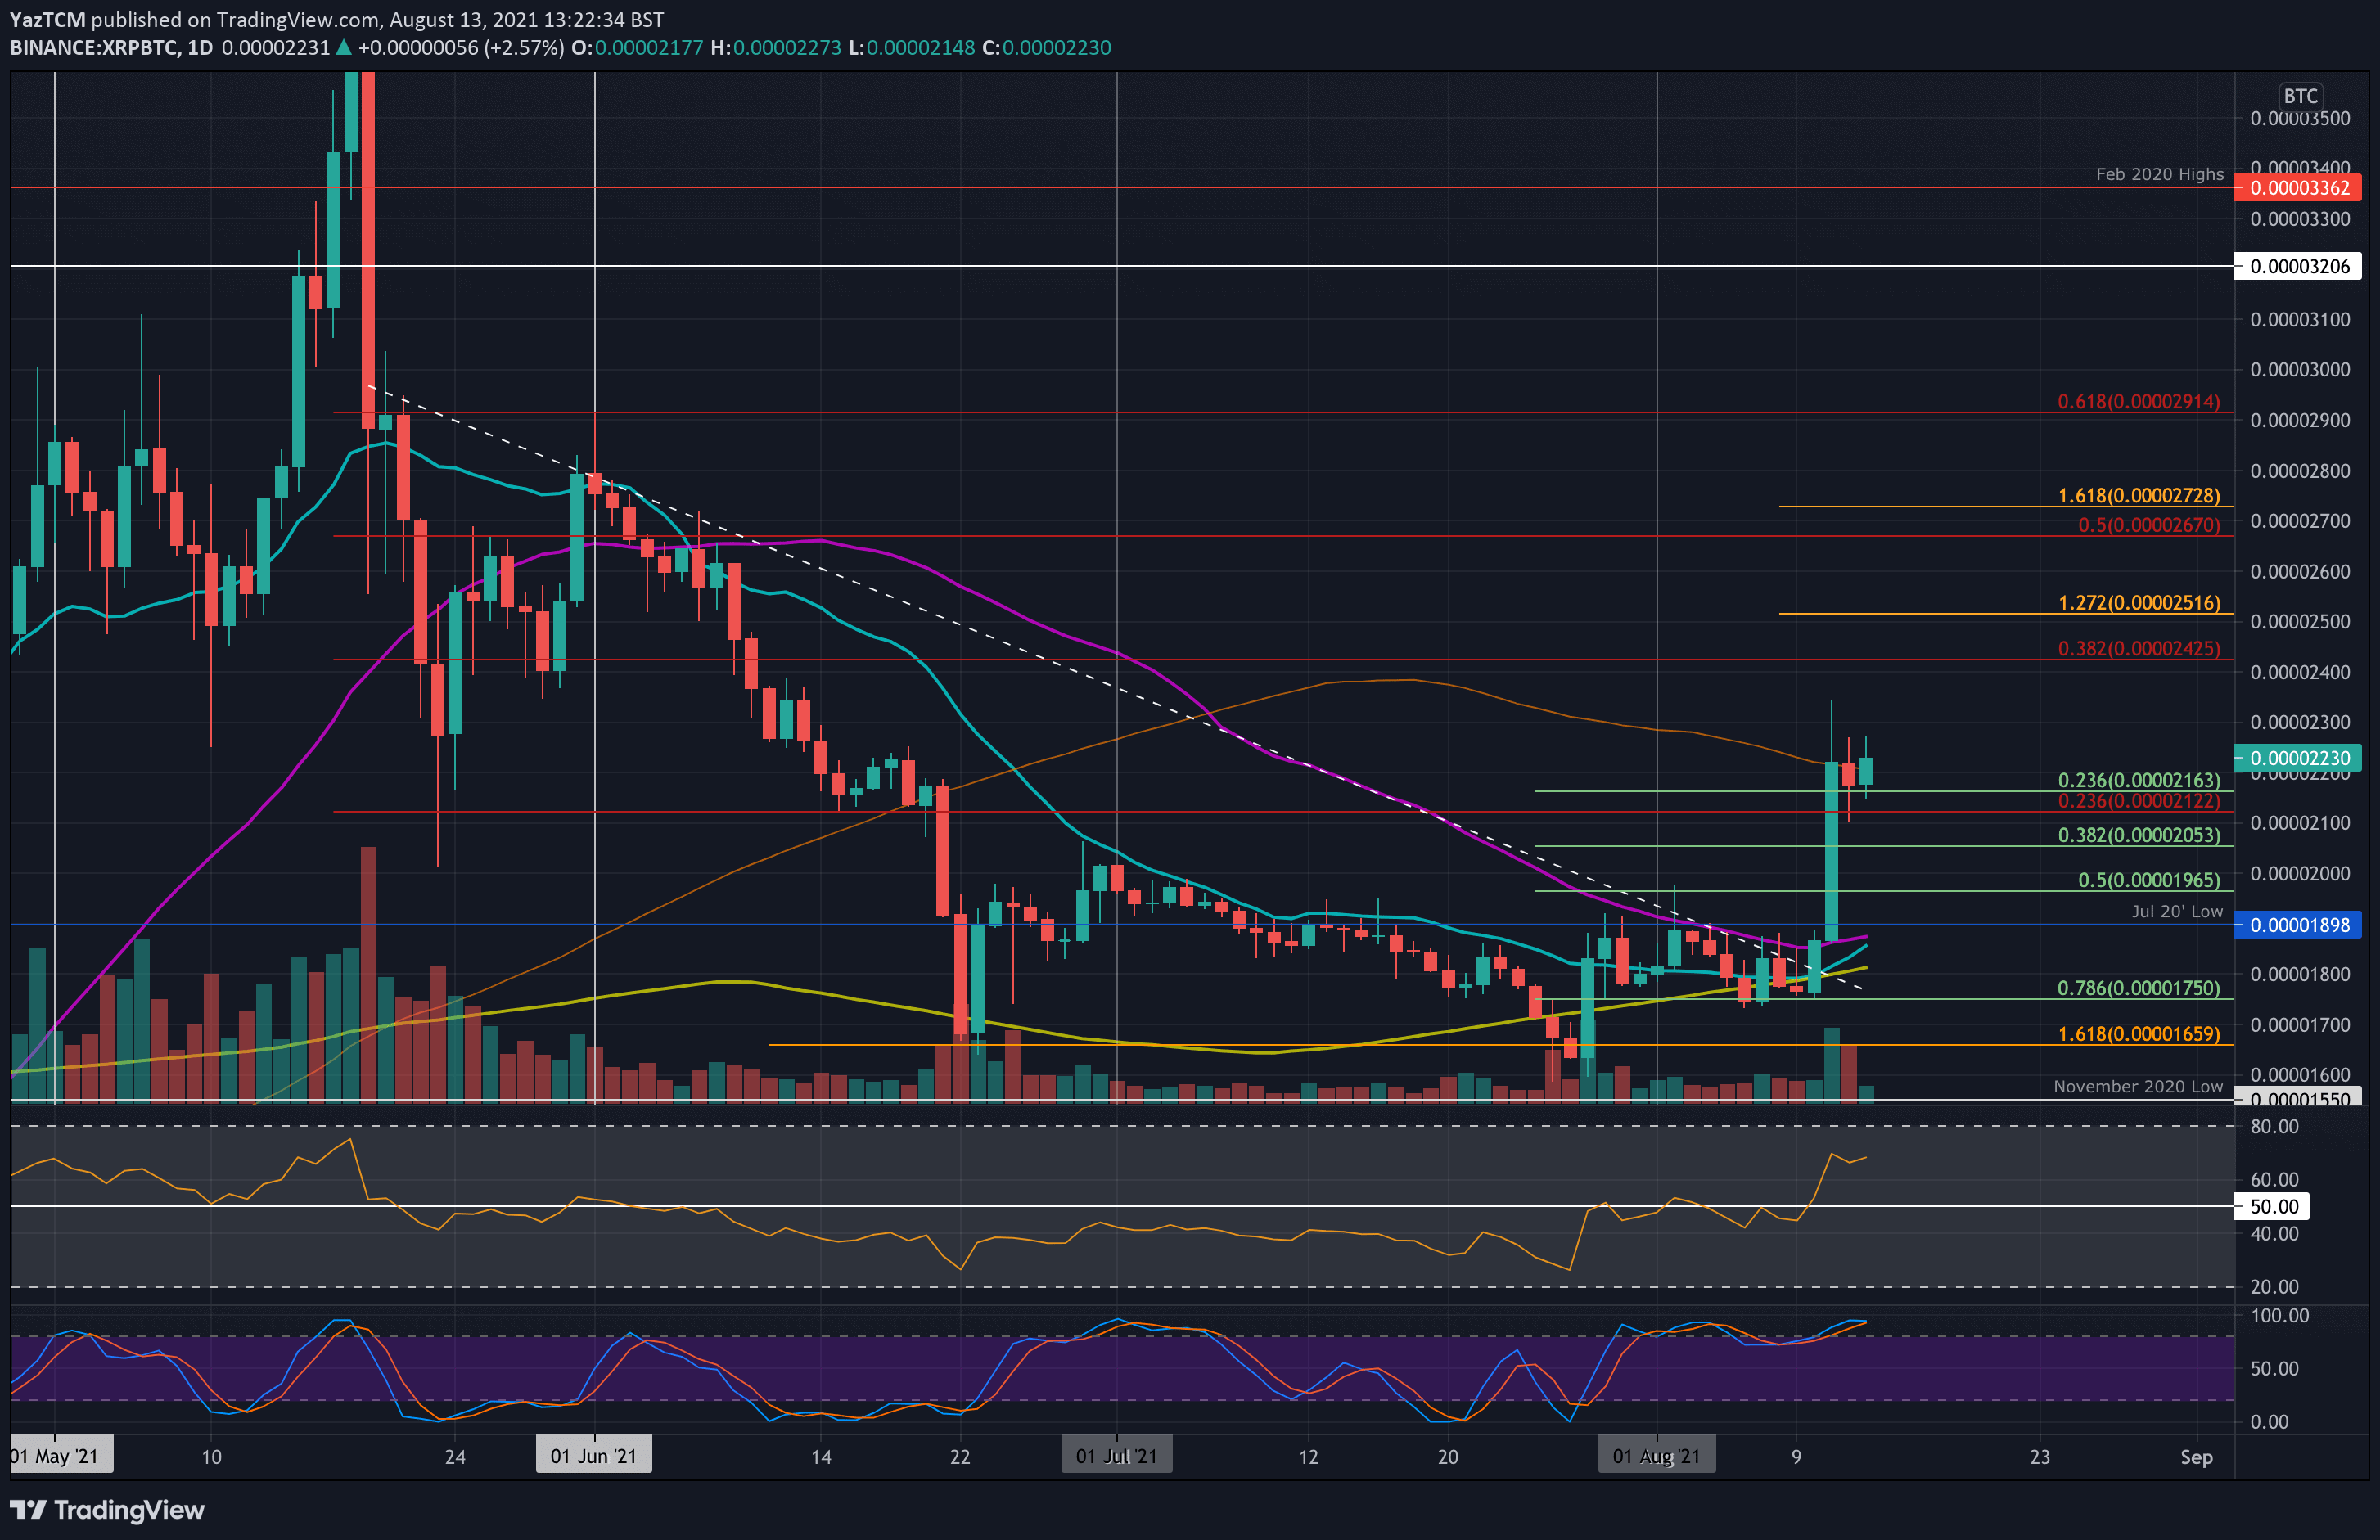
Against BTC, XRP managed to break above a long-term descending trend line that was preventing the market to push higher this week. It was trading at around 1800 SAT and was struggling to break the 50-day MA until Tuesday when XRP poked above the descending trend line.
On Wednesday, XRP exploded higher to break 2000 SAT and hit the 100-day MA at around 2200 SAT. It is currently still trading around this level after finding support at 2160 SAT (.236 Fib) yesterday.
Looking ahead, the first resistance lies at 2300 SAT. This is followed by 2425 SAT (bearish .382 Fib), 2515 SAT (1.272 Fib Extension), 2670 SAT (bearish .5 Fib), and 2800 SAT.
On the other side, the first support lies at 2160 SAT (.236 Fib). This is followed by 2050 SAT (.382 Fib), 2000 SAT, 1965 SAT (.5 Fib), and 1900 SAT (July 2020 low & 50-day MA).
Cardano
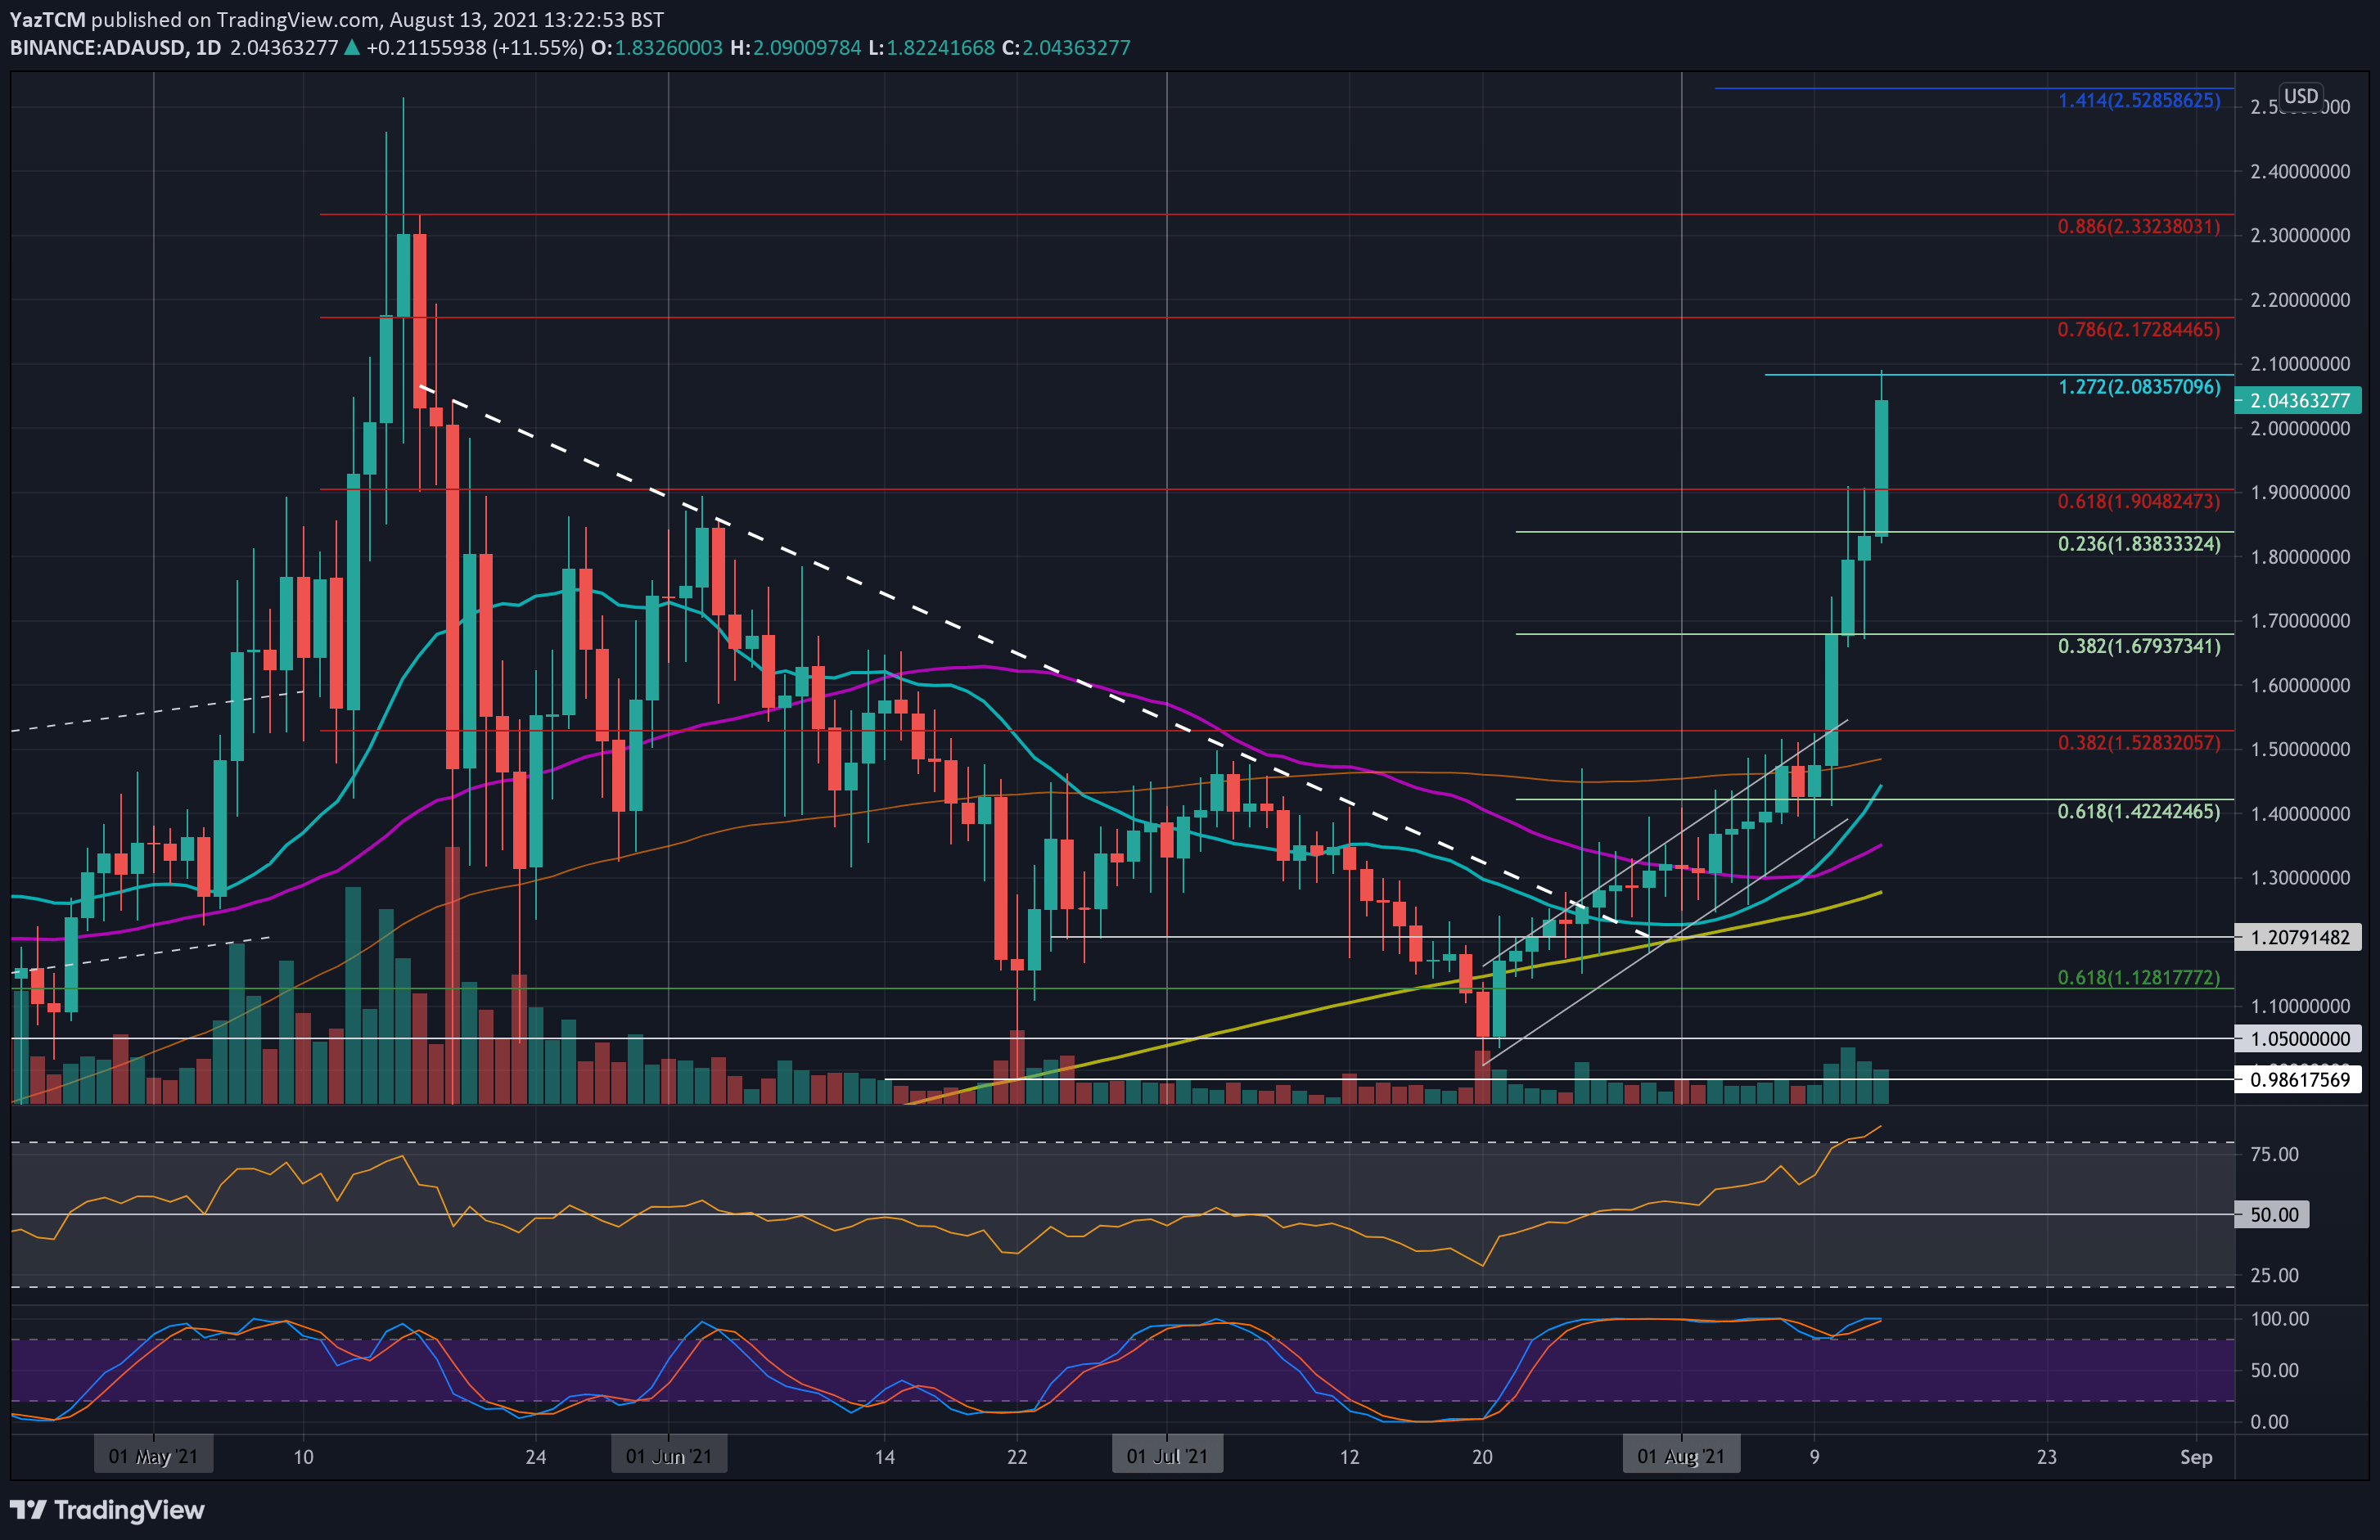
ADA also saw an impressive 47.9% price explosion this week as it breaks back above $2. At the start of the week, ADA was trading inside an ascending price channel. The breakout above the channel came on Tuesday when pushed above the 100-day MA and broke the upper border at $1.50.
It continued higher on Wednesday and Thursday to reach the resistance at $1.90, provided by a bearish .618 Fib Retracement level. Today, ADA surged another 17% to break the resistance at $1.90, pass $2.00, and reach as high as $2.10.
Looking ahead, if the buyers break $2.10, the first resistance lies at $2.17 (bearish .786 Fib). This is followed by $2.33 (bearish .886 Fib), $2.40, and $2.50 (1.414 Fib Extension).
On the other side, the first support lies at $2. This is followed by $1.90, $1.83 (.236 Fib), $1.68 (.382 Fib), $1.60, and $1.50 (100-day MA).
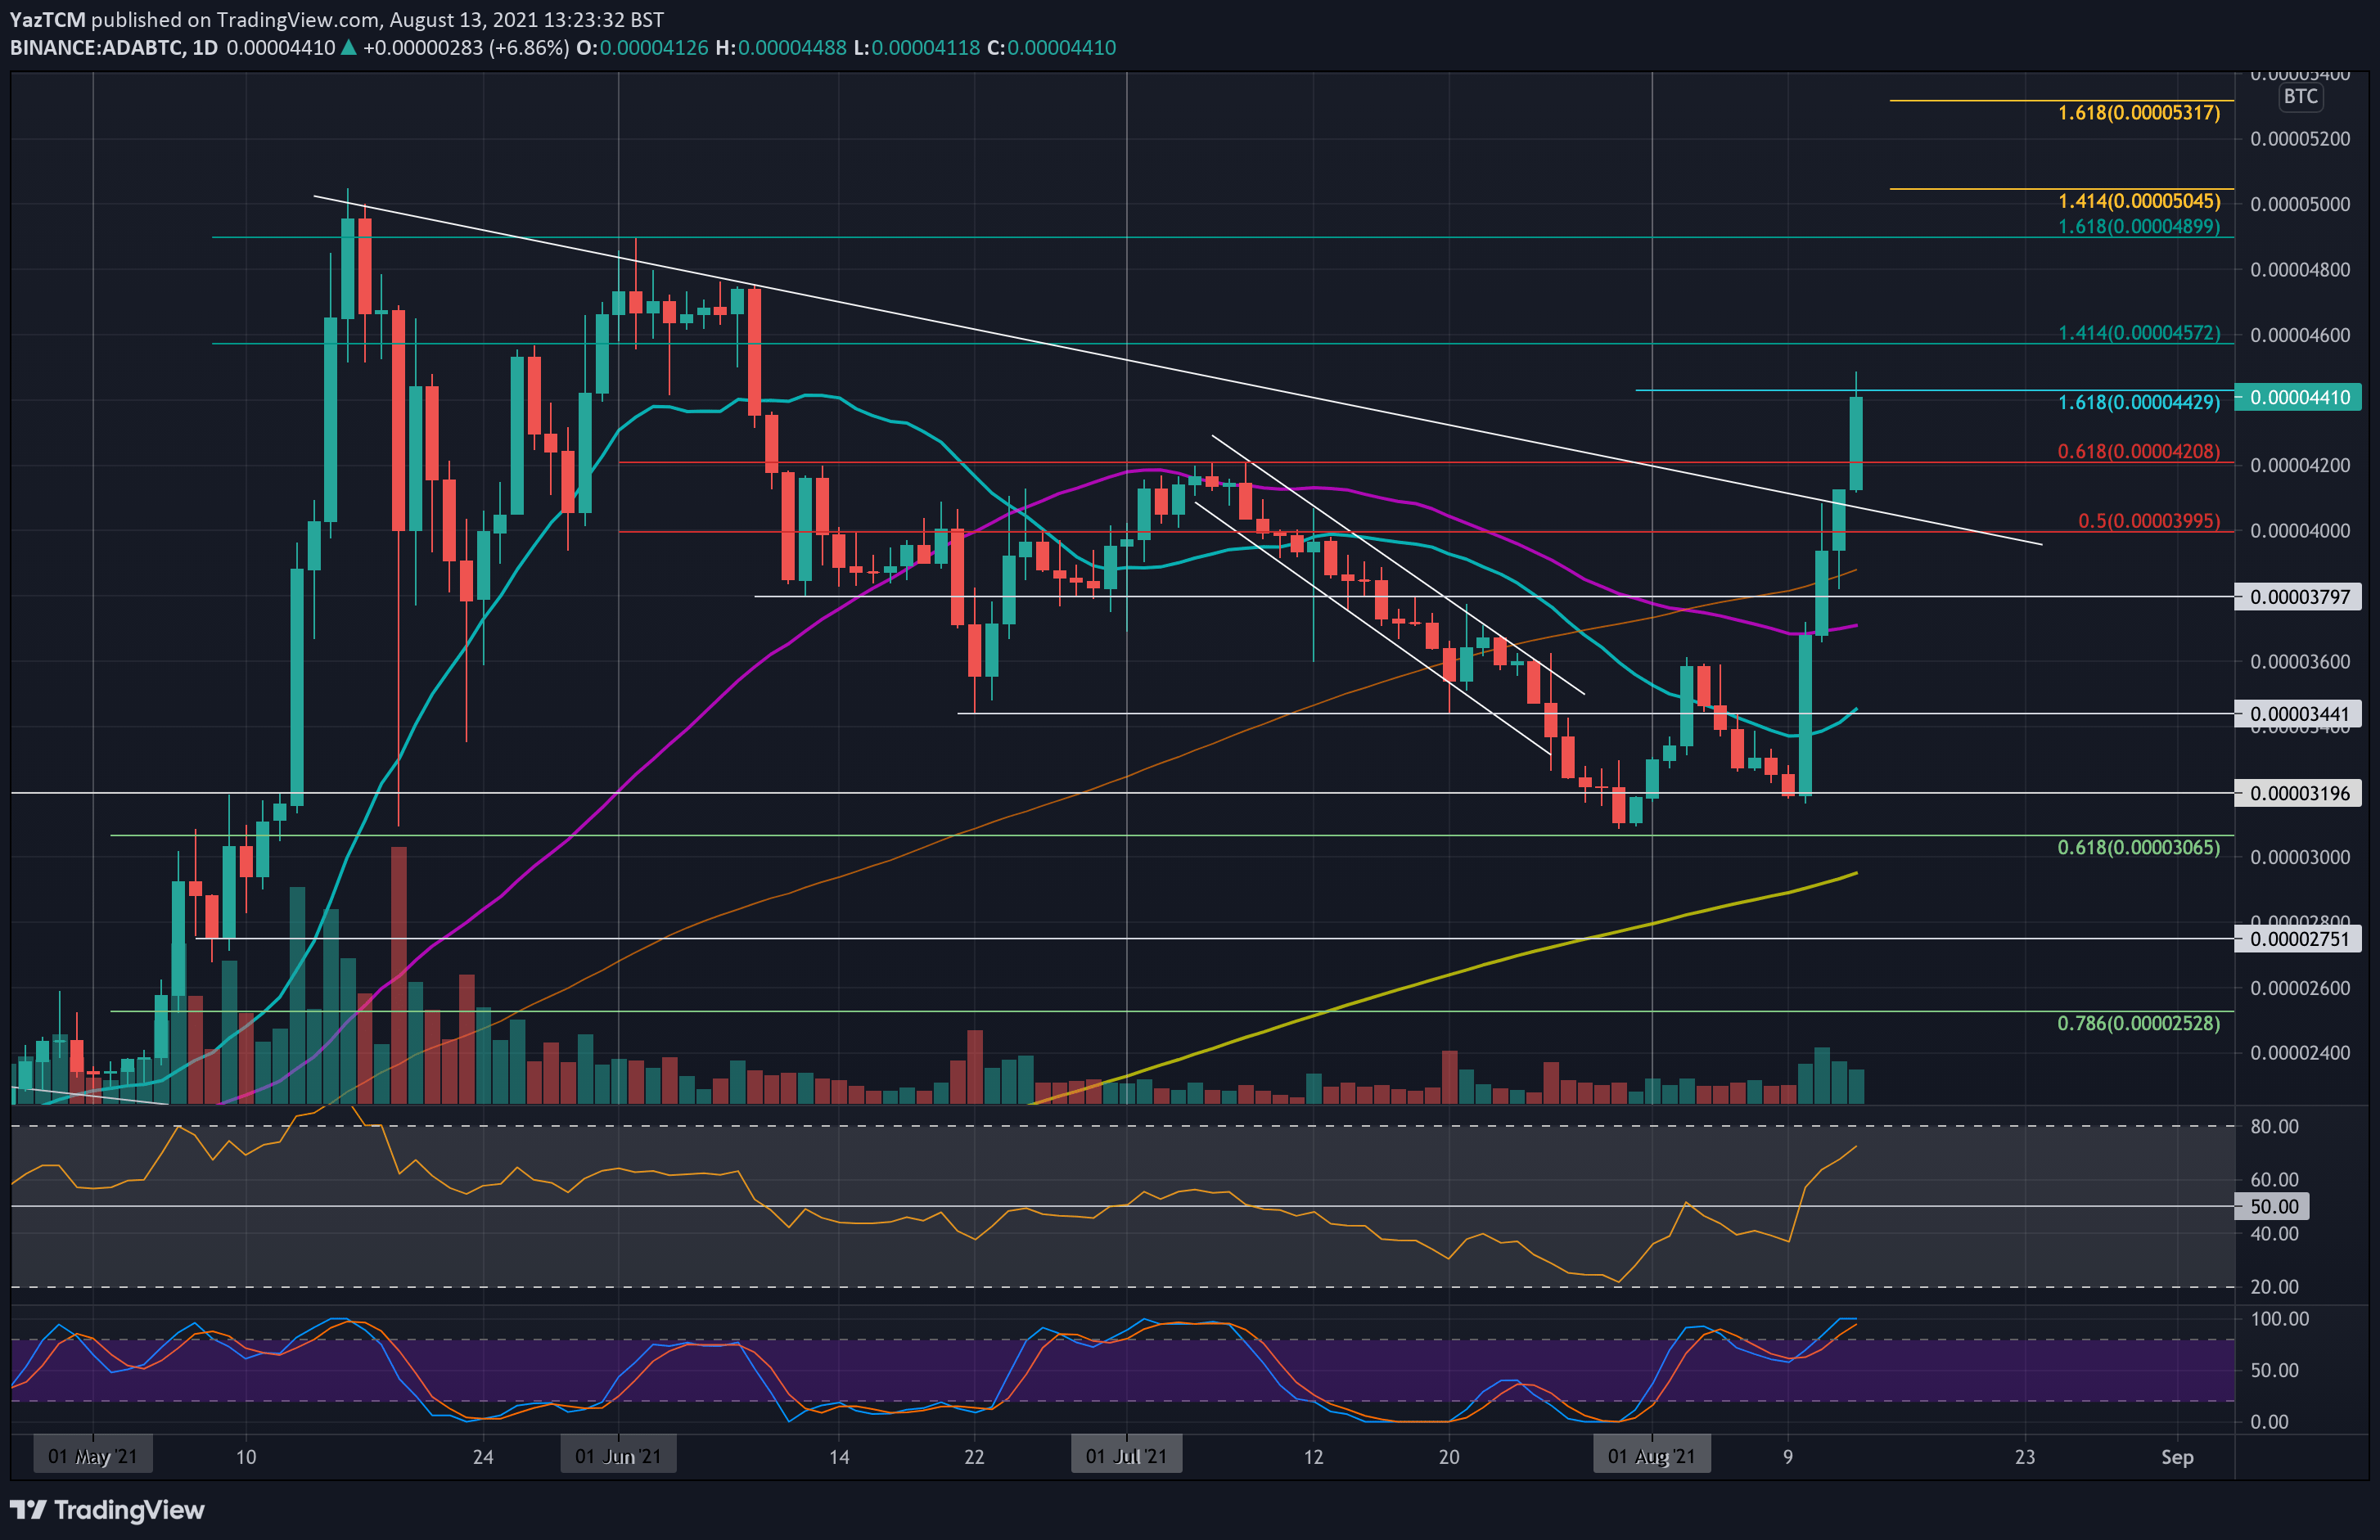
ADA is also performing very well against BTC. It found support around 3200 SAT on Tuesday and rebounded to meet the 50-day MA. On Wednesday, ADA continued above the 50-day MA to reach resistance at a long-term descending trend line.
This trend line was penetrated yesterday, and ADA continued higher today to reach 4430 SAT (1.618 Fib Extension).
Moving forward, the first resistance above 4430 SAT lies at 4570 SAT (1.414 Fib Extension). This is followed by 4900 SAT (1.618 Fib Extension), 5000 SAT (May highs), and 5320 SAT (1.618 Fib Extension – orange).
On the other side, the first support lies at 4200 SAT (July highs). This is followed by 4000 SAT, 3850 SAT (100-day MA), 3750 SAT (50-day MA), and 3600 SAT.
Binance Coin
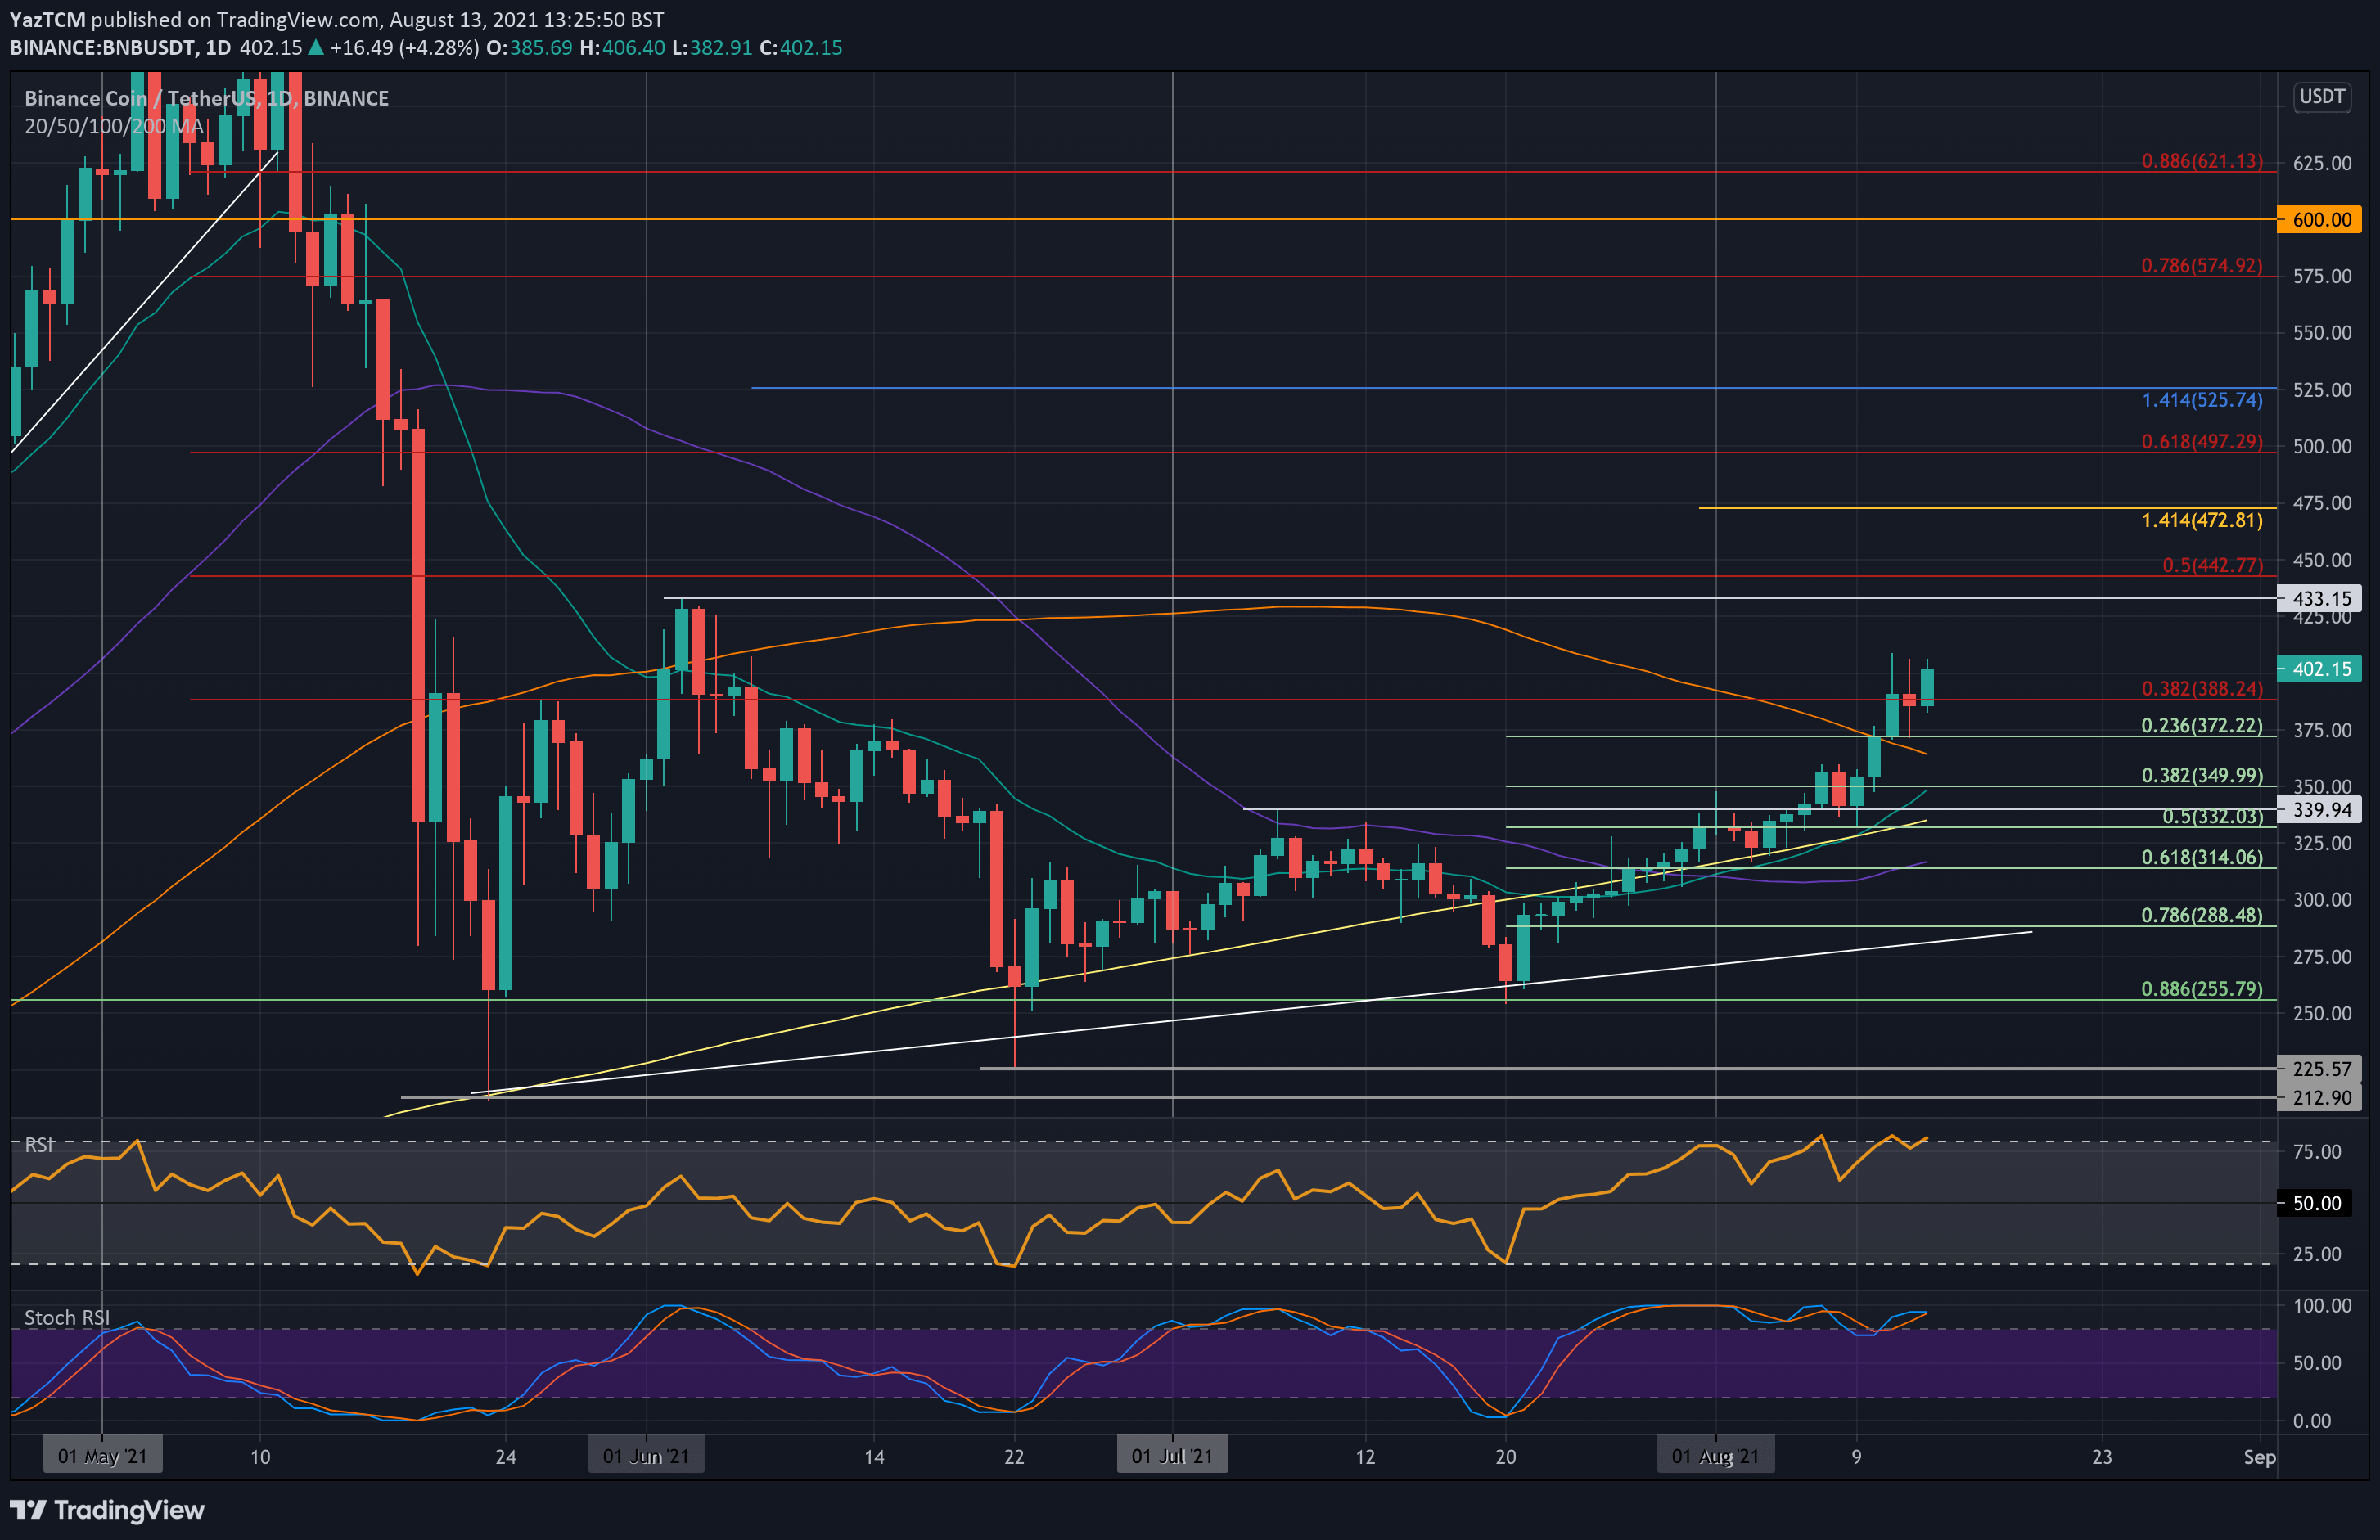
BNB saw a respectable 18.8% price hike this week as the coin breaches $400 again. The coin was trading around $340 last Friday as it started to push higher. By Tuesday, BNB managed to meet the 100-day MA and break it on Wednesday to reach $410.
It did drop lower yesterday to meet support at $372 (.236 Fib) but rebounded again today to break back above $400.
Looking ahead, the first resistance lies at $433, provided by the June highs. This is followed by $442 (bearish .5 Fib), $472 (1.414 Fib Extension), and $500 (bearish .618 Fib).
On the other side, the first support lies at $373 (.236 Fib). This is followed by $350 (.382 Fib), $332 (.5 Fib & 200-day MA), and $315 (.618 Fib & 50-day MA).
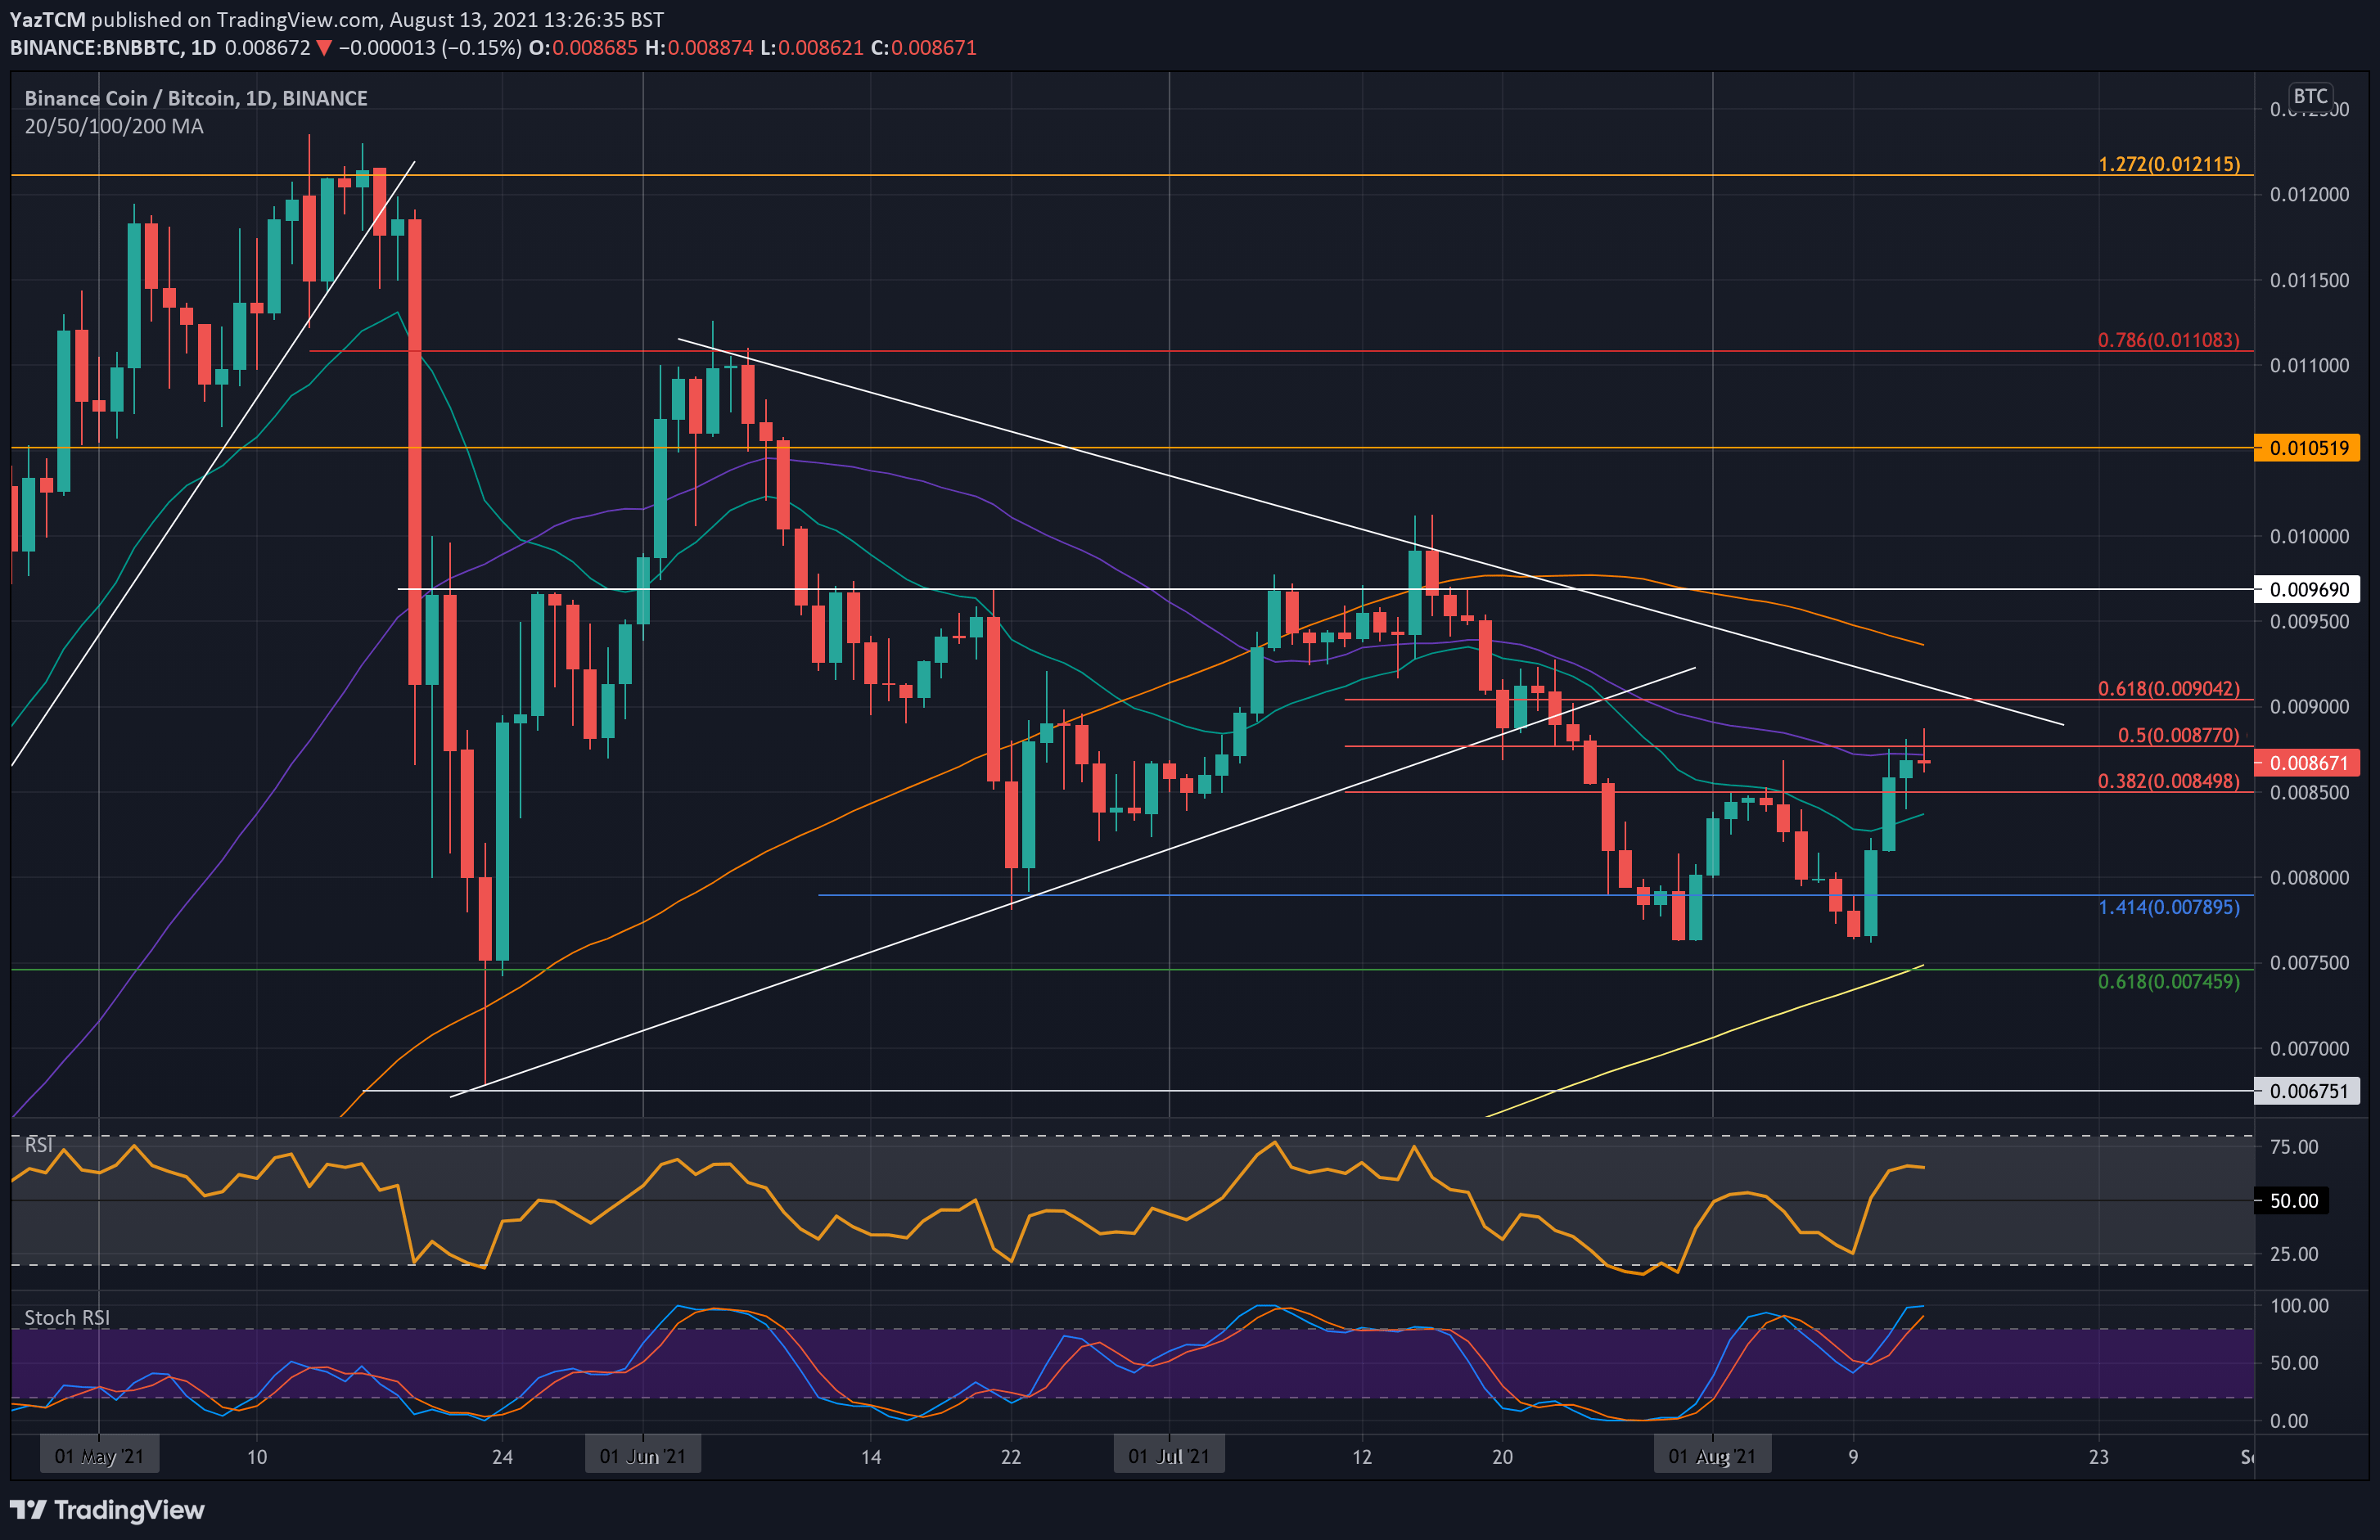
BNB also rebounded higher against BTC to set a new August high today. The coin formed a double bottom pattern at 0.00765 BTC on Tuesday and started to rebound from there. By Wednesday, BNB penetrated the 20-day MA to reach the 50-day MA at around 0.00877 BTC.
BNB has since struggled to produce a closing candle above the 50-day MA.
Looking ahead, the first resistance lies at 0.00877 BTC (50-day MA & bearish .5 Fib). This is followed by 0.009 BTC (bearish .618 Fib & falling trend line), 0.0094 BTC (100-day MA), 0.0096 BTC, and 0.01 BTC.
Ont the other side, the first support lies at 0.0085 BTC. This is followed by 0.00836 BTC (20-day MA), 0.008 BTC, and 0.00765 BTC (Double-bottom).