Bitcoin Bitcoin surged 8% today as it reclaims K but is just up 2% on the week. Last Friday, Bitcoin was trading inside an ascending price channel as it breached the January 2021 high at ,000 to reach as high as ,400 over the weekend. From there, BTC rolled over and broke beneath the ascending price channel on Monday. It then traded downward inside a descending wedge formation – best seen on the 4-hour chart. This wedge saw the price of BTC being driven lower until support was found at around ,500, provided by a .382 Fib Retracement level. It would rebound from the ,500 support on Wednesday and break toward the upside of the wedge and push above the 100-day MA. After a brief return to ,500 yesterday, BTC surged higher to reclaim K as it tests
Topics:
Yaz Sheikh considers the following as important: Bitcoin (BTC) Price, BTCEUR, BTCGBP, btcusd, btcusdt, Chainlink (LINK) Price, DOTBTC, DOTUSD, DOTUSDT, ETH Analysis, ETHBTC, Ethereum (ETH) Price, ethusd, LINKBTC, LINKUSD, Polkadot (DOT) Price, Price Analysis, Ripple (XRP) Price, XRP Analysis, xrpbtc, xrpusd
This could be interesting, too:
Chayanika Deka writes XRP, SOL, and ADA Inclusion in US Crypto Reserve Pushes Traders on Edge
Chayanika Deka writes Why Arthur Hayes Is Bullish on Bitcoin Under Trump’s Economic Strategy
Mandy Williams writes Why the Bitcoin Market Is Stuck—and the Key Metric That Could Change It: CryptoQuant CEO
Wayne Jones writes Metaplanet Acquires 156 BTC, Bringing Total Holdings to 2,391
Bitcoin
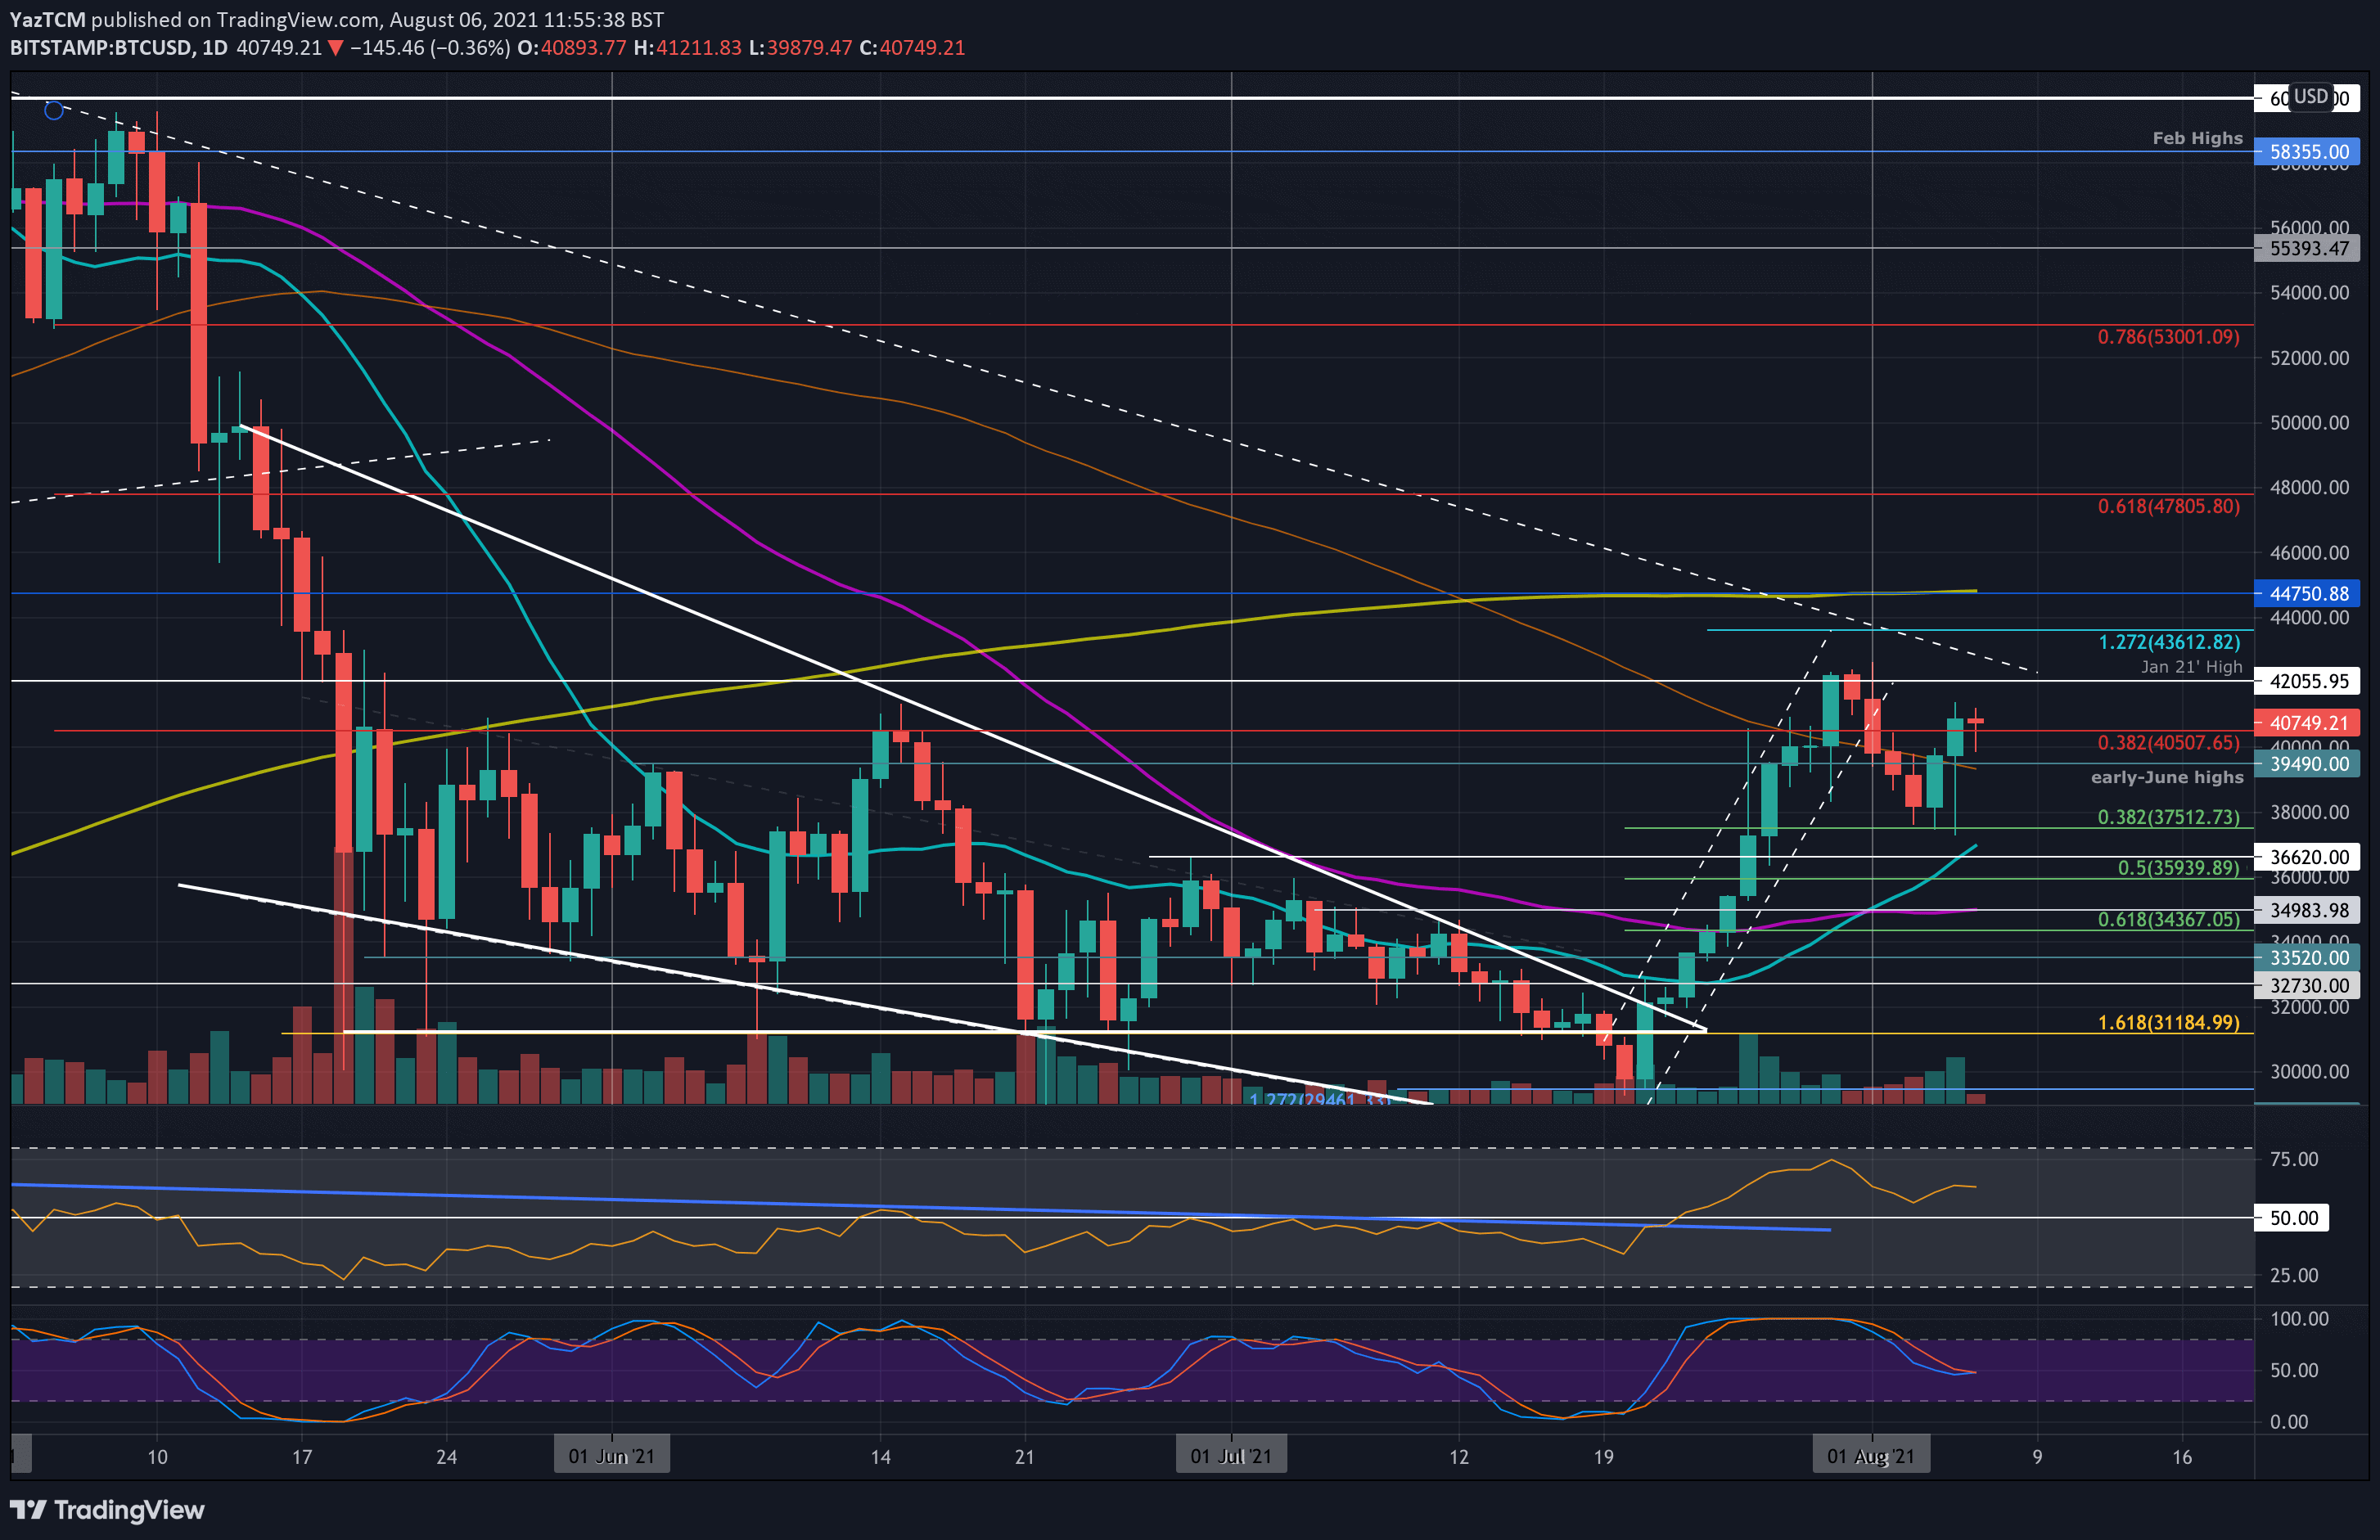
Bitcoin surged 8% today as it reclaims $40K but is just up 2% on the week. Last Friday, Bitcoin was trading inside an ascending price channel as it breached the January 2021 high at $42,000 to reach as high as $42,400 over the weekend.
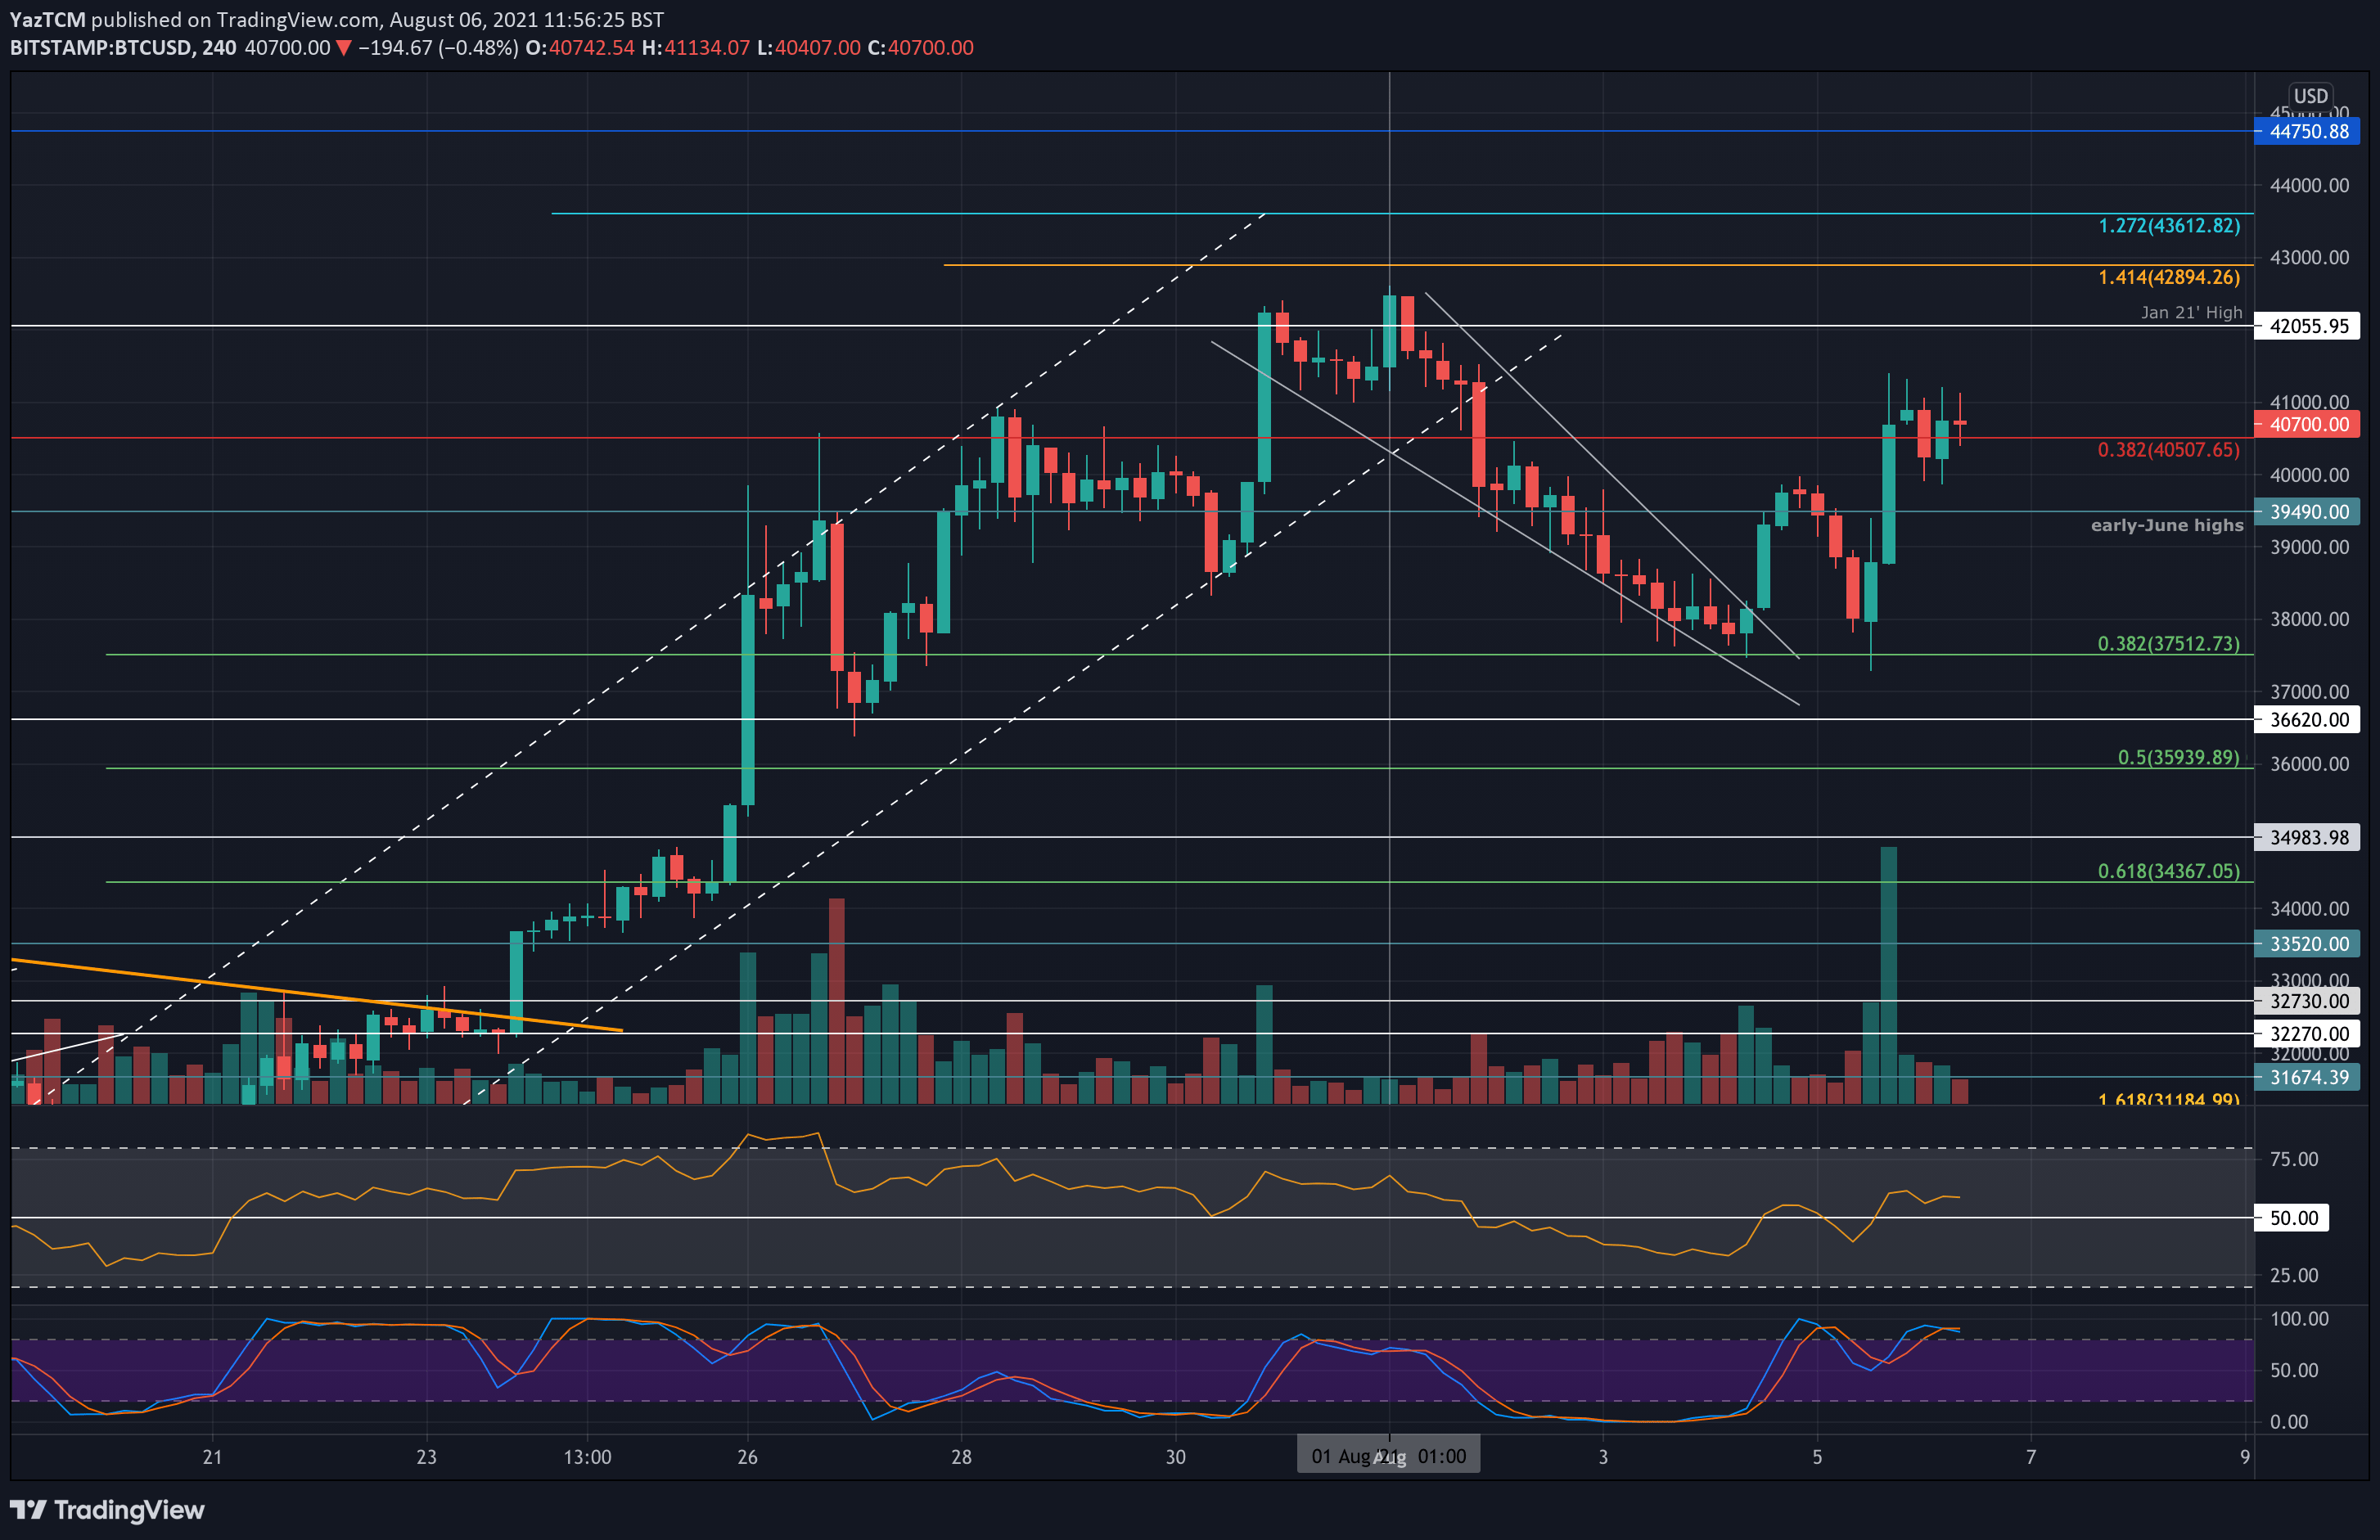
From there, BTC rolled over and broke beneath the ascending price channel on Monday. It then traded downward inside a descending wedge formation – best seen on the 4-hour chart. This wedge saw the price of BTC being driven lower until support was found at around $37,500, provided by a .382 Fib Retracement level.
It would rebound from the $37,500 support on Wednesday and break toward the upside of the wedge and push above the 100-day MA. After a brief return to $37,500 yesterday, BTC surged higher to reclaim $40K as it tests resistance at $41K.
Looking ahead, if the buyers continue higher, the first resistance lies at $42,000 (Jan highs). This is followed by a descending trend line (dashed line), $43,600 (1.272 Fib Extension), $44,750 (200-day MA), and $47,800 (bearish .618 Fib Retracement).
On the other side, the first support lies at $40,000. This is followed by $39,480 (100-day MA), $37,500 (.382 Fib), $36,650 (20-day MA), and $36,000 (.5 Fib).
Ethereum
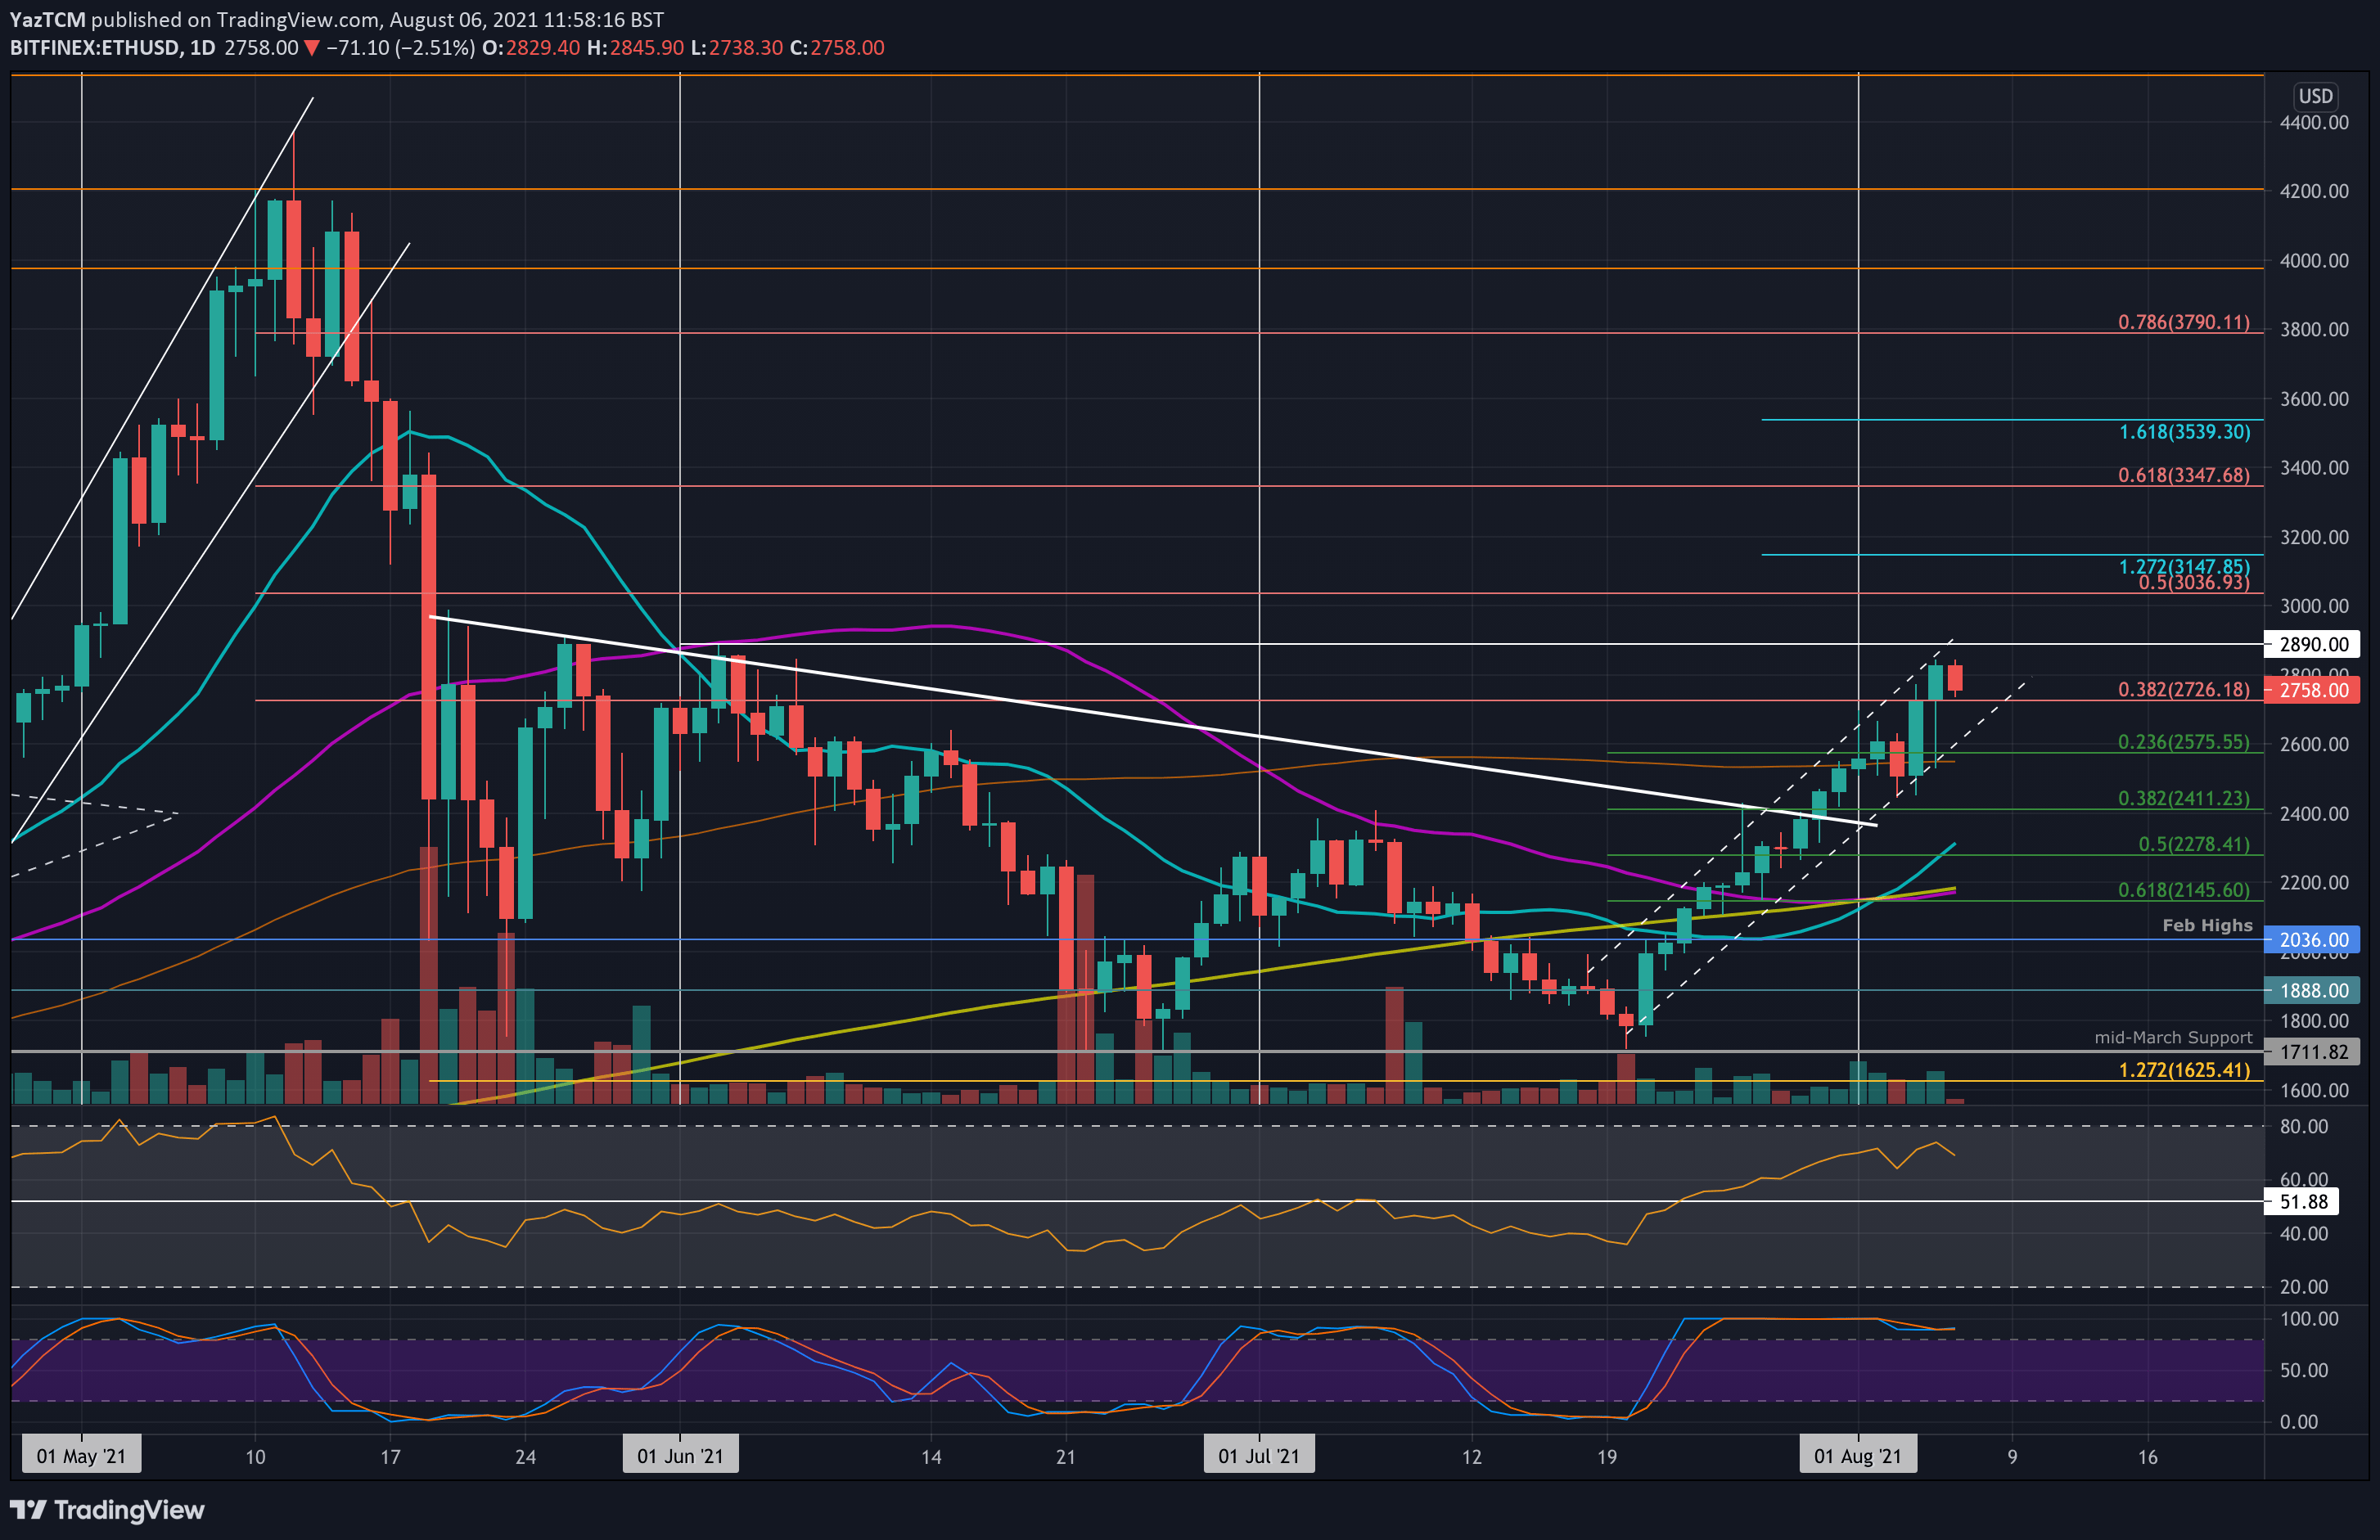
Ethereum saw an impressive 16% price hike this week as the coin surged in the run-up to the London Hard Fork upgrade. The cryptocurrency has been trading inside an ascending price channel since the second half of July.
This price channel allowed ETH to pass the 200-day MA, break above a two-month-old falling trend line, and create a new July high toward the end of the month.
This week, ETH continues inside the ascending price channel, using the lower boundary as support. On Wednesday, it rebounded from the lower boundary as it broke the 100-day MA again to hit resistance at $2726 (bearish .382 Fib). This resistance was penetrated yesterday, allowing ETH to break above $2800. It has since dropped slightly and is trading around $2760.
Looking ahead, if the buyers push higher, the first resistance lies at $2890 (upper angle of the price channel). This is followed by $3000, $3035 (bearish .5 Fib), and $3150 (1.272 Fib Extension). Added resistance is found at $3350 (bearish .618 Fib) and $3540 (1.618 Fib Extension).
On the other side, the first support lies at $2725. This is allowed by $2565 (.236 Fib & 100-day MA), $2410 (.382 Fib), $2290 (20-day MA), and $2200 (200-day & 50-day MAs).
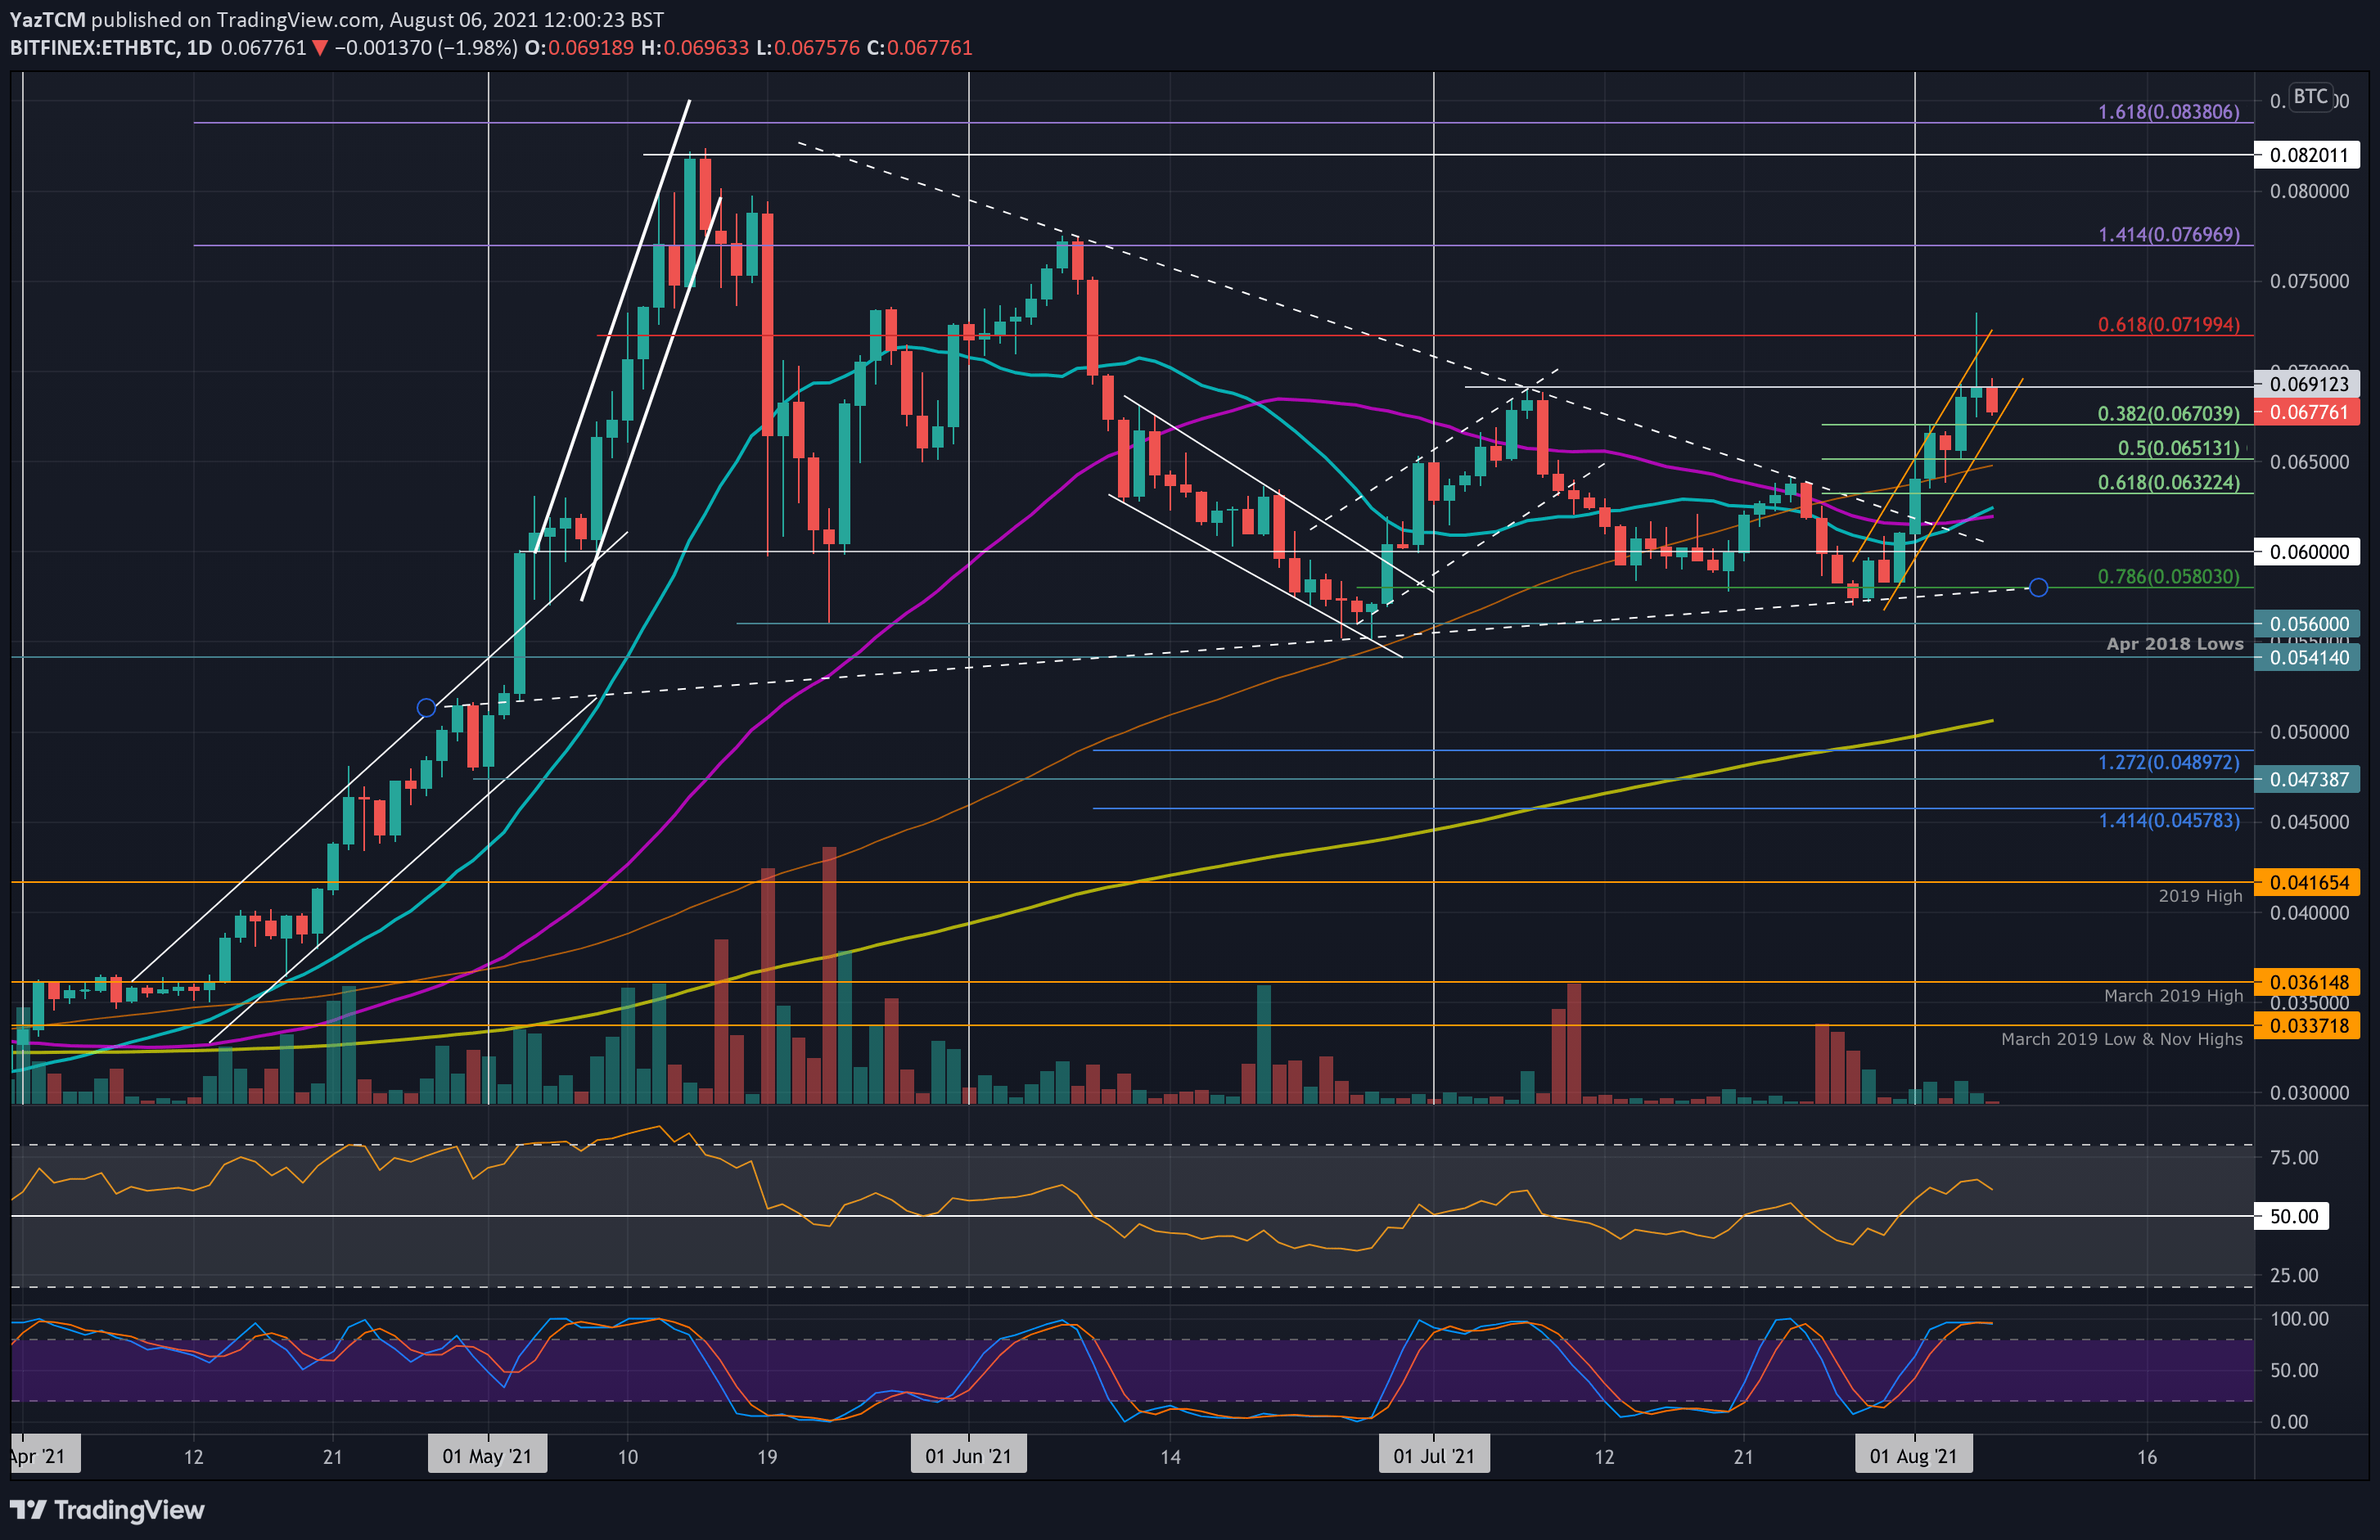
ETH is also performing well against BTC as it set a new two-month high above 0.072 BTC this week. The coin is also trading inside an ascending price channel, allowing it to reach resistance at 0.069 BTC yesterday. This is the high-day closing price for July.
It started the week by rebounding from the 0.058 BTC (.786 Fib) support last Friday as it pushed higher to form the price channel. It went on to break the 100-day MA and reach above 0.072 BTC yesterday. It has since dropped slightly as it trades near 0.067 BTC but is using the lower boundary of the price channel as support.
Looking ahead, if the bears push beneath the price channel, the first support lies at 0.065 BTC (.5 Fib & 100-day MA). This is followed by 0.0632 BTC (.618 Fib) 0.062 BTC (50-day MA), and 0.06 BTC.
On the other side, the first resistance lies at 0.069 BTC. This is followed by 0.072 BTC (bearish .618 Fib), 0.075 BTC, and 0.077 BTC (1.414 Fib Extension & June highs).
Ripple
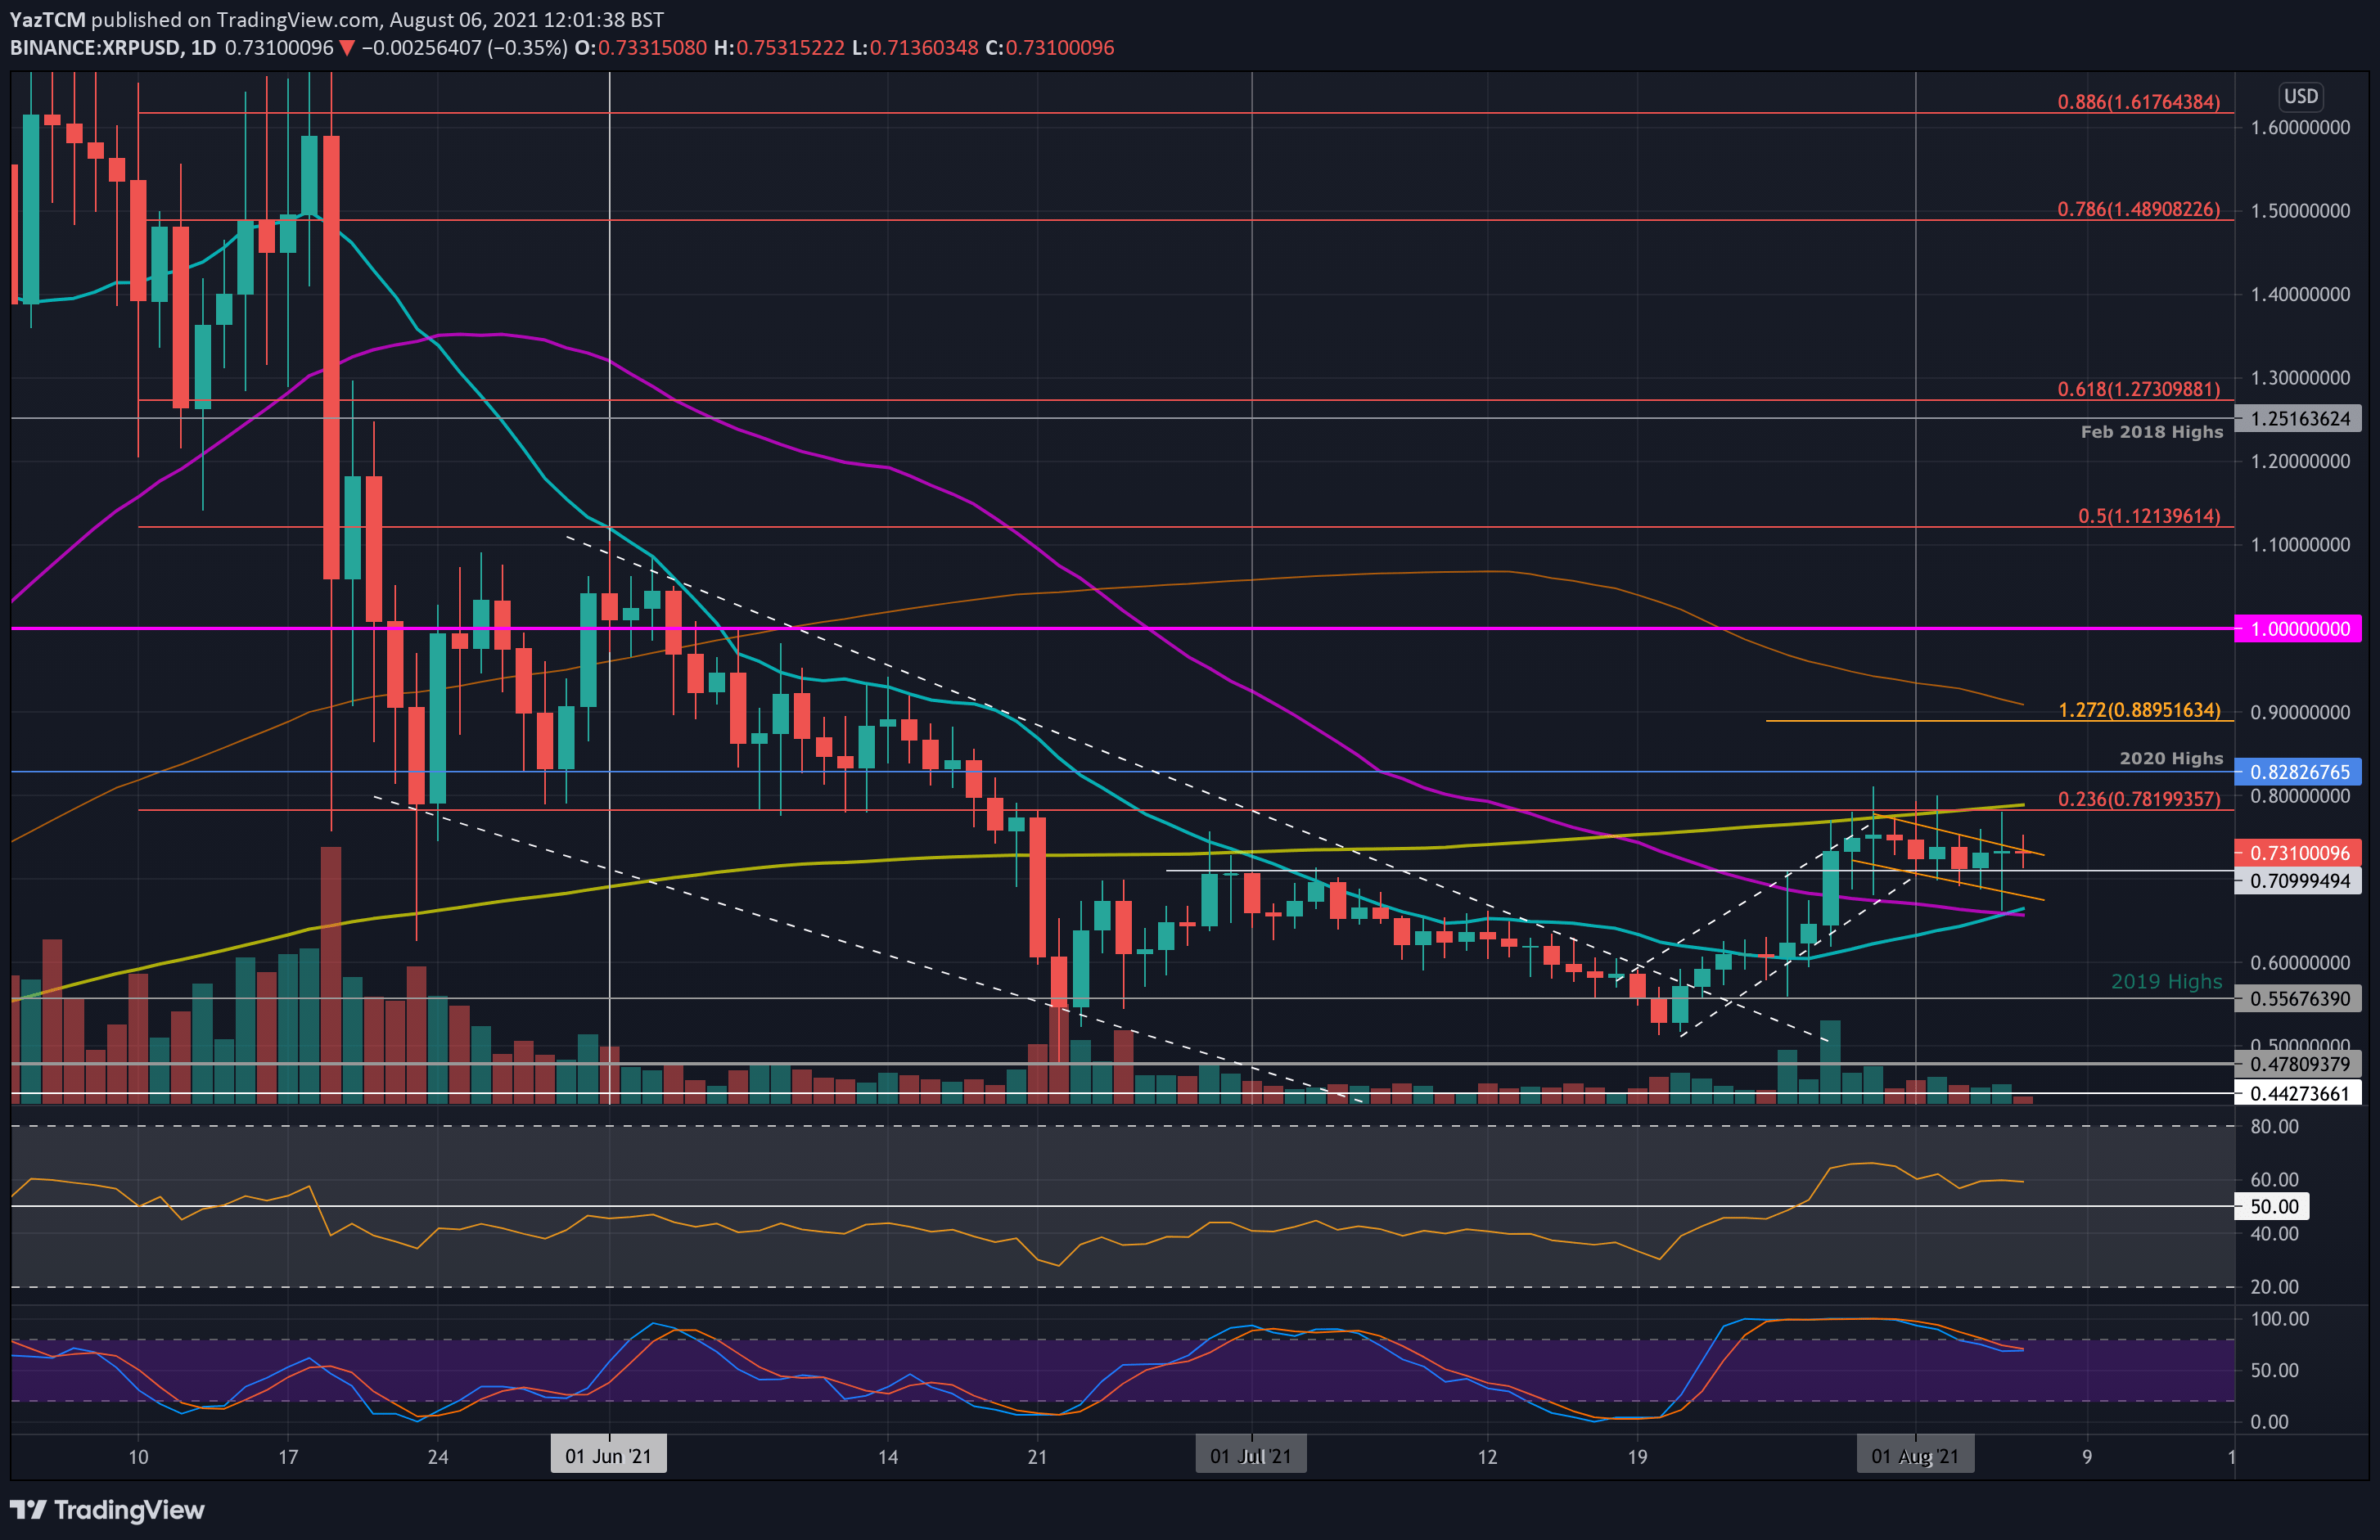
XRP is down a small 3% this week after the coin struggled to break resistance at $0.781 (200-day MA). It surged higher inside an ascending price channel in the final week of July but failed to overcome the 200-day MA at the start of this week.
Since being rejected at the 200-day MA, XRP traded inside a bullish flag formation as it found solid support at $0.71. It is battling to break above the upper angle of the flag to push higher and re-test the 200-day MA level.
Looking ahead, if the buyers can break toward the upside of the flag, the first resistance lies at $0.782 (200-day MA). This is followed by $0.8282 (2020 highs), $0.9 (100-day MA), and $1.
On the other side, the first support lies at $0.71. This is followed by the lower angle of the flag, $0.662 (50-day MA), $0.6, and $0.556 (2019 high).
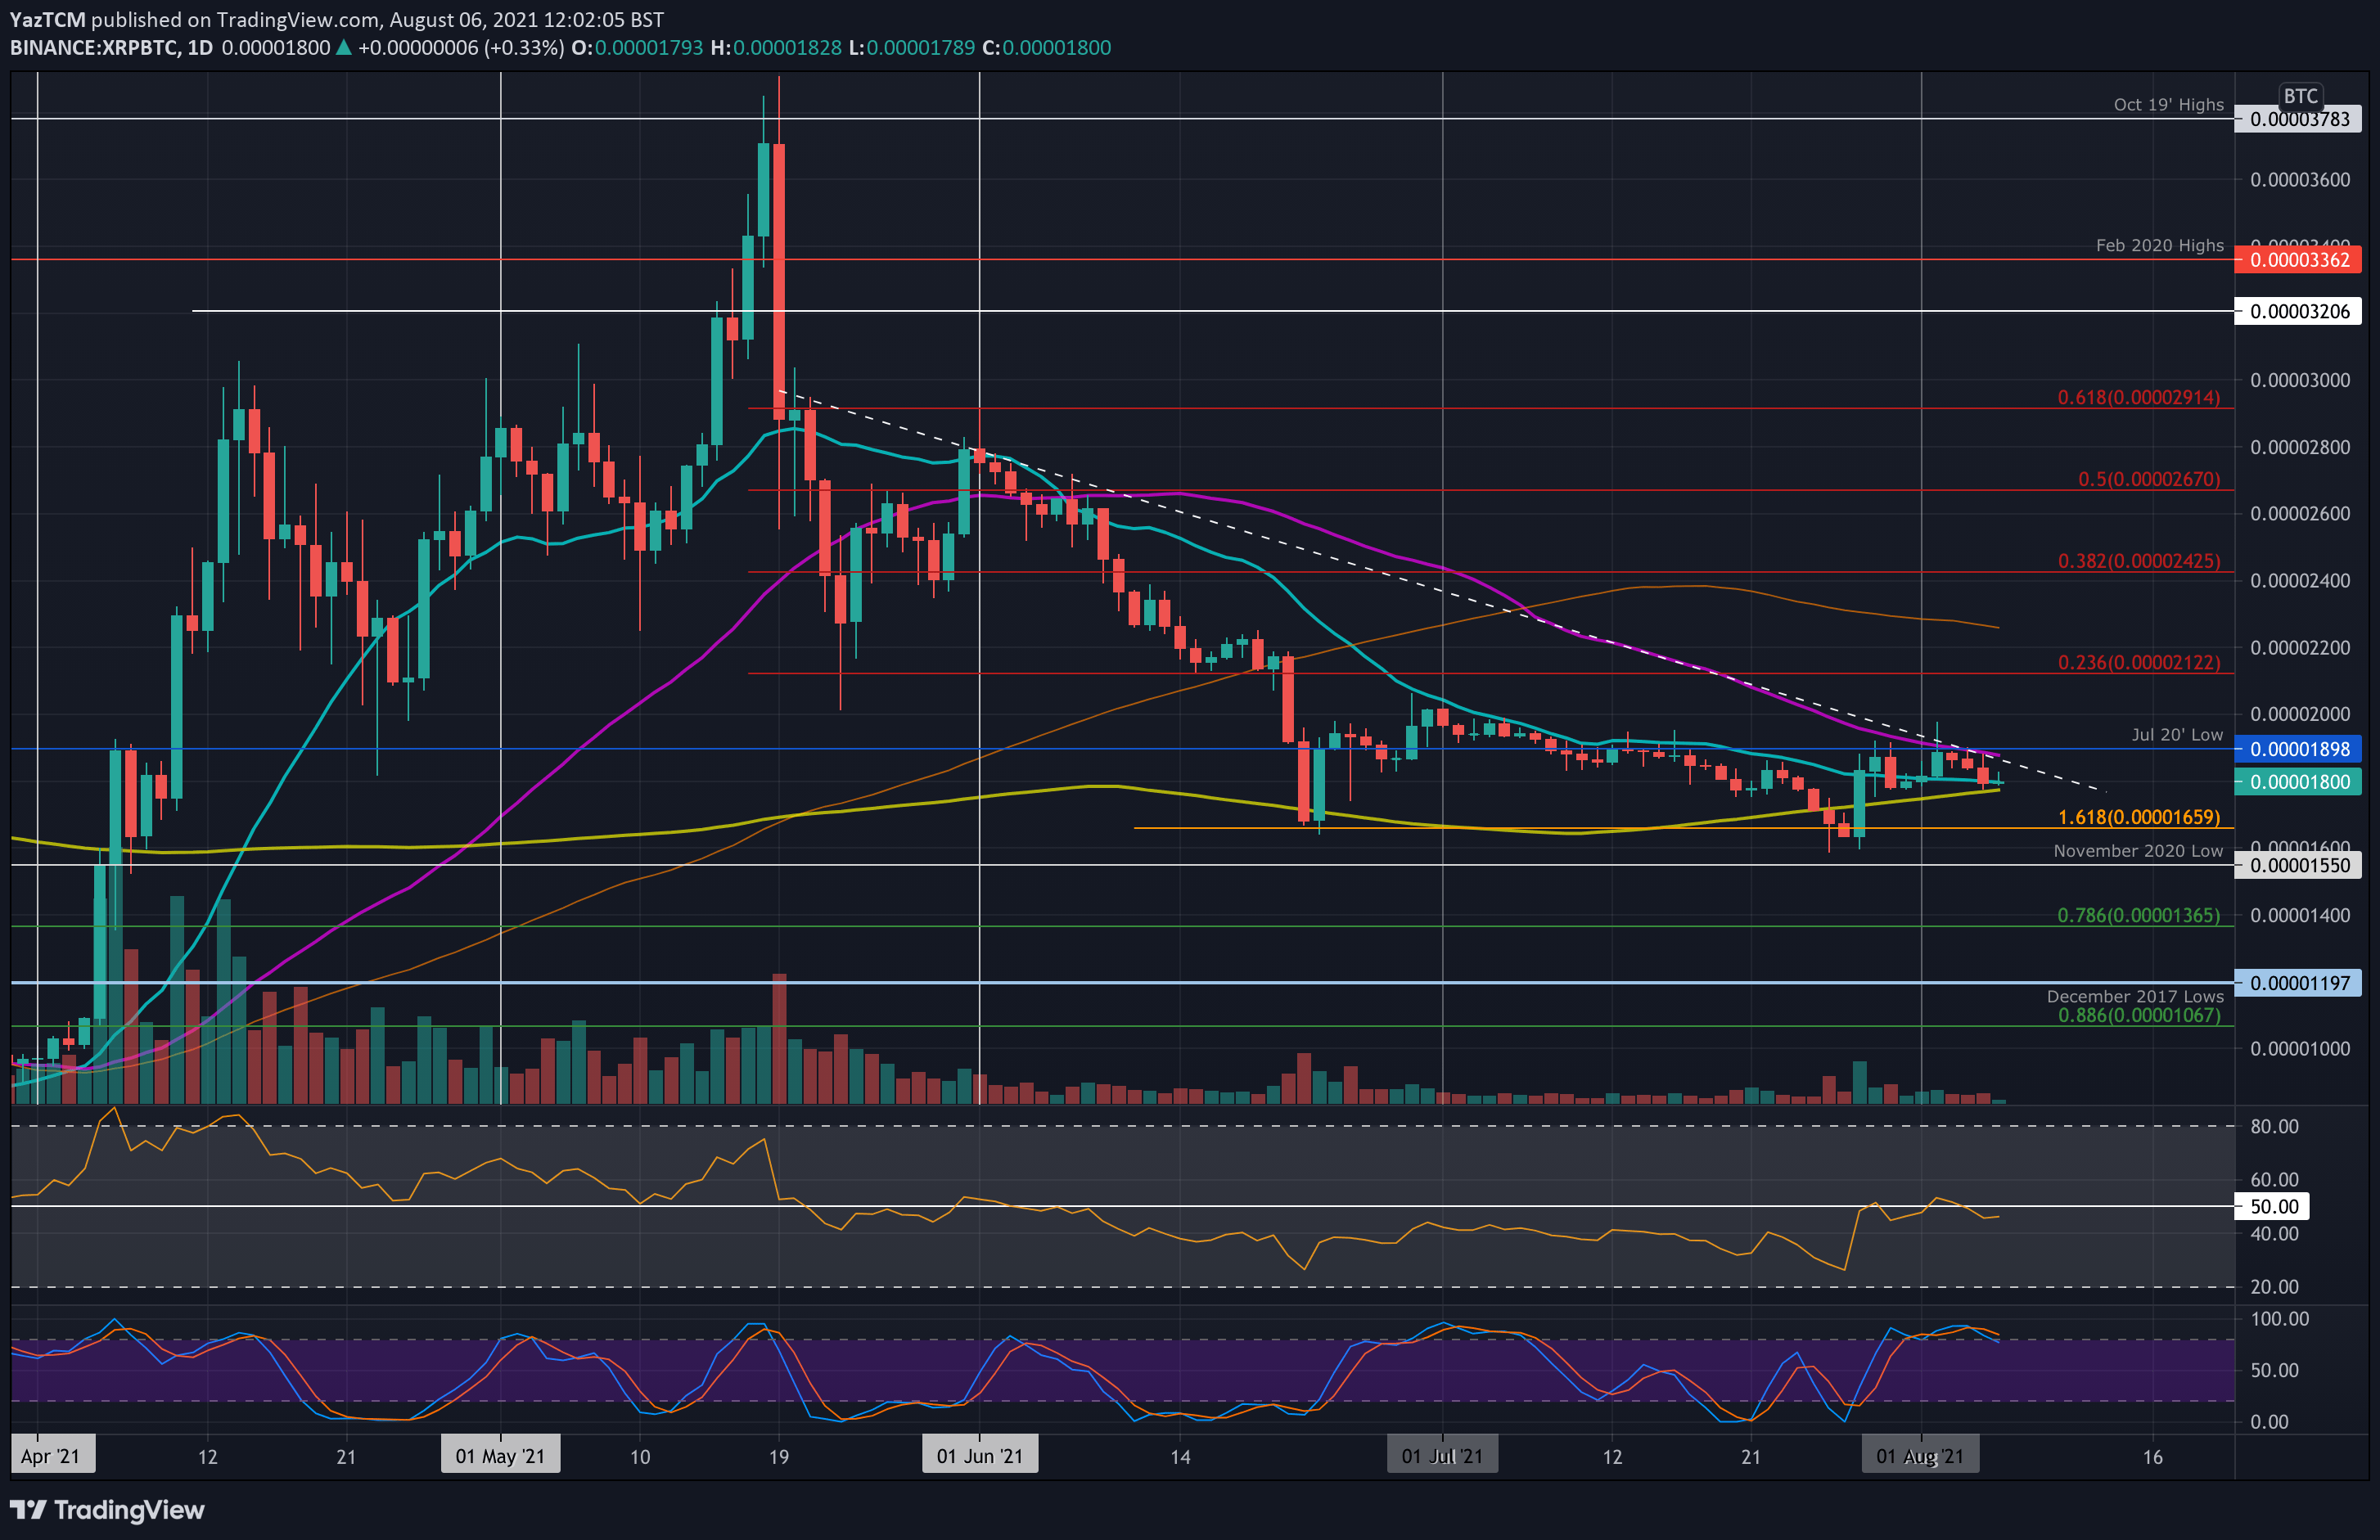
XRP is also struggling to break a long-term descending trend line against BTC, which dates back to mid-May. The coin started the week by breaking the 20-day MA at 1800 SAT to push into the 1900 SAT resistance, where it found the 50-day MA resistance and the falling trend line.
Since then, XRP moved sideways throughout the week and eventually fell back to 1800 SAT, where it is using the 20-day MA and the 200-day MA as support.
Looking ahead, if the bears break beneath 1800 SAT, the first support lies at 1660 SAT. This is followed by 1600 SAT, 1550 SAT (Nov 2020 low), and 1370 SAT (.786 Fib).
On the other side, the first resistance still lies at 1900 SAT (50-day MA & falling trend line). This is followed by 2000 SAT, 2120 SAT (bearish .236 Fib), 2250 SAT (100-day MA), and 2425 SAT (bearish .382 Fib).
Polkadot
DOT is up a very strong 24.2% this week as it battles to break the $20 resistance. The cryptocurrency has been trading inside an ascending price channel since rebounding from $11 on the 20th of July.
Last Friday, DOT broke the 50-day MA and used the upper angle of the price channel to push higher throughout the week to hit $20 yesterday. There, it found resistance at a bearish .236 Fib Retracement level and has since dropped to $19.
There are hints of bearish divergence on the RSI, which will be something to monitor over the weekend.
Looking ahead, the first resistance lies at $20. This is followed by $22.50 (100-day MA), $24.70 (1.414 Fib Extension), $25.75 (bearish .382 Fib), and $27.50 (200-day MA).
On the other side, the first support lies at $17.50 (lower angle of the price channel). This is followed by $16.40, $15 (50-day MA), and $13.

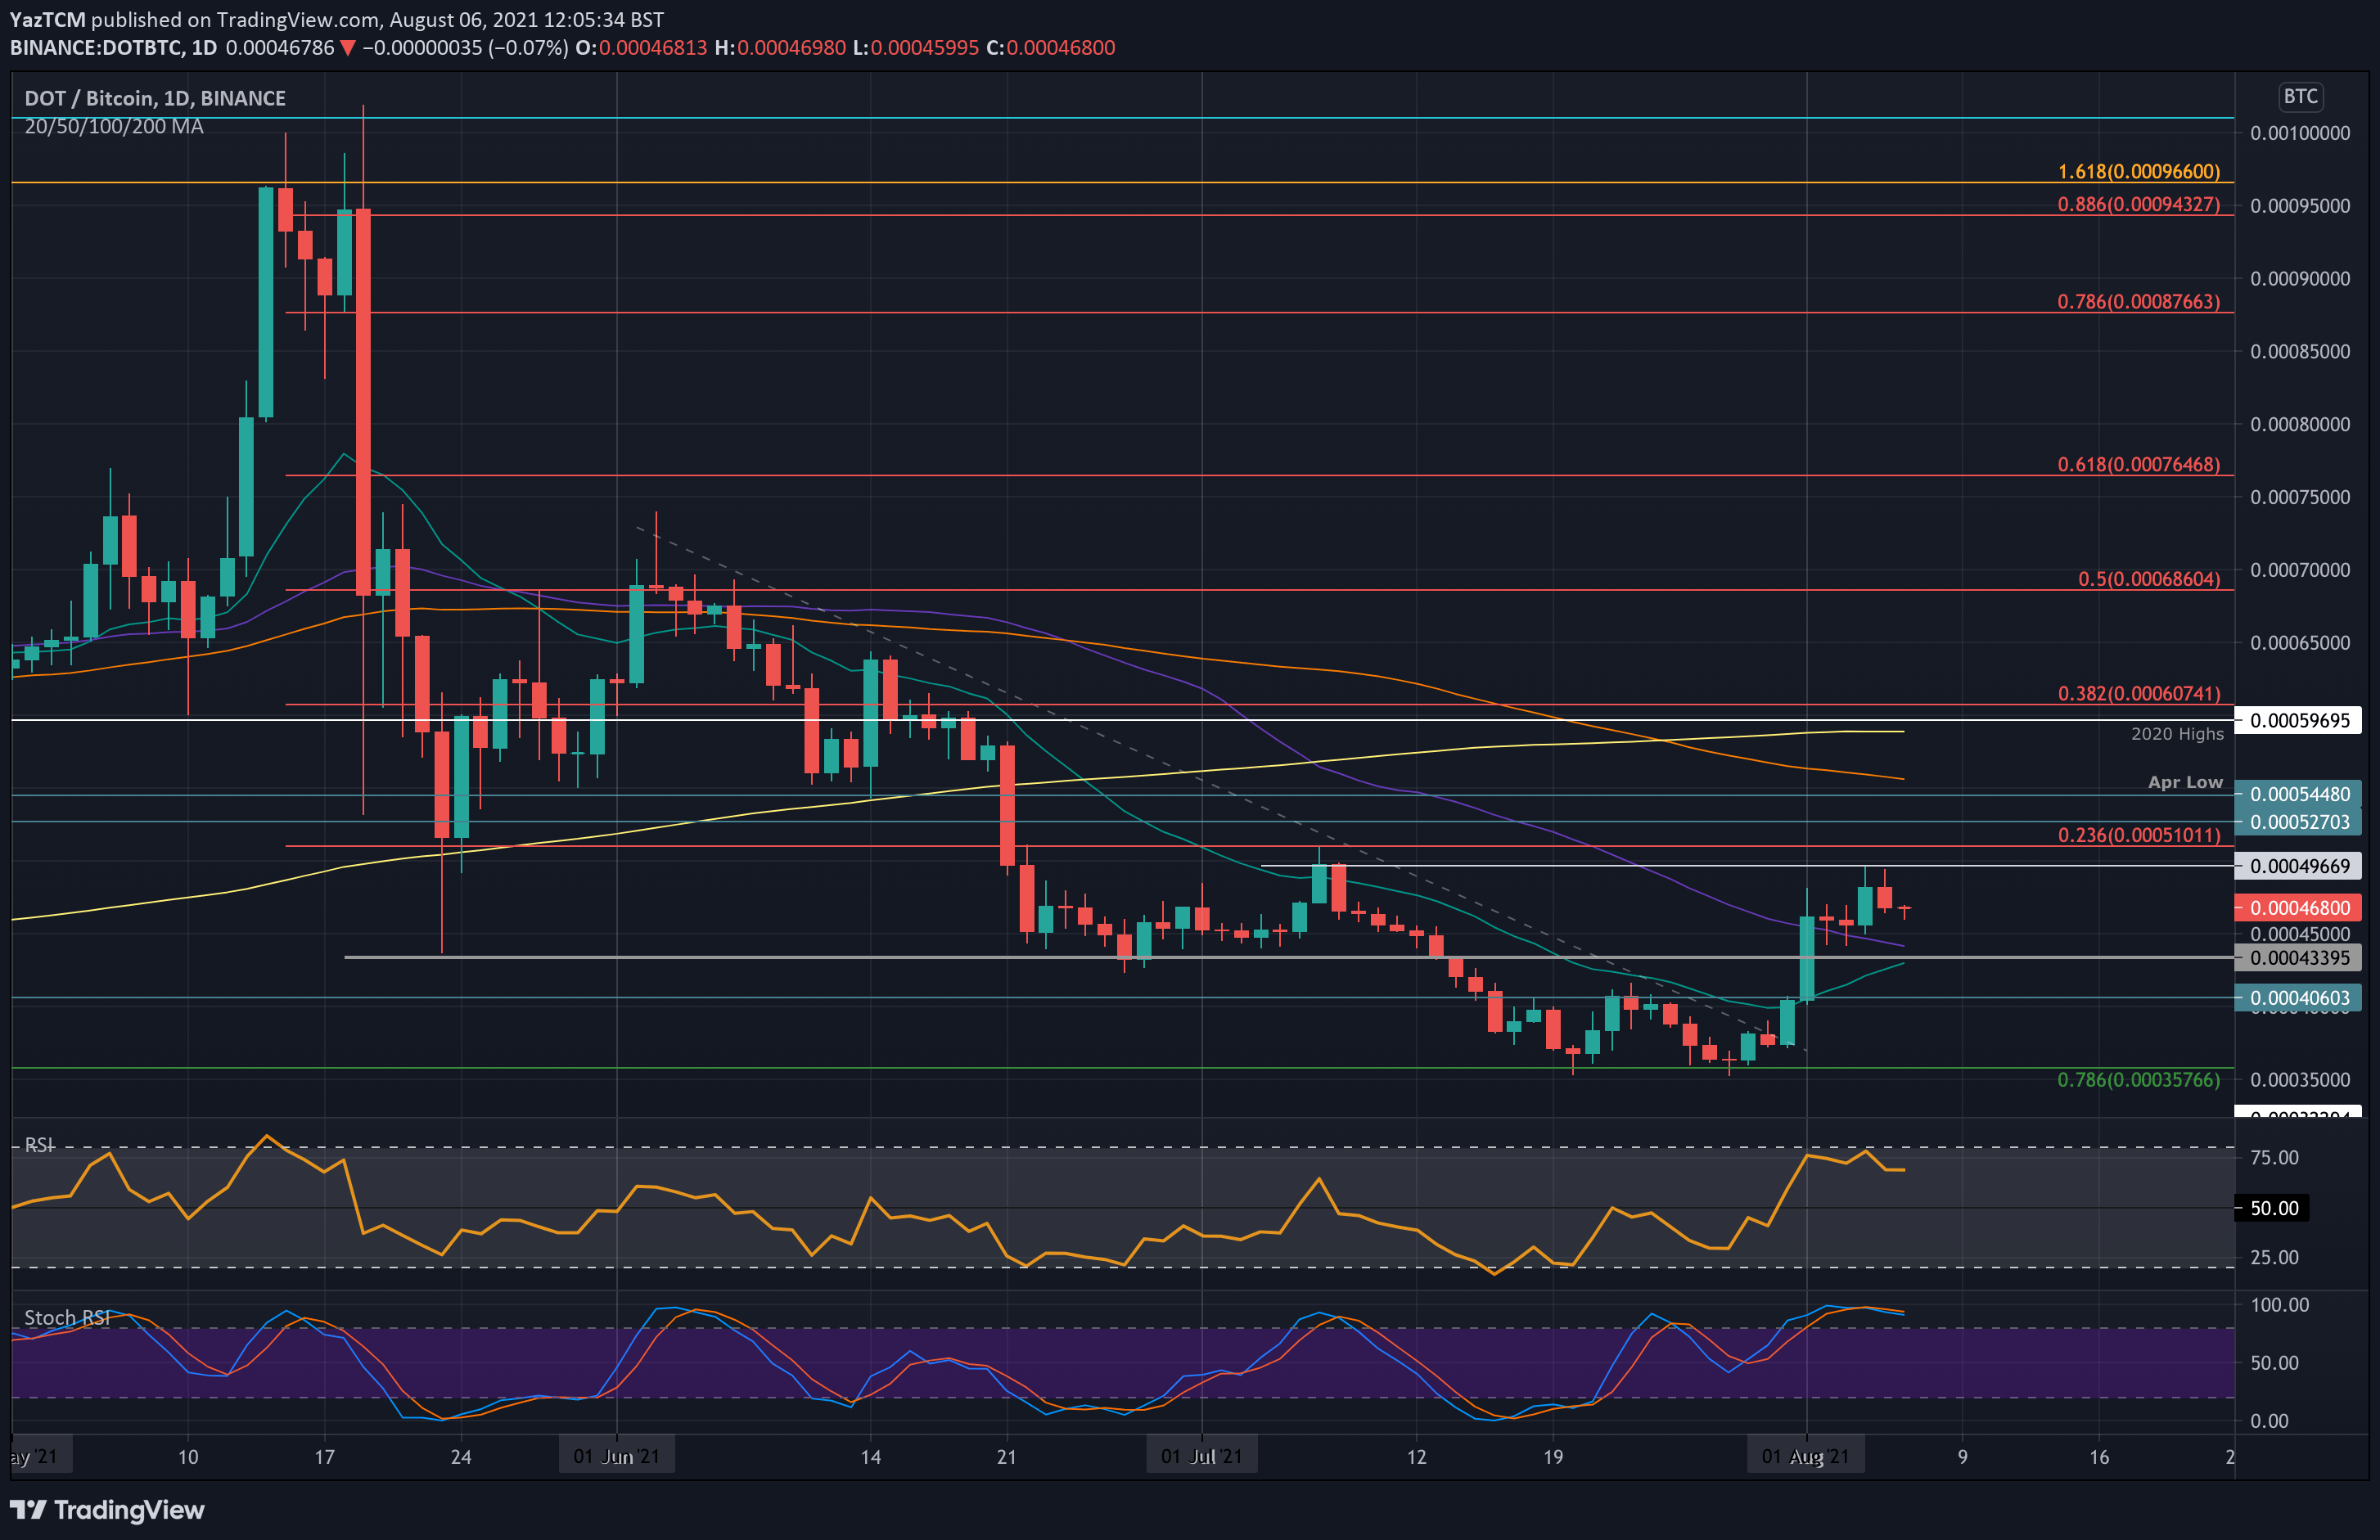
DOT is also performing well against BTC as it re-tests the July high-day closing price at 48,700 SAT this week. The coin pushed above a long-term descending trend line last Friday after rebounding from 35,700 SAT support earlier last week.
From there, DOT surged above the 20-day MA and the 50-day MA over the weekend and slowly ground higher throughout the week until hitting the 49.700 SAT resistance yesterday. It has since dropped slightly as it trades around 46,800 SAT.
Moving forward, the first support lies at 45,000 SAT (50-day MA). This is followed by 43,400 SAT (20-day MA), 40,600 SAT, and 37,700 SAT (.786 Fib).
On the other side, the first strong resistance lies at 49,700 SAT. This is followed by the July high at 51,000 SAT (bearish .236 Fib), 52,700 SAT, and 55,000 SAT (100-day MA). Added resistance lies at 59,500 SAT (200-day MA).
Chainlink
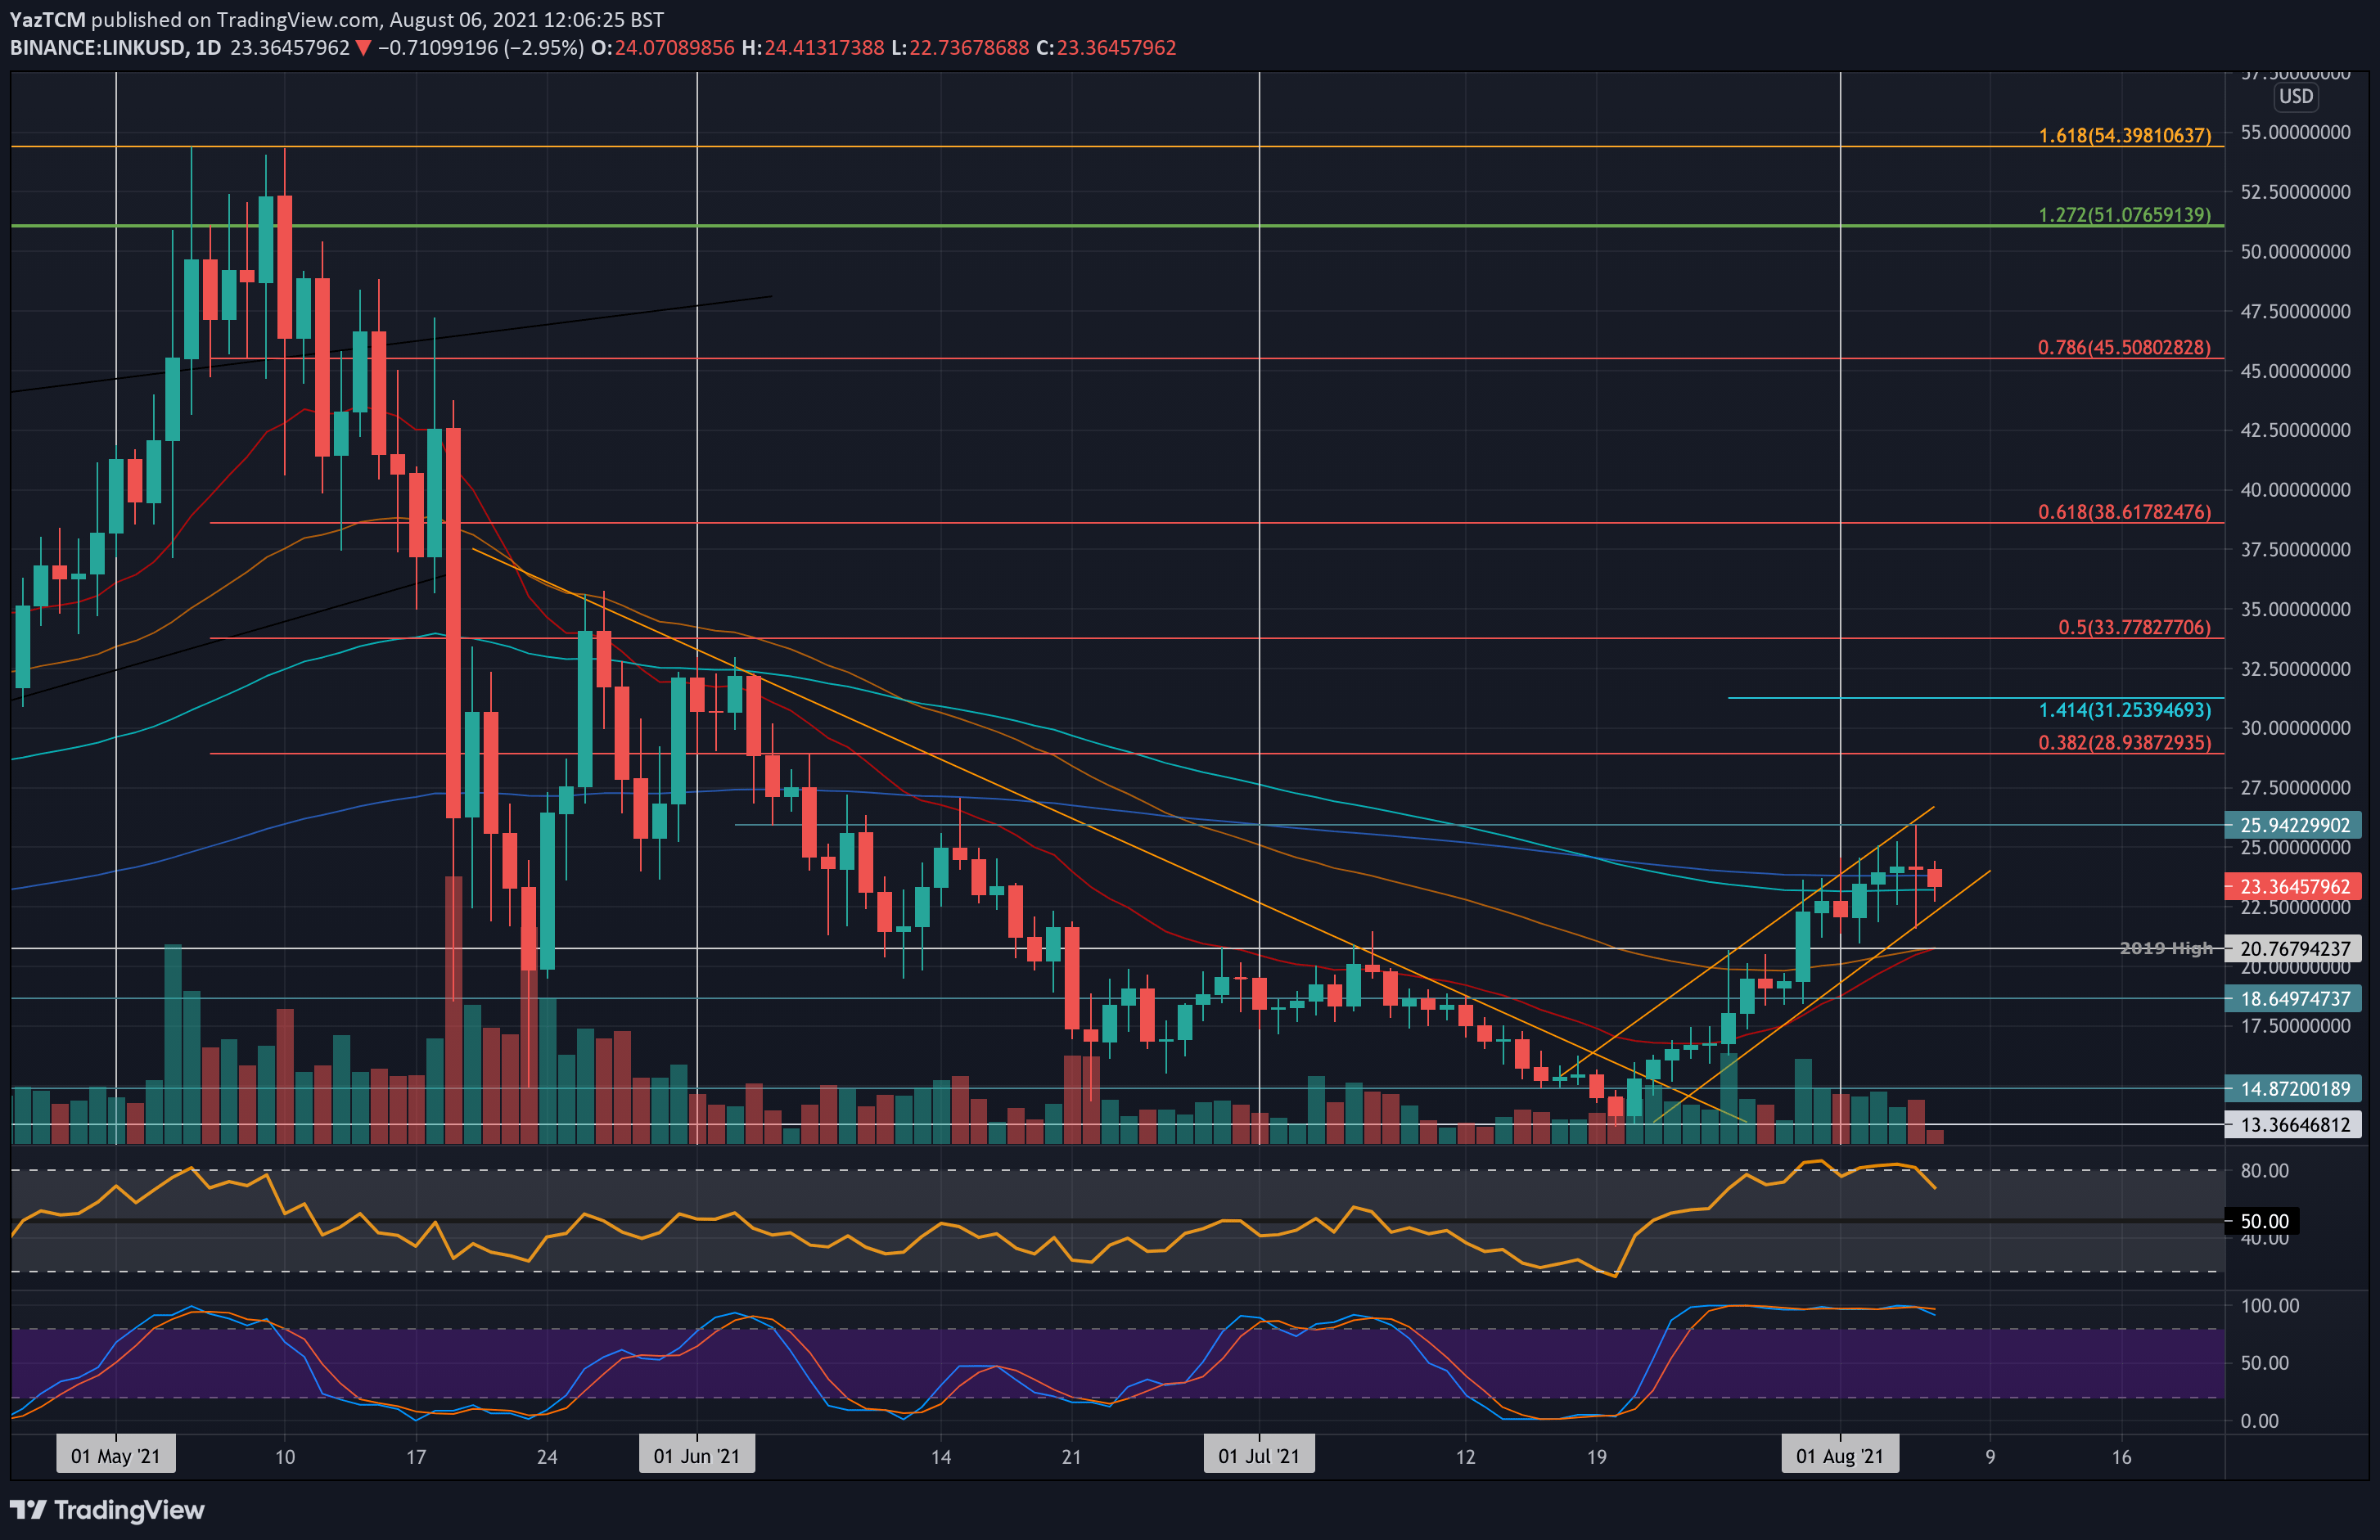
LINK also saw a solid 20% price hike this week as the coin tests $25.95 resistance. It has been trading inside an ascending price channel since rebounding from $13.36 earlier in July. On Monday, LINK surged above the 20-day MA and broke the 200-day MA on Tuesday.
From there, it spiked higher yesterday to test the $25.95 resistance at the upper angle of the price channel. It has since dropped lower from there but is using the 20-day MA as support.
Looking ahead, if the bears break the 20-day MA, the first support lies at $22.50 (lower angle of the price channel). This is followed by $20.75 (2019 high (100-day MA), $20, and $18.65.
On the other side, the first resistance lies at $25. This is followed by $26 (upper angle of the price channel), $28.90 (Bearish .382 Fib), $30, and $31.25 (1.414 Fib Extension).
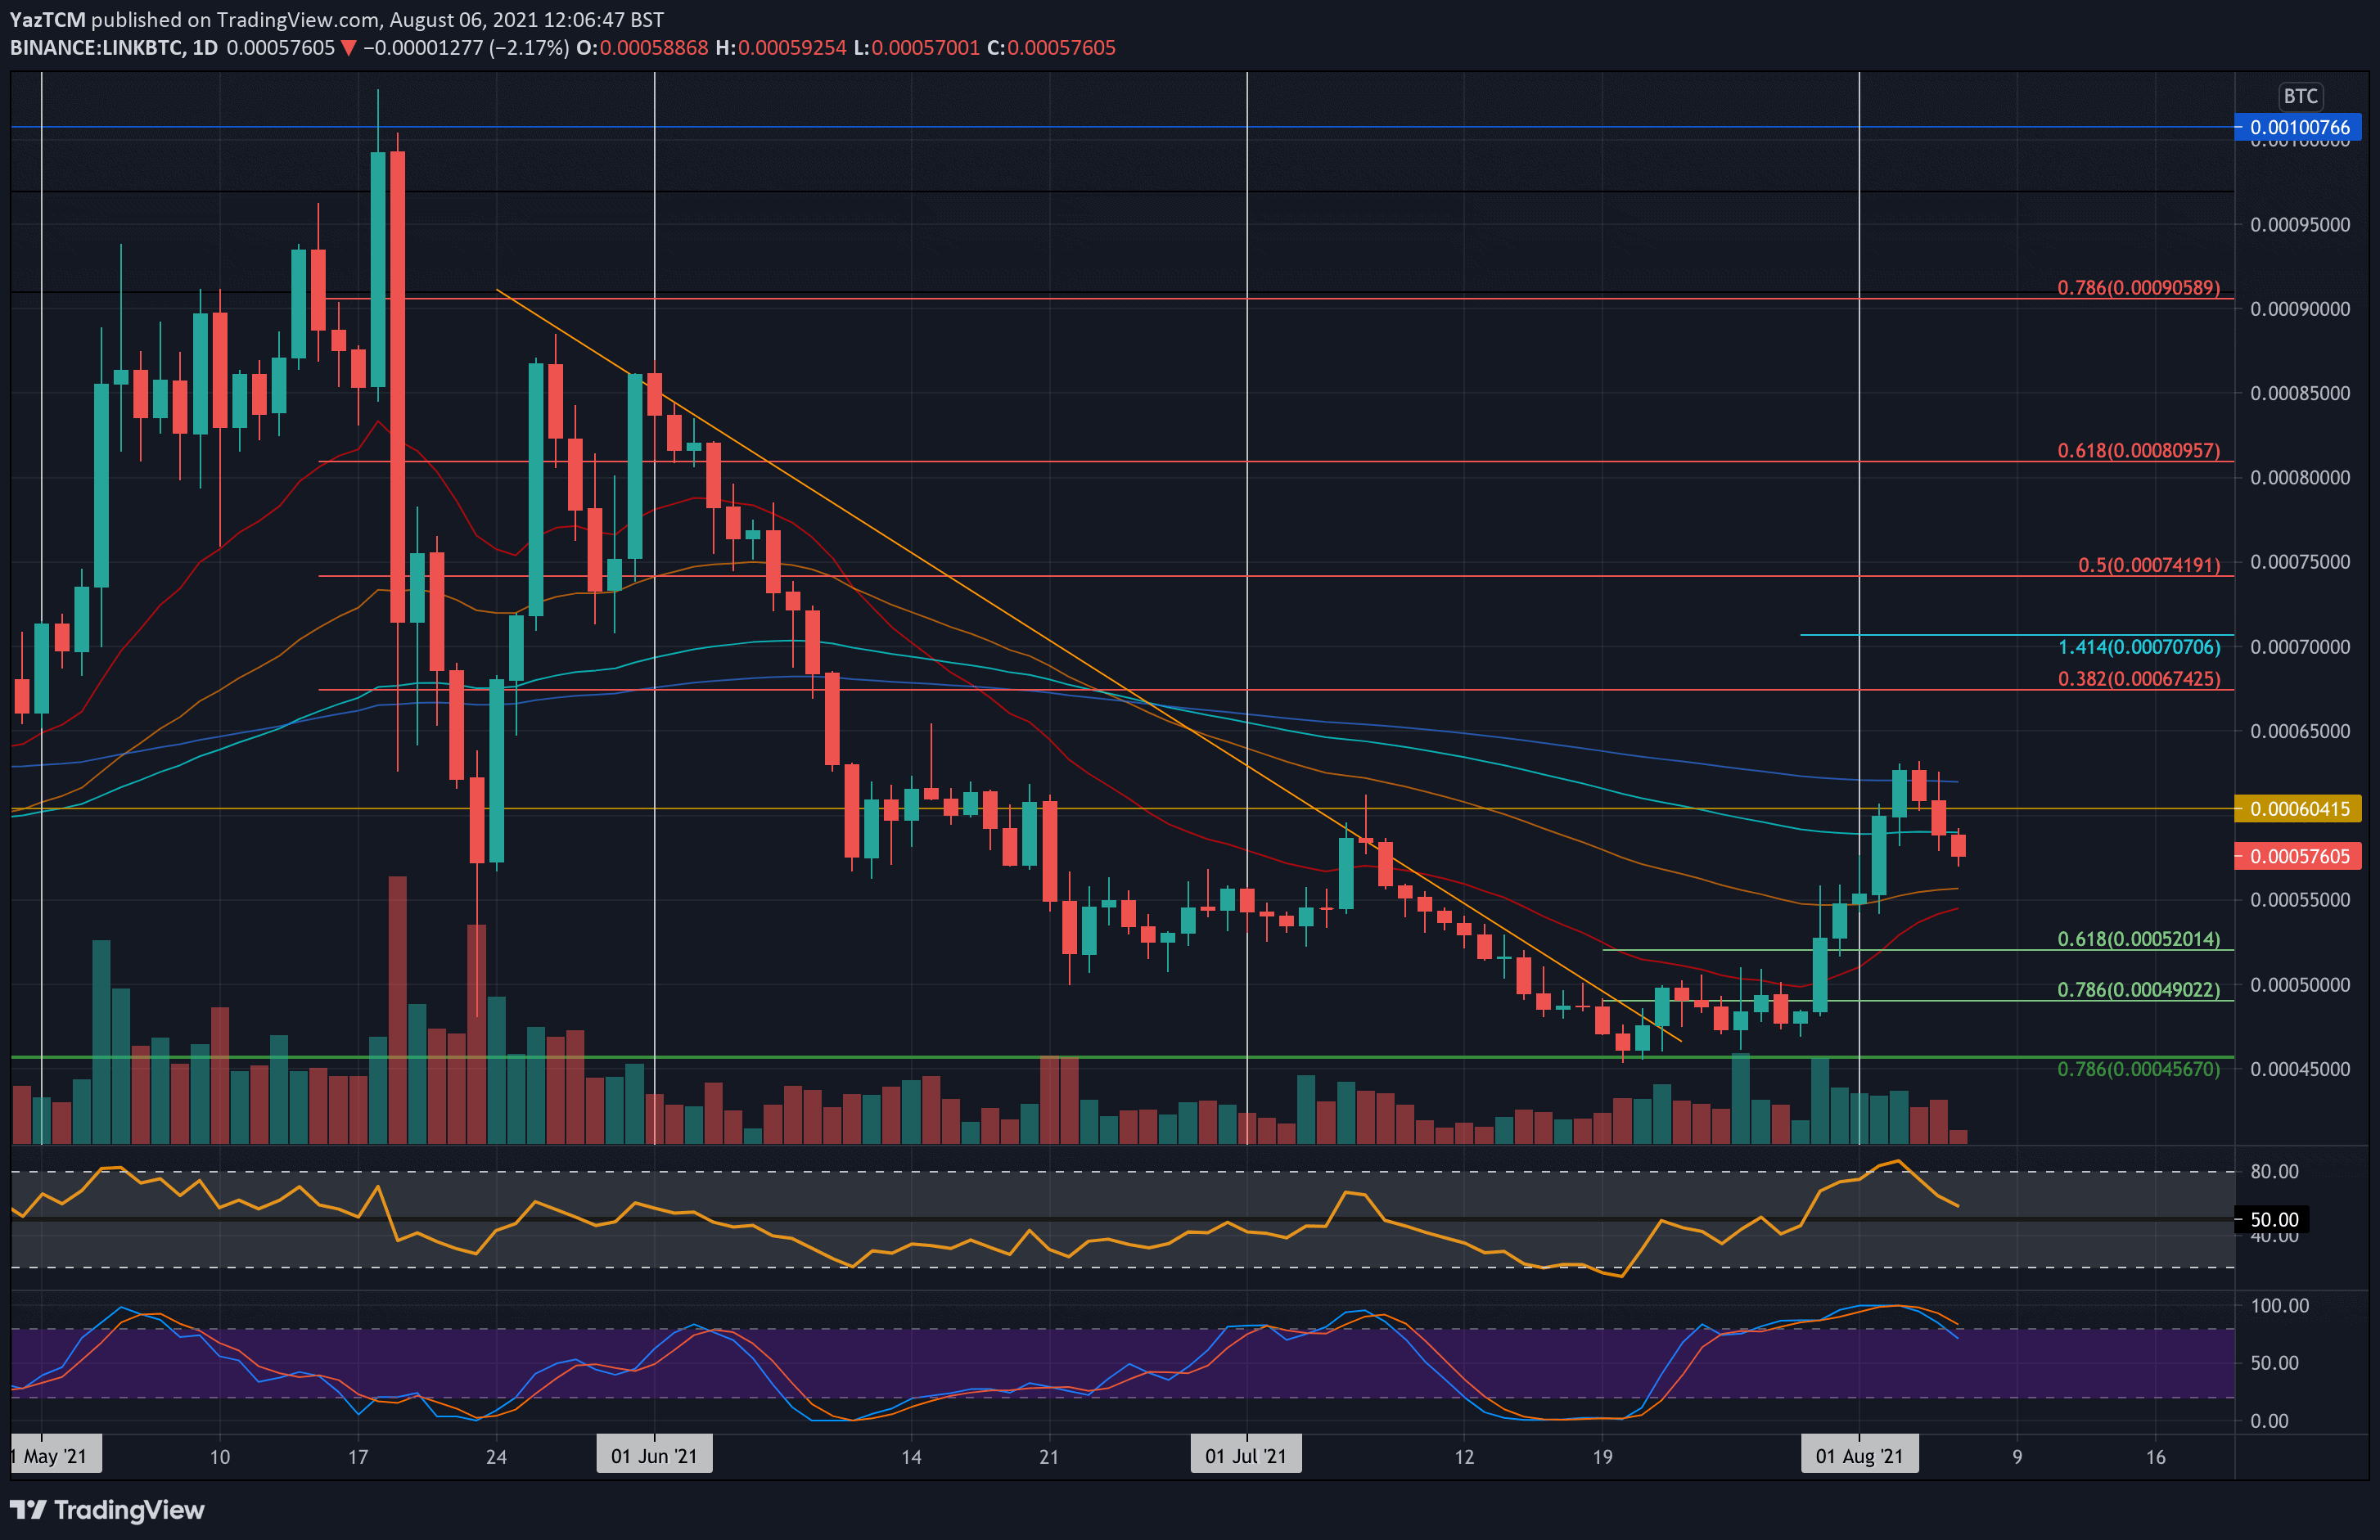
Against BTC, LUNK pushed higher frim 52,000 SAT last Friday and broke above the 50-day MA). From there, it moved upward during the week to reach as high as 63,200 SAT on Wednesday.
Unfortunately, it has rolled over since there and ended up breaking beneath the 20-day MA today as it sits around 57,500 SAT.
Looking ahead, the first support lies around 55,000 SAT (50-day MA). This is followed by 52,000 SAT (.618 Fib), 50,000 SAT, and 45,670 SAT (July support).
Alternatively, the first resistance lies at 59,000 SAT (20-day MA). This is followed by 60,500 SAT, 63,200 SAT (this week’s high), and 65,000 SAT. Added resistance is found at 67,425 SAT (bearish .382 Fib) and 70,000 SAT (1.414 Fib Extension).