Unfortunately, we had another week of particularly choppy price action where most of the cryptocurrencies are trading in the red. Ethereum is an exception with a rather insignificant gain over the past seven days. Bitcoin Bitcoin is down a total of 4.7% over the past week as it breaks back beneath ,000. The cryptocurrency started the week looking promising after double bottoming around ,600. From there, it started to surge higher as it formed a short-term rising price channel, best seen on the 4-hour chart. It continued to rise in this channel until hitting resistance at around ,500 (20-day MA). It rolled over from there on Tuesday and went on to break beneath the channel. On Wednesday, BTC continued beneath ,000 and broke the neckline of a short-term head and
Topics:
Yaz Sheikh considers the following as important: Binance Coin (BNB) Price, Bitcoin (BTC) Price, BNBBTC, bnbusd, BTC Analysis, BTCEUR, BTCGBP, btcusd, btcusdt, DOTBTC, DOTUSD, DOTUSDT, ETH Analysis, ETHBTC, Ethereum (ETH) Price, ethusd, Polkadot (DOT) Price, Price Analysis, Ripple (XRP) Price, XRP Analysis, xrpbtc, xrpusd
This could be interesting, too:
Chayanika Deka writes XRP, SOL, and ADA Inclusion in US Crypto Reserve Pushes Traders on Edge
Chayanika Deka writes Why Arthur Hayes Is Bullish on Bitcoin Under Trump’s Economic Strategy
Mandy Williams writes Why the Bitcoin Market Is Stuck—and the Key Metric That Could Change It: CryptoQuant CEO
Wayne Jones writes Metaplanet Acquires 156 BTC, Bringing Total Holdings to 2,391
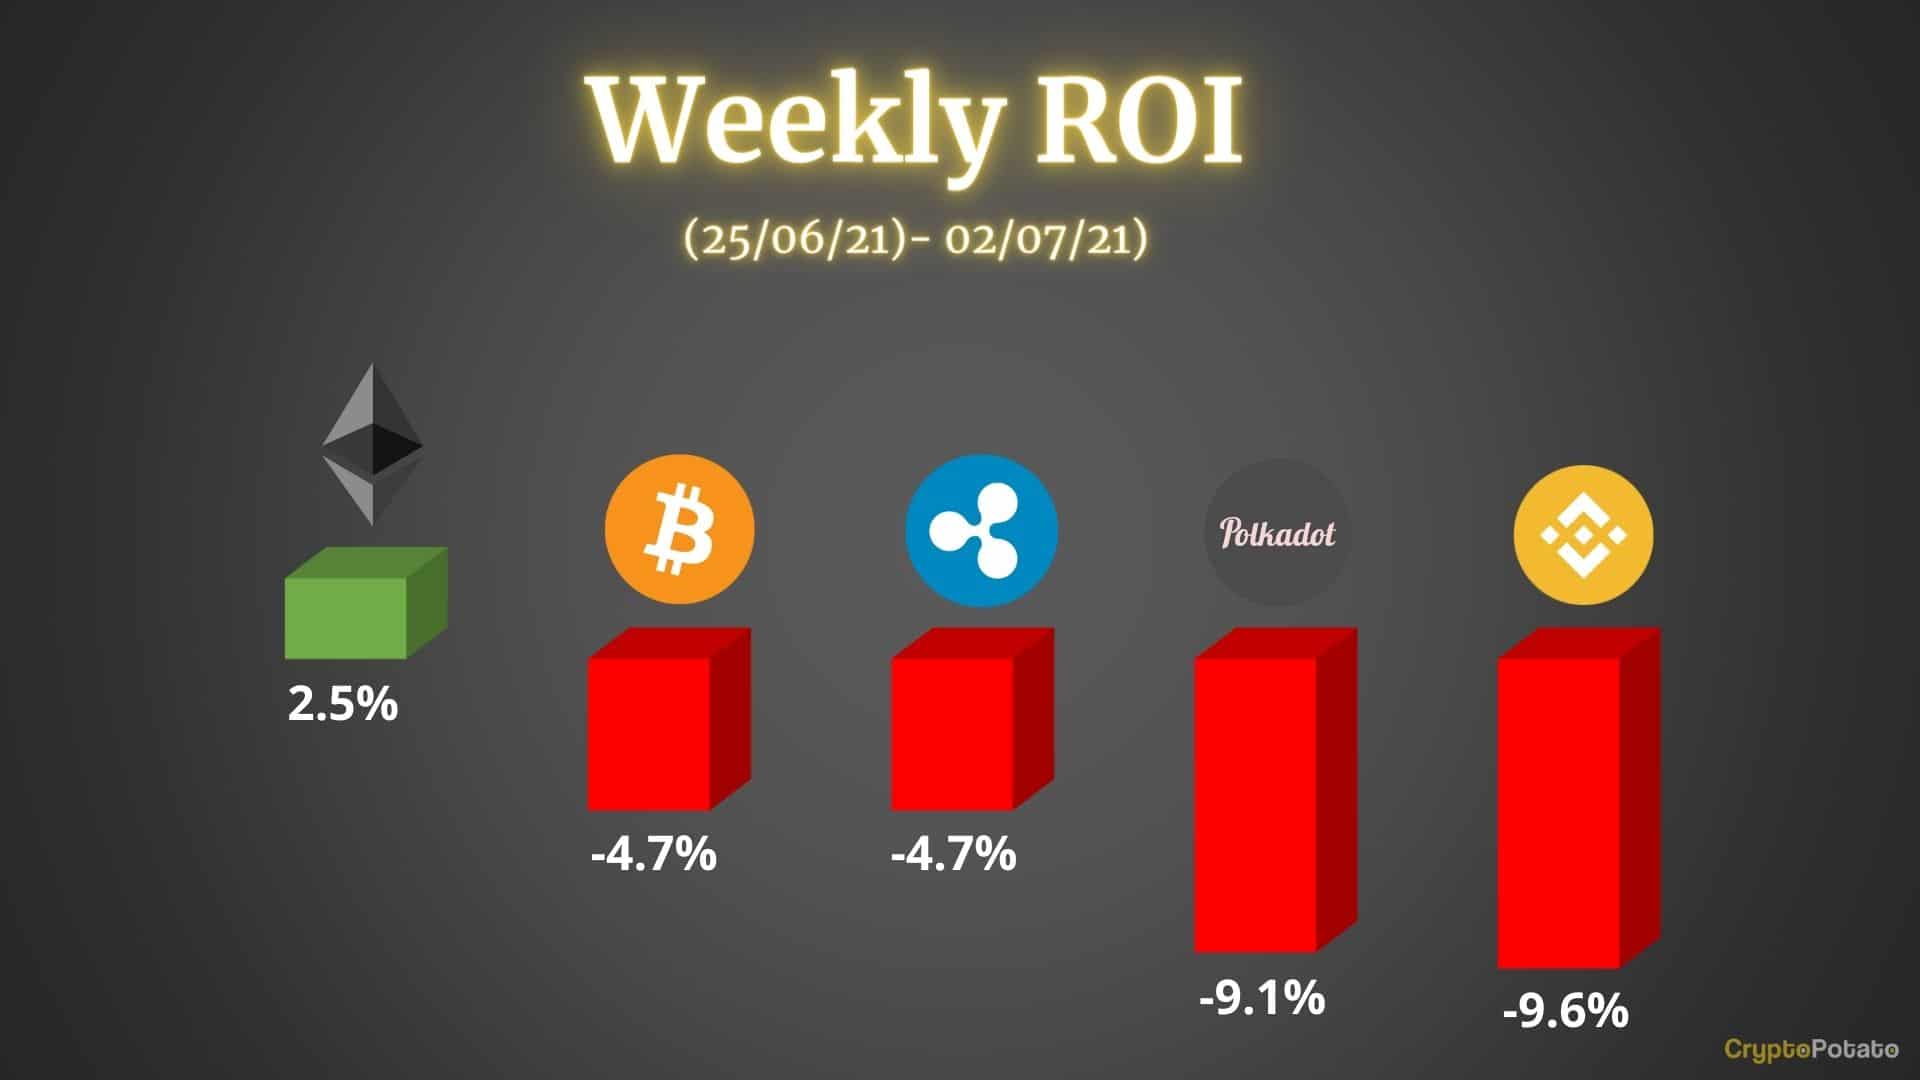
Unfortunately, we had another week of particularly choppy price action where most of the cryptocurrencies are trading in the red. Ethereum is an exception with a rather insignificant gain over the past seven days.
Bitcoin
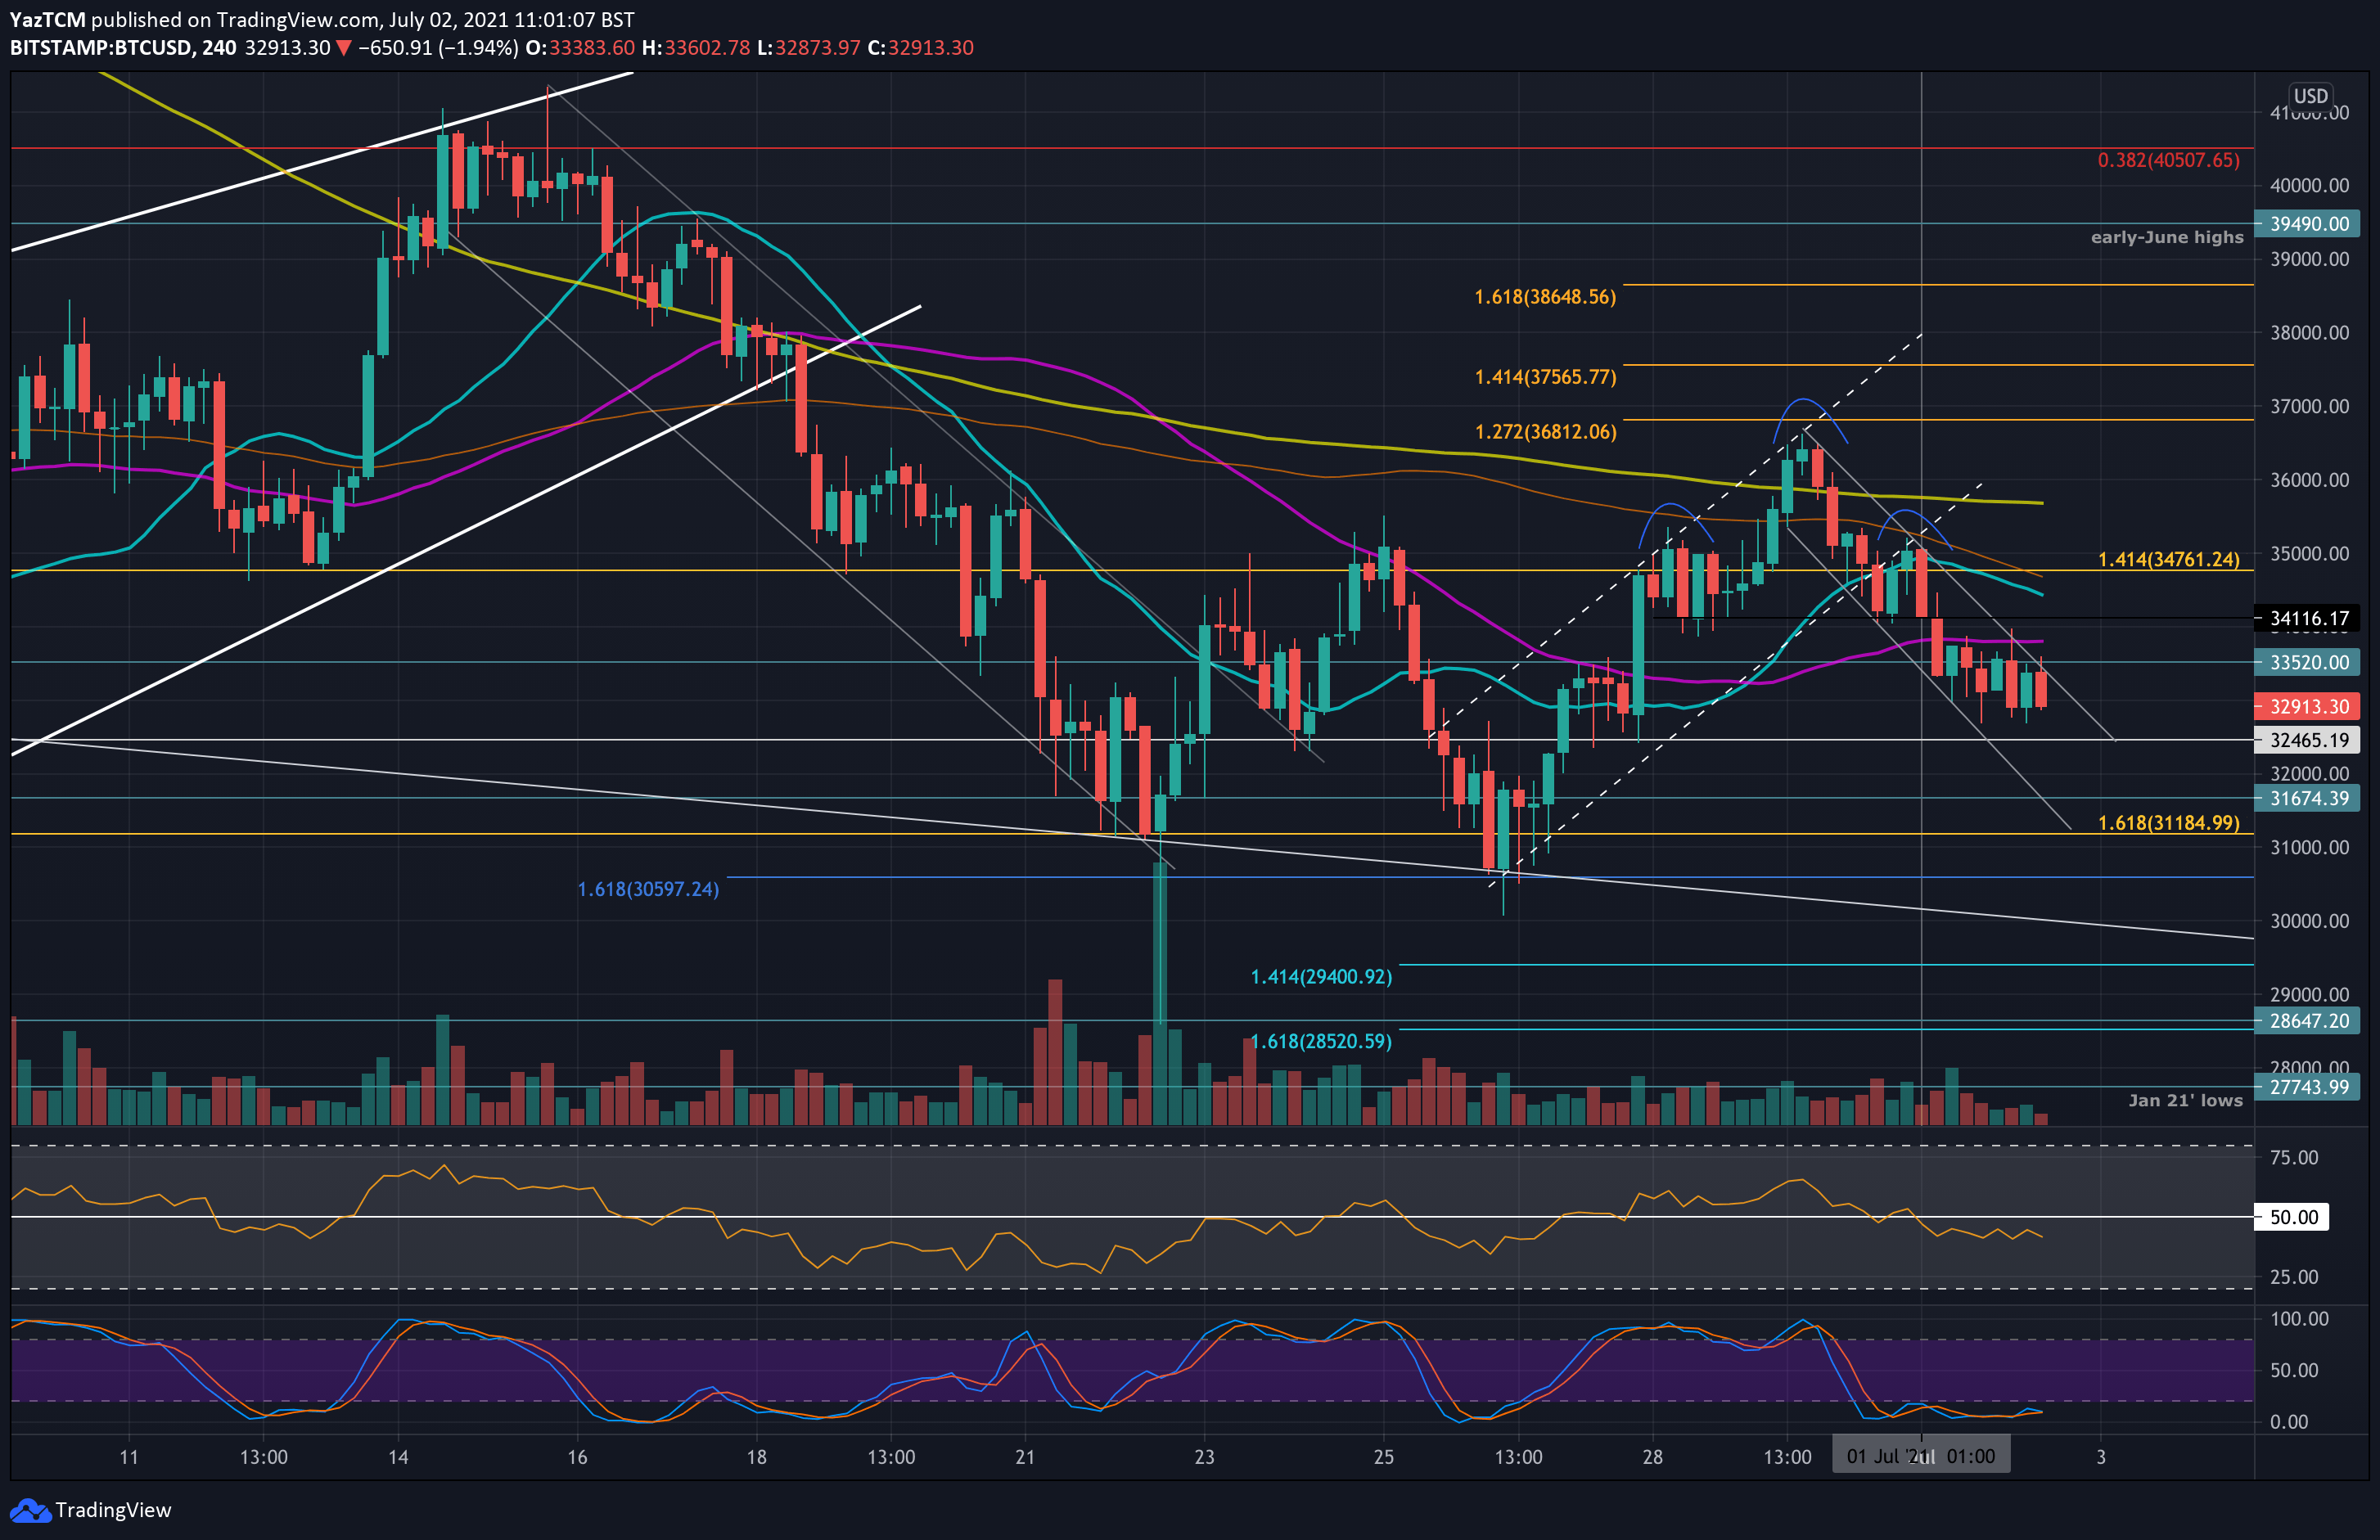
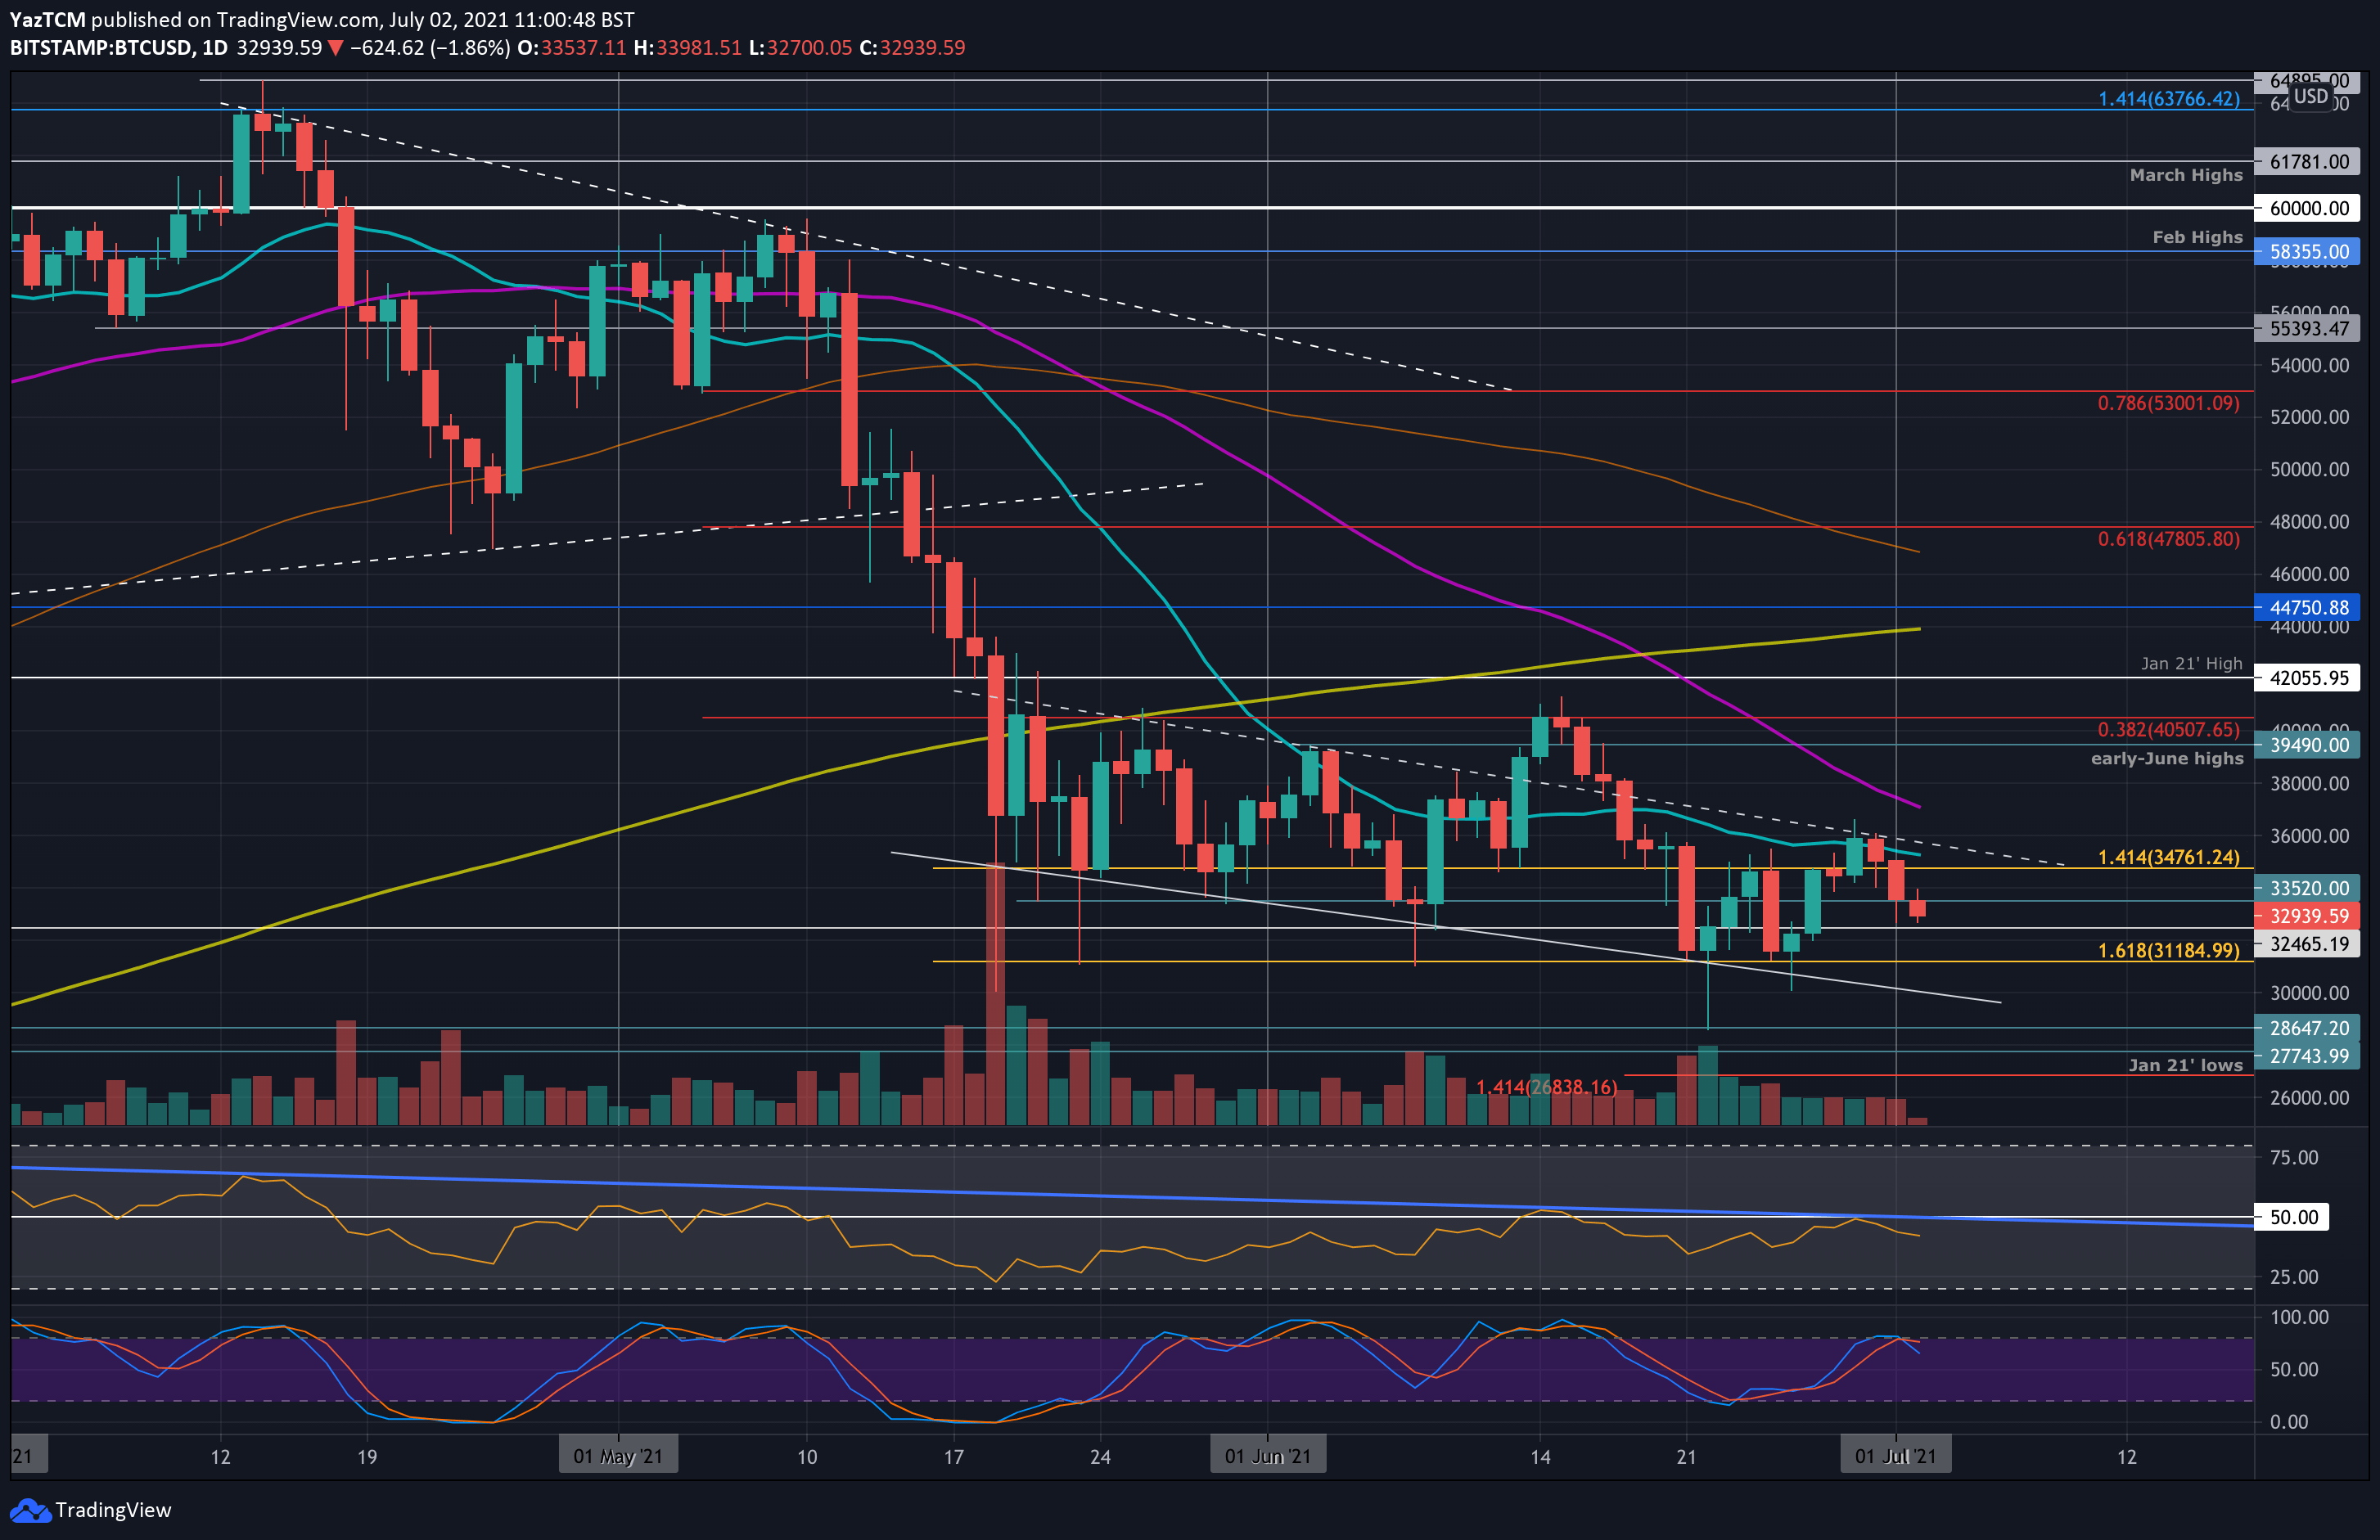
Bitcoin is down a total of 4.7% over the past week as it breaks back beneath $33,000. The cryptocurrency started the week looking promising after double bottoming around $31,600. From there, it started to surge higher as it formed a short-term rising price channel, best seen on the 4-hour chart.
It continued to rise in this channel until hitting resistance at around $36,500 (20-day MA). It rolled over from there on Tuesday and went on to break beneath the channel. On Wednesday, BTC continued beneath $34,000 and broke the neckline of a short-term head and shoulders pattern.
The cryptocurrency is now trading in a short-term falling price channel as it broke beneath $33,000 again today.
Looking ahead, the first support lies at $32,465. This is followed by $41,675, $41,185, $30,600, and $30,000.
On the other side, the first resistance lies at $33,520 (upper boundary of the channel). This is followed by $34,000, $35,000 (20-day MA), $37,130 (50-day MA), and $39,500 (early-June highs).
Ethereum
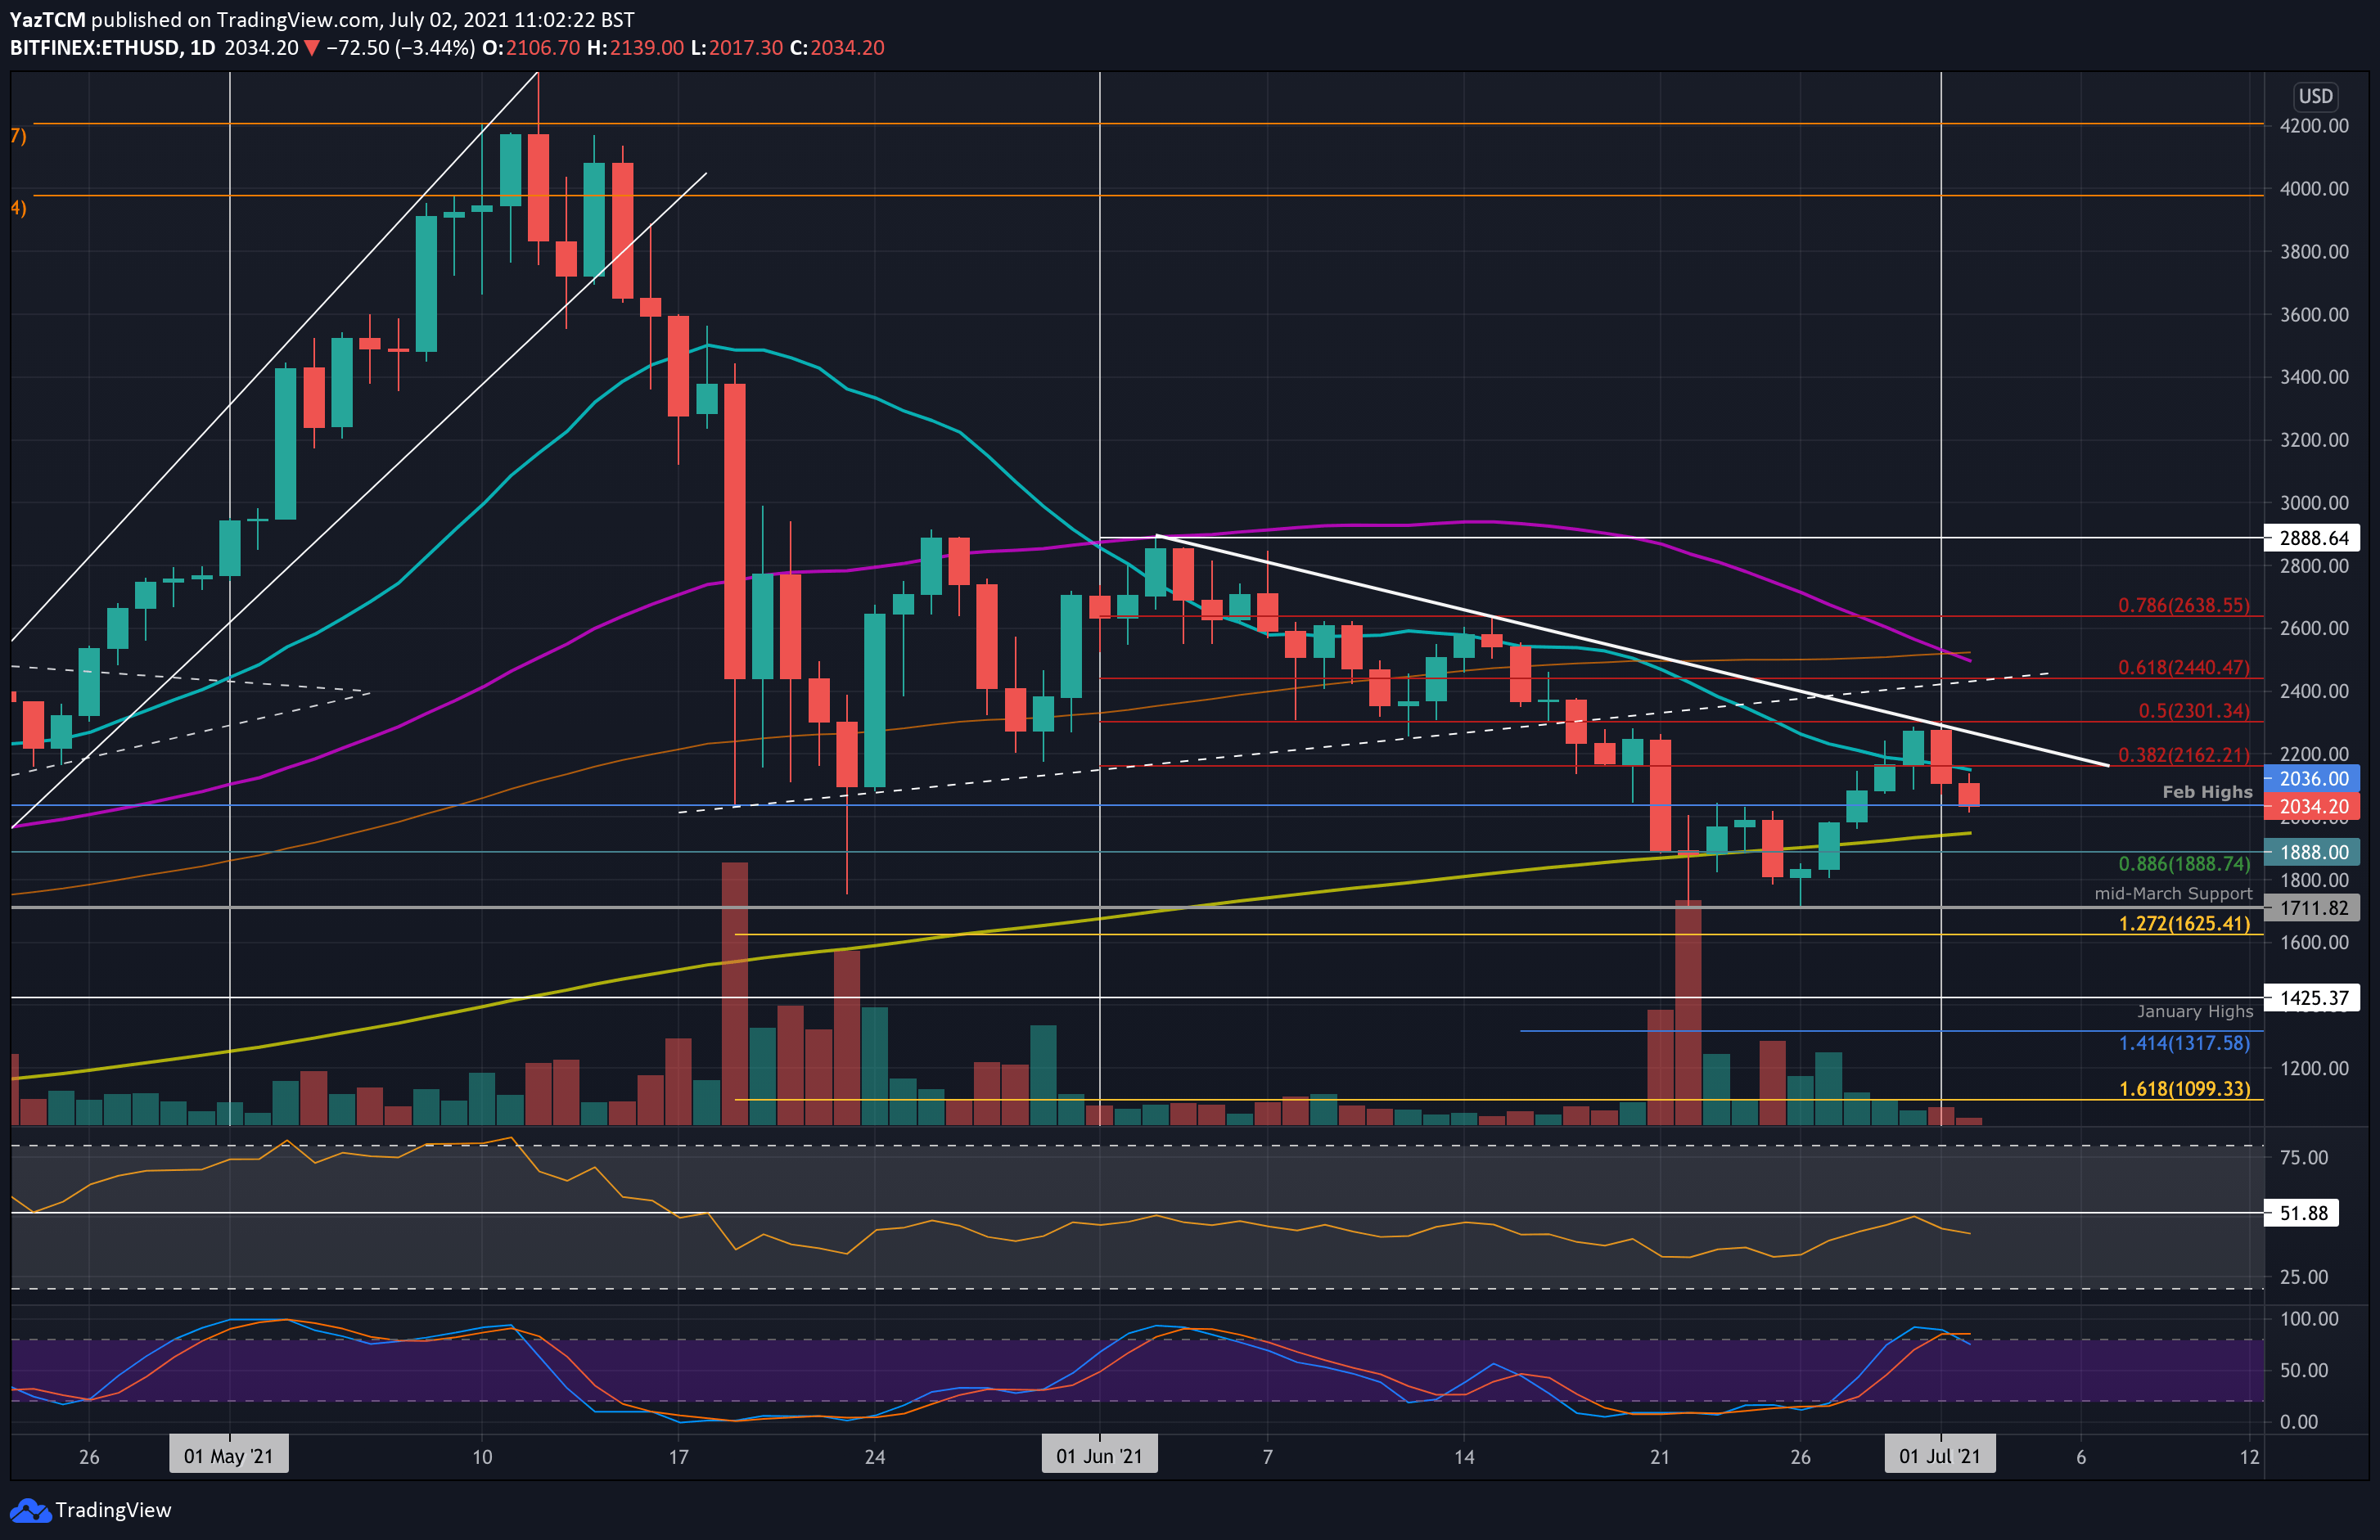
Ethereum saw a small 2.5% price hike this week as it continues to trade above $2000. The cryptocurrency had also produced a double bottom formation over the weekend after rebounding from support at $1710 (mid-march support).
From there, it started to climb and it broke above $2000 to reach as high as $2300 (bearish .5 Fib Retracement) yesterday.
Unfortunately, it could not break this resistance and ended up rolling over to the current $2036 support, provided by the Feb 2020 highs.
Looking ahead, the first strong support lies at $2000. This is followed by $1900 (200-day MA), $1888 (.886 Fib), $1800, and $1710 (mid-March support). Added support lies at $1625 (downside 1.272 Fib Extension) and $1500.
On the other side, the first resistance lies at $2162 (bearish .382 Fib & 20-day MA). This is followed by $2300 (bearish .5 Fib), $2440 (bearish .618 Fib), $2525 (100-day MA), and $2600.
ETH is showing strength against BTC after breaking above a falling price channel this week. It found support at 0.056 BTC and broke the channel on Monday. After that, ETH continued above 0.06 BTC and reached as high as 0.065 BTC.
It has since rolled over from there and is now trading around 0.0617 BTC.
Looking ahead, the first support lies at 0.061 BTC (20-day MA). This is followed by 0.06 BTC, 0.036 BTC (100-day MA), and 0.0541 BTC (April 2018 low).
On the other side, the first strong resistance lies at 0.065 BTC. This is followed by 0.066 BTC (bearish .5 Fib & 50-day MA), 0.069 BTC (bearish .618 Fib), and 0.07 BTC.

Ripple
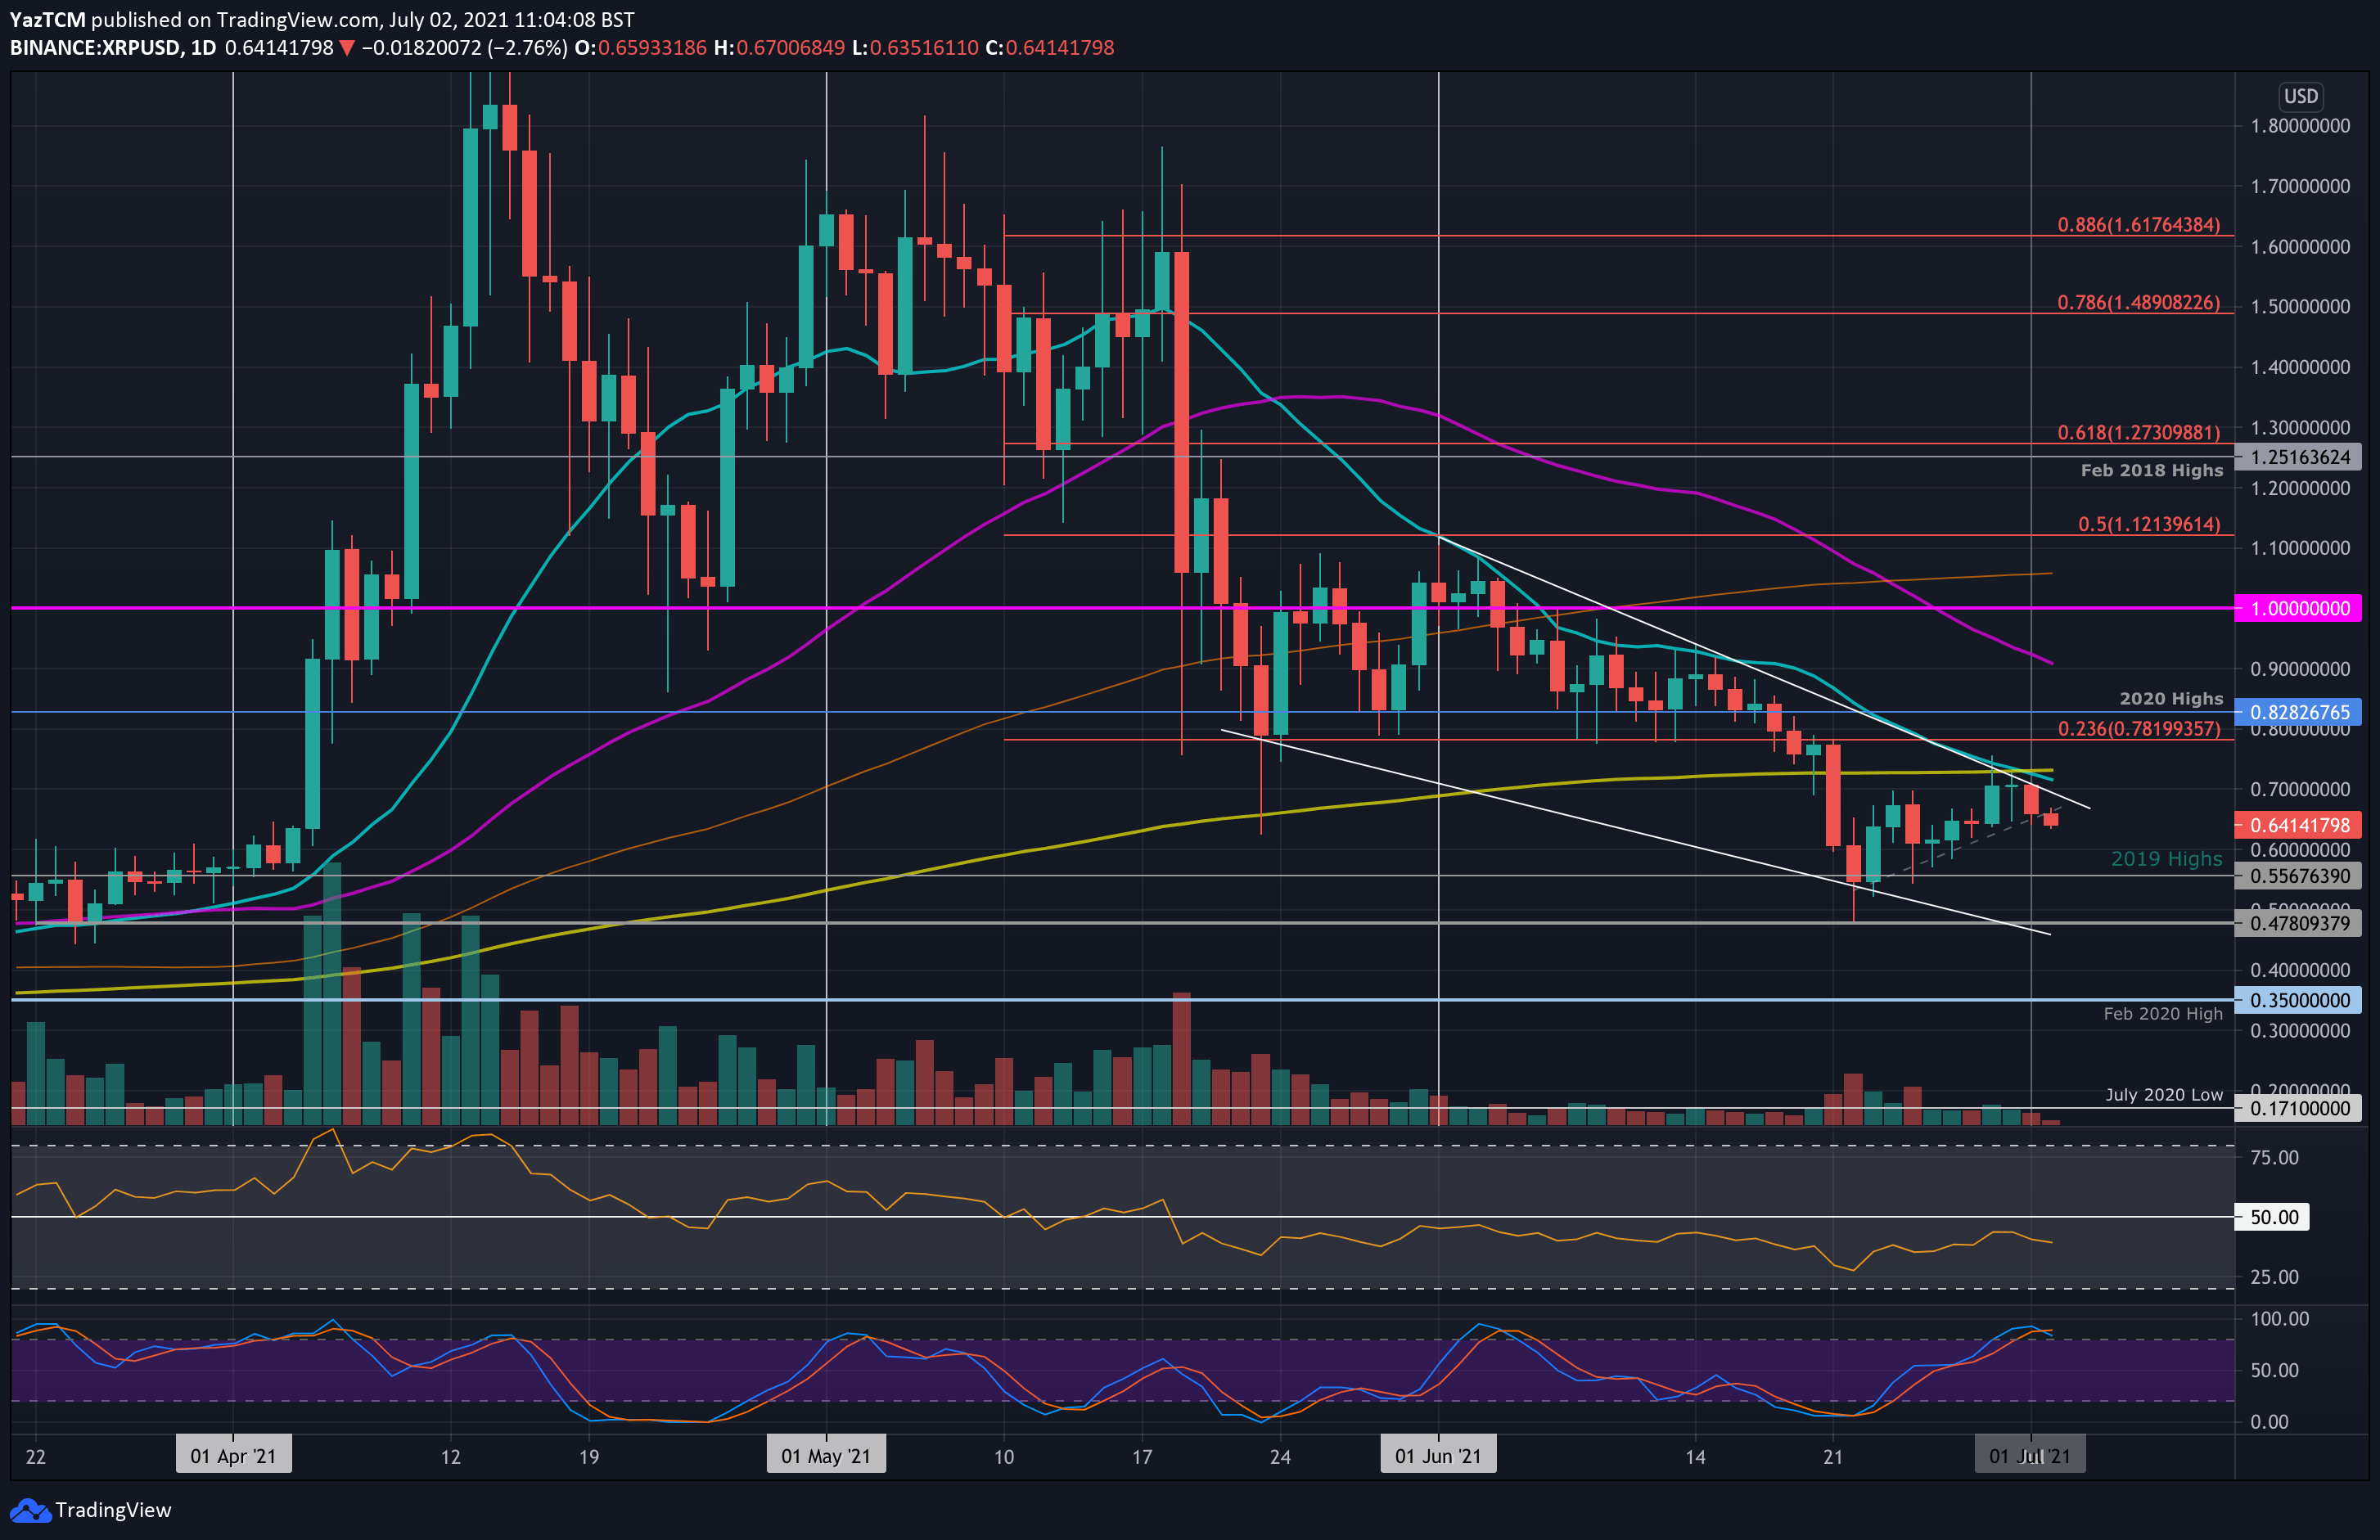
XRP dropped by almost 5% this week as it trades at $0.641. The cryptocurrency has been trading inside a falling wedge pattern since the start of June and rebounded from support at $0.556 (2019 highs) over the weekend.
After that, XRP attempted to push higher but could not close a daily candle above $0.7. There, it struggled to break resistance at the upper angle of the falling wedge, which was further bolstered by the 200-day MA level. It since rolled over from there and is trading at $0.641.
Looking ahead, the first support lies at $0.6. This is followed by support at $0.556 (2019 highs), $0.5, and $0.478 (lower angle of the wedge).
On the other side, the first resistance lies at $0.7 (upper angle of the wedge). This is followed by $0.73 (200-day MA), $0.782 (bearish .236 Fib), and $0.8282 (2020 highs).
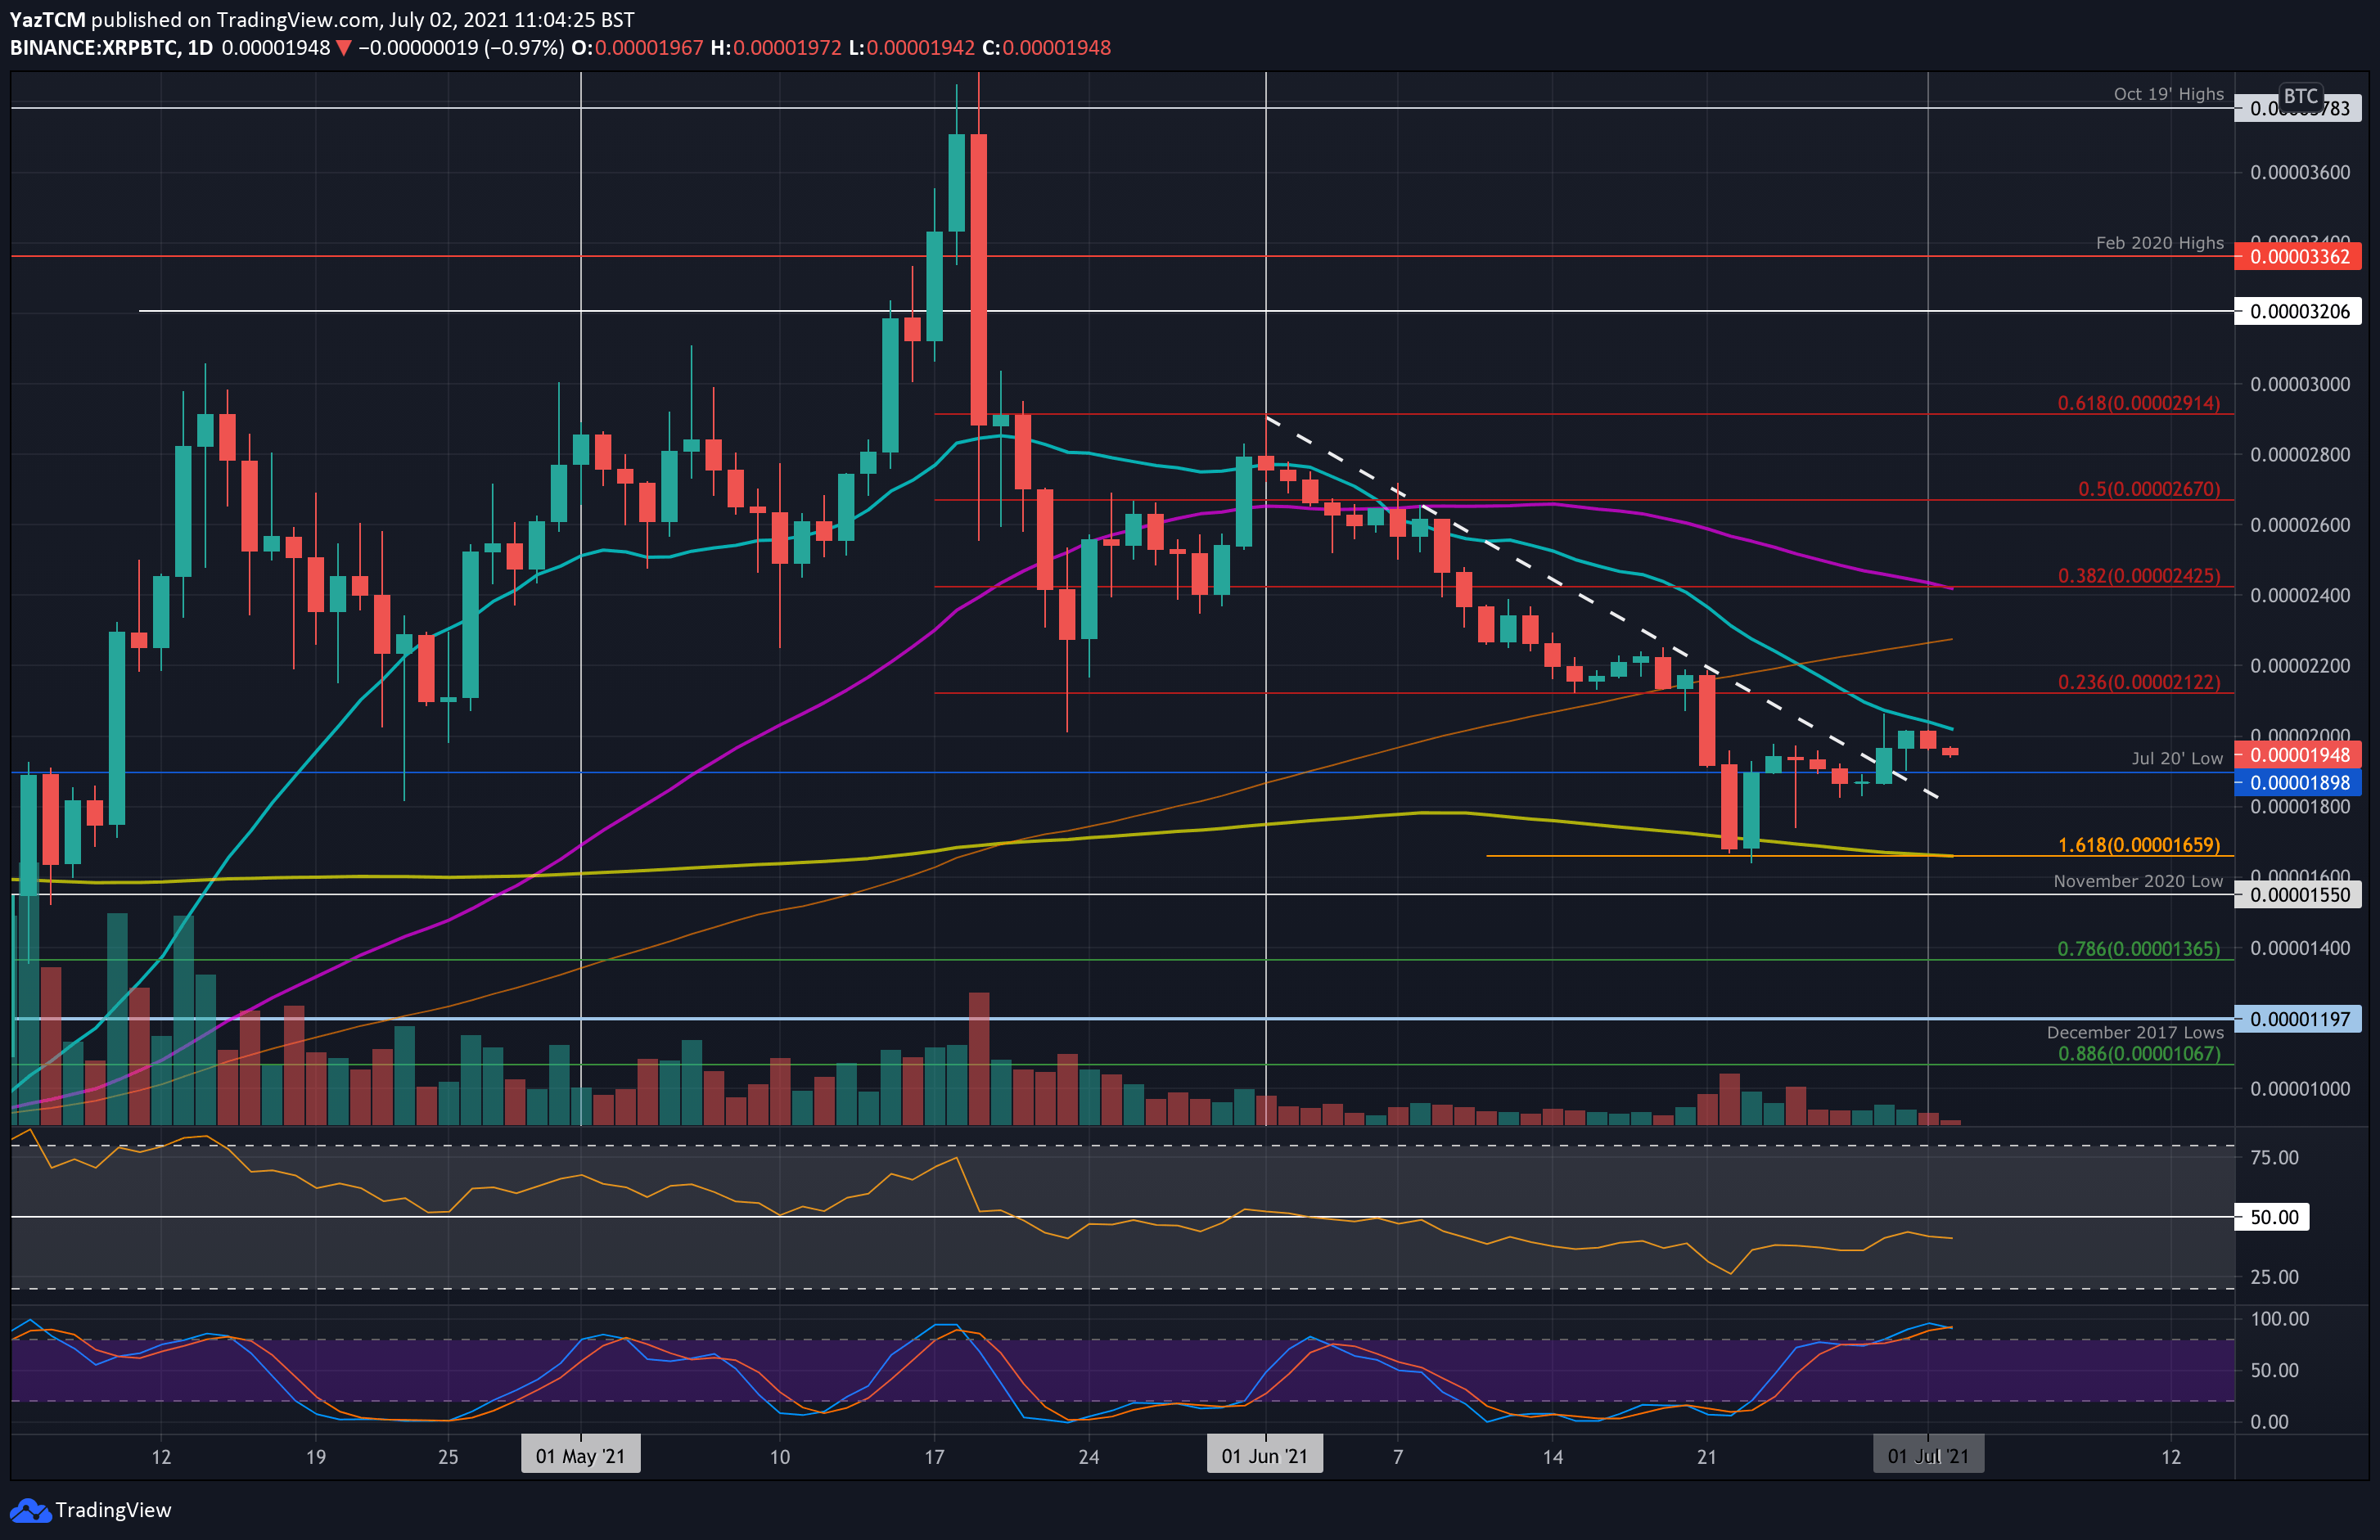
Against bitcoin, XRP pretty much moved sideways between 1900 SAT and 2000 SAT this week. It did spike above 2000 SAT but was quickly rejected by the 20-day MA at around 2100 SAT and could not close a daily candle above 2000 SAT.
It has since dropped slightly and is trading around 1950 SAT.
Looking ahead, the first support lies at 1900 SAT (July 2020 low). This is followed by 1800 SAT, 1660 SAT (downside 1.618 Fib Extension & 200-day MA0, and 1550 SAT (November 2020 low).
On the other side, the first resistance lies at 2000 SAT (20-day MA0. This is followed by 2122 SAT (bearish .236 Fib), 2300 SAT (100-day MA), and 2425 SAT (bearish .382 Fib & 50-day MA).
Binance Coin
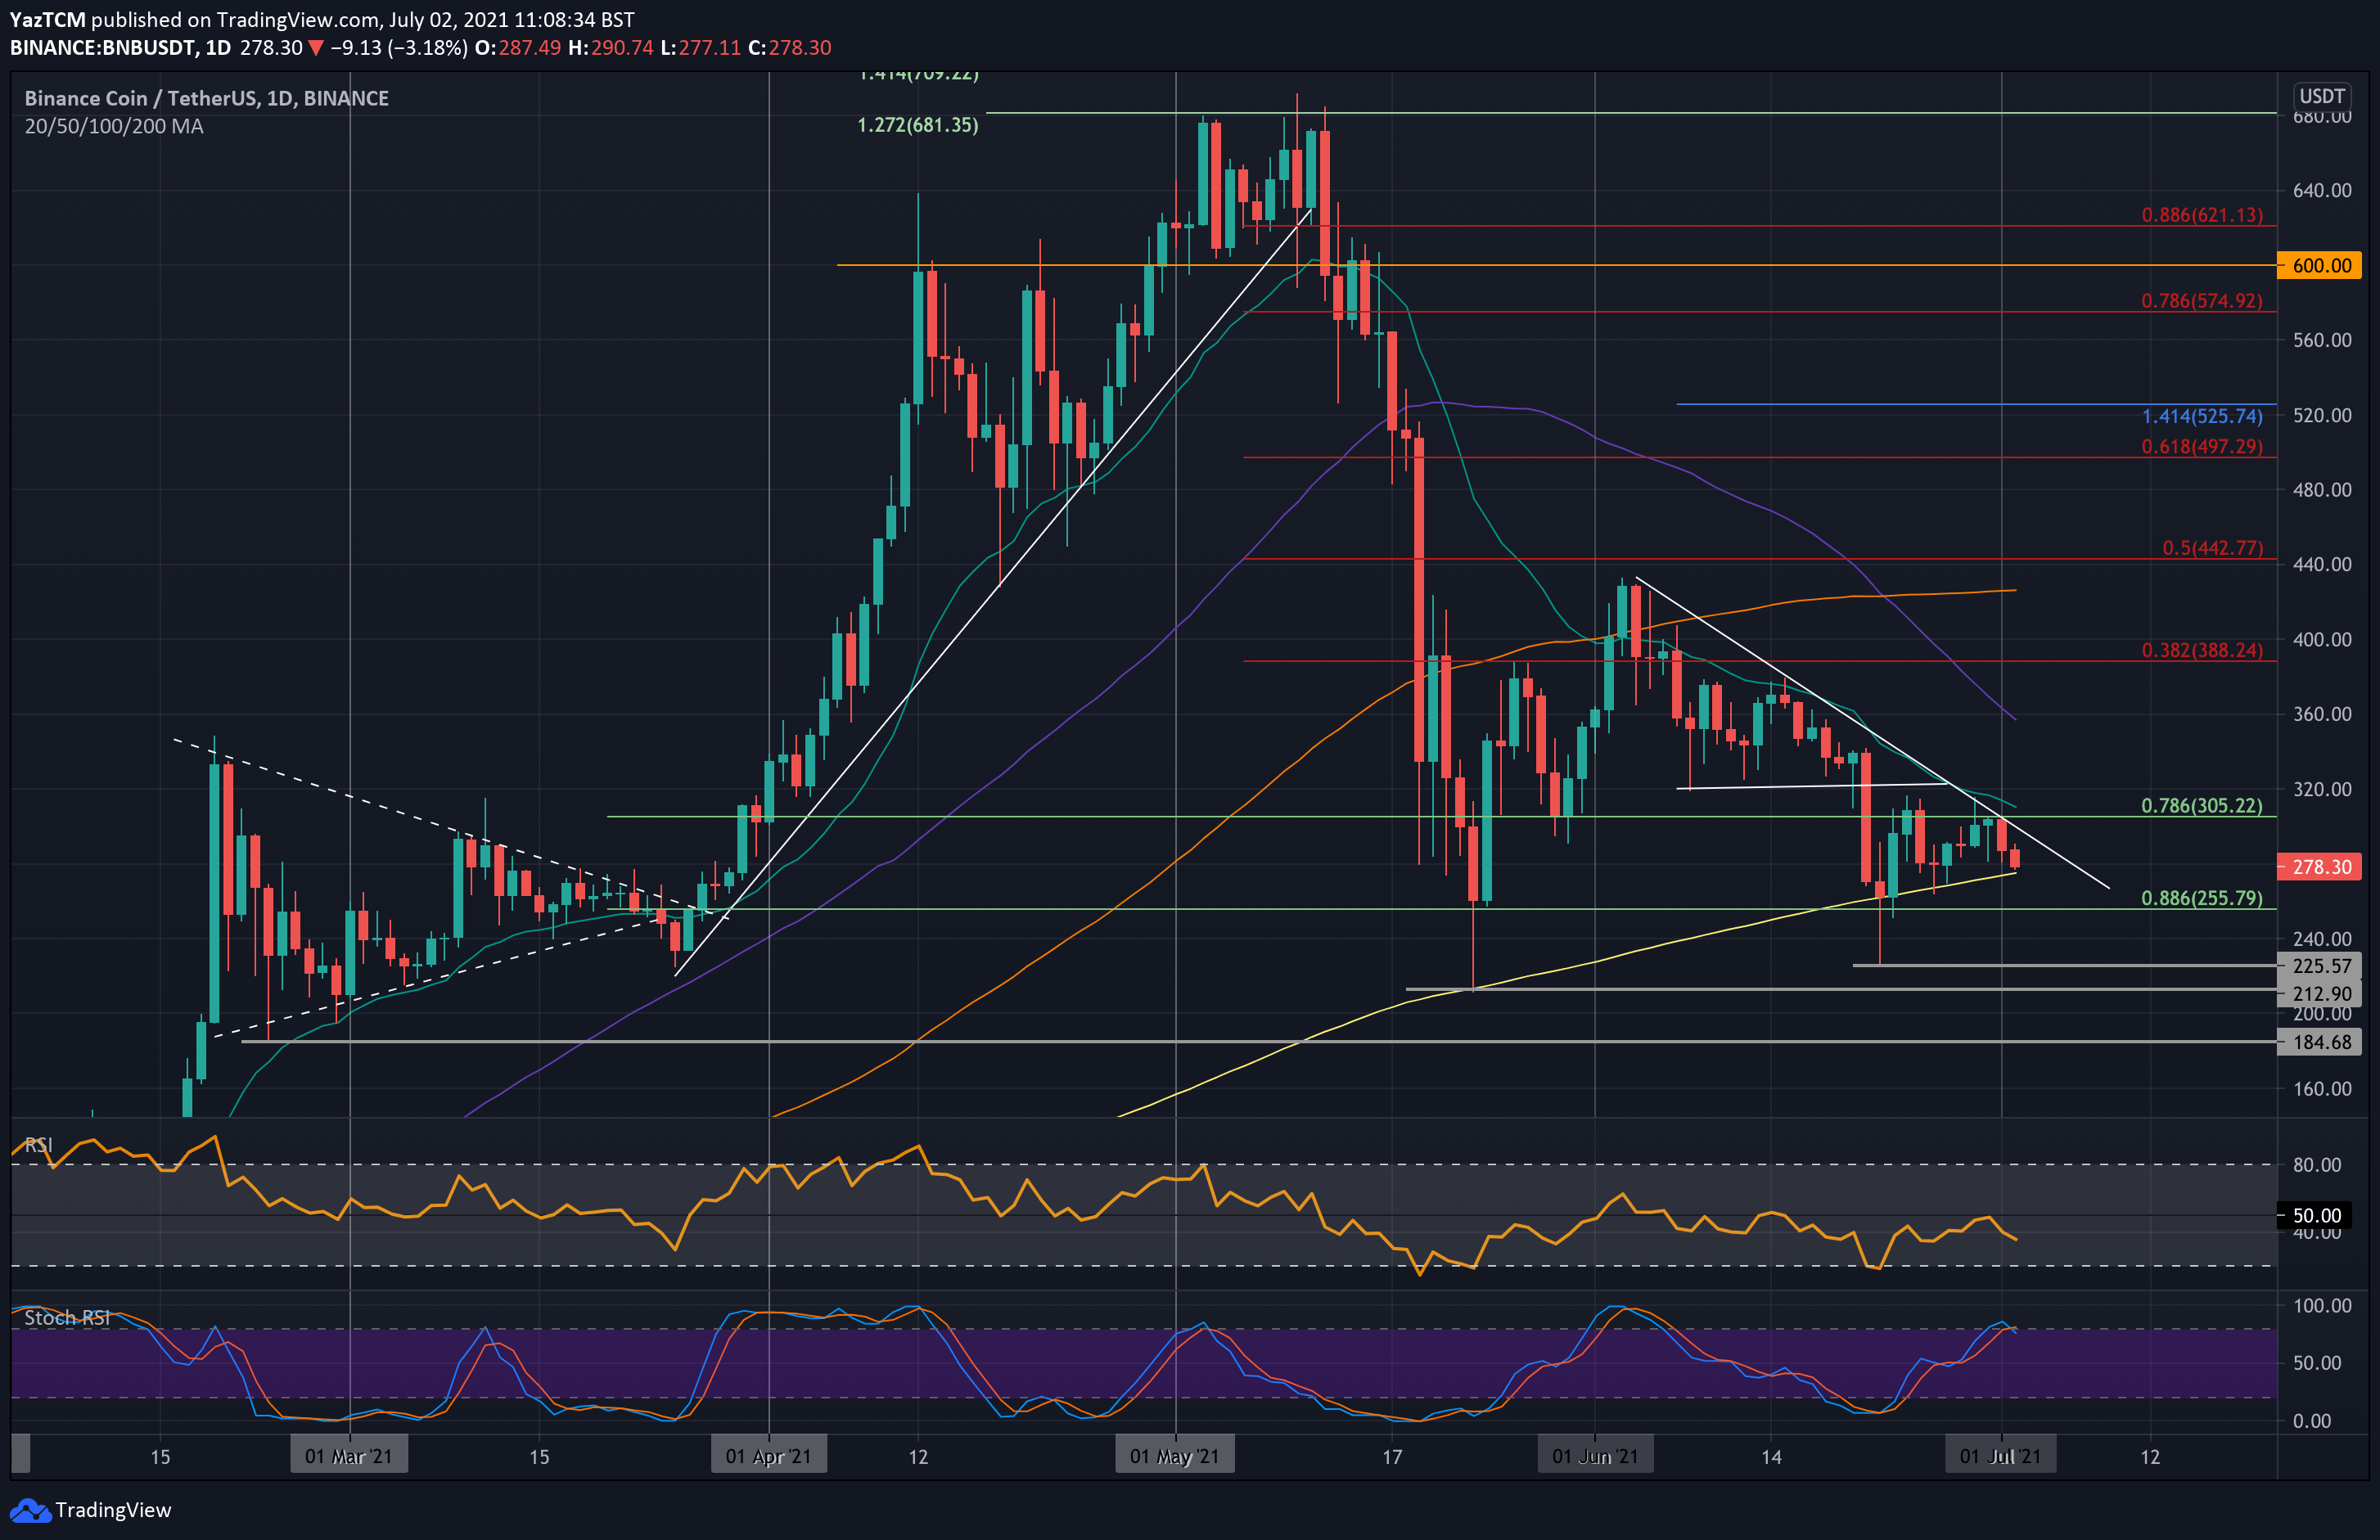
BNB is down by a sharp 9.6% this week and it fell back beneath $300. It was trading above $300 last week but fell into support at $280 over the weekend. It did rebound from $280 but failed to break resistance at $305 during the week as it could not overcome resistance at the June falling trend line.
Since reversing from this trend line, BNB is now trading at $278 near the 200-day MA level.
Looking ahead, beneath the 200-day MA the first support lies at $255.80 (.886 Fib). This is followed by $270, $225.60 (June lows), and $212.90 (May lows).
On the other side, the first strong resistance lies at the falling trend line, around $300. This is closely followed by resistance at $305, $320, and $360 (50-day MA).
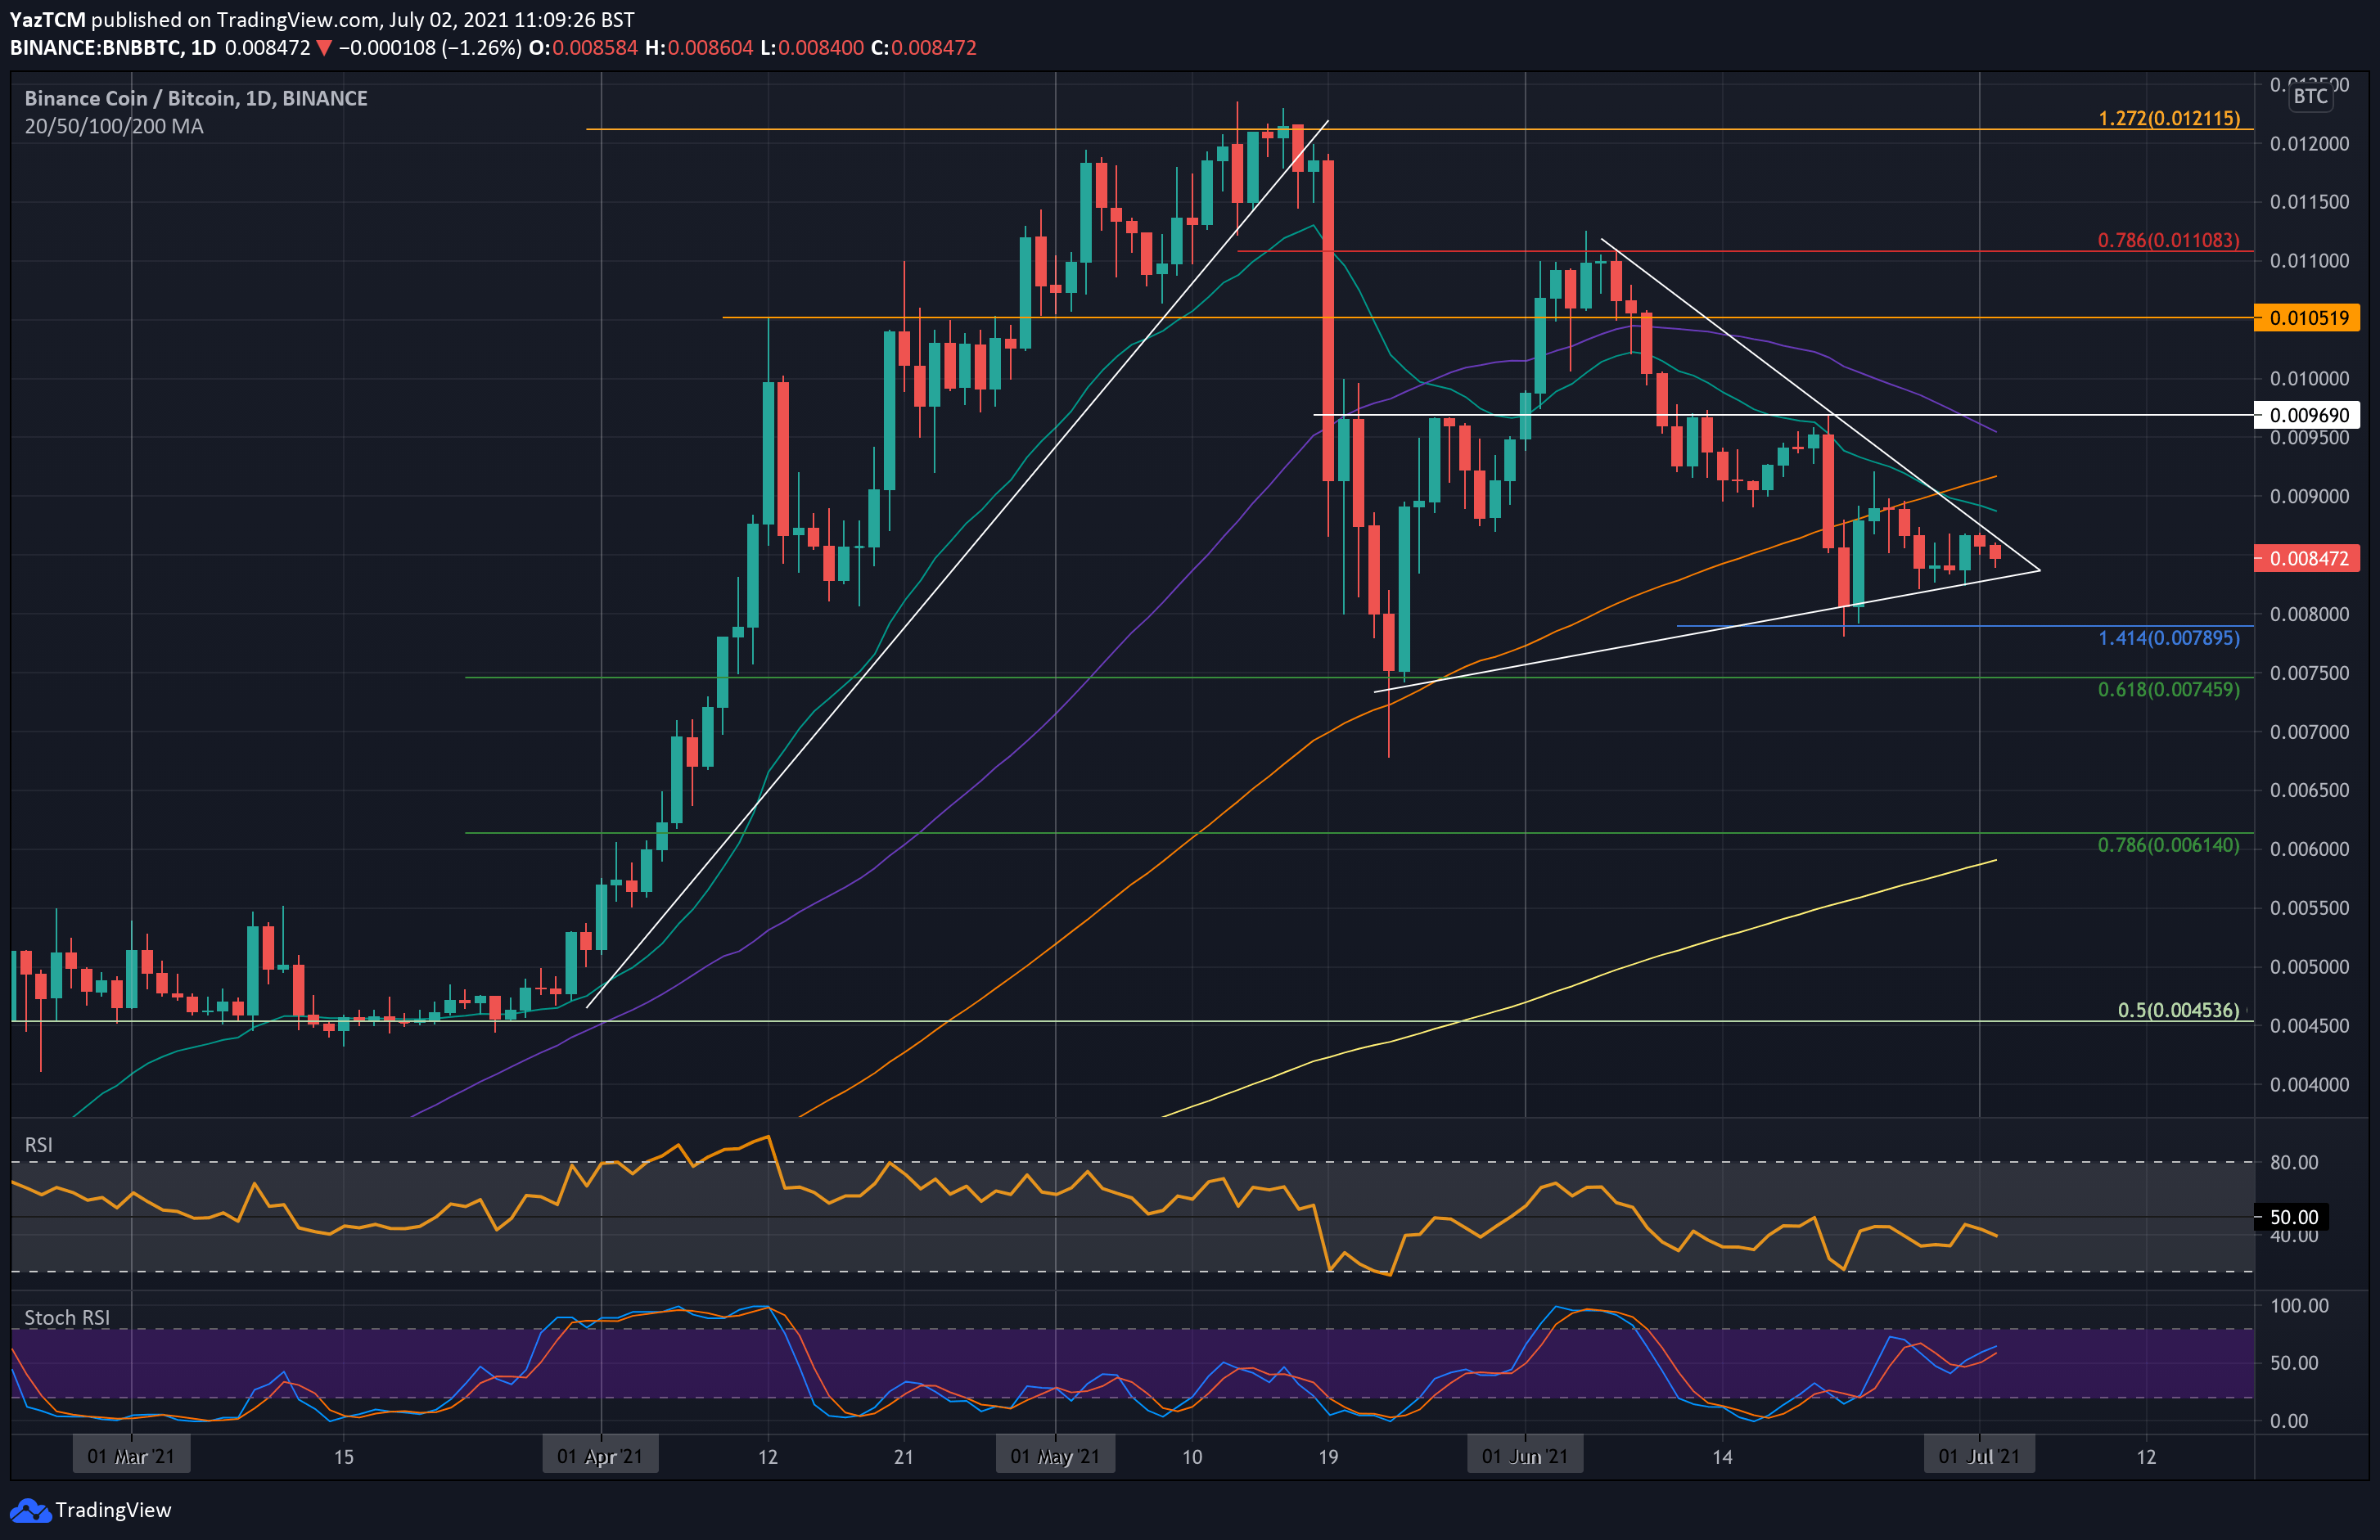
BNB also struggles against BTC as it continues to trend lower inside a wide symmetrical triangle pattern. The bearish trend is likely to push BNB beneath this triangle over the coming week and might see the coin breaking beneath the June support at 0.008 BTC.
Looking ahead, the first support lies at the lower angle of the triangle, around 0.0083 BTC. This is followed by 0.008 BTC (June support), 0.00789 BTC (downside 1.414 Fib Extension), 0.00745 BTC (.618 Fib), and 0.007 BTC.
On the other side, the first resistance lies at 0.0086 BTC (upper angle of the triangle). This is followed by 0.0092 BTC (100-day MA), 0.0095 BTC (50-day MA), and 0.0096 BTC.
Polkadot
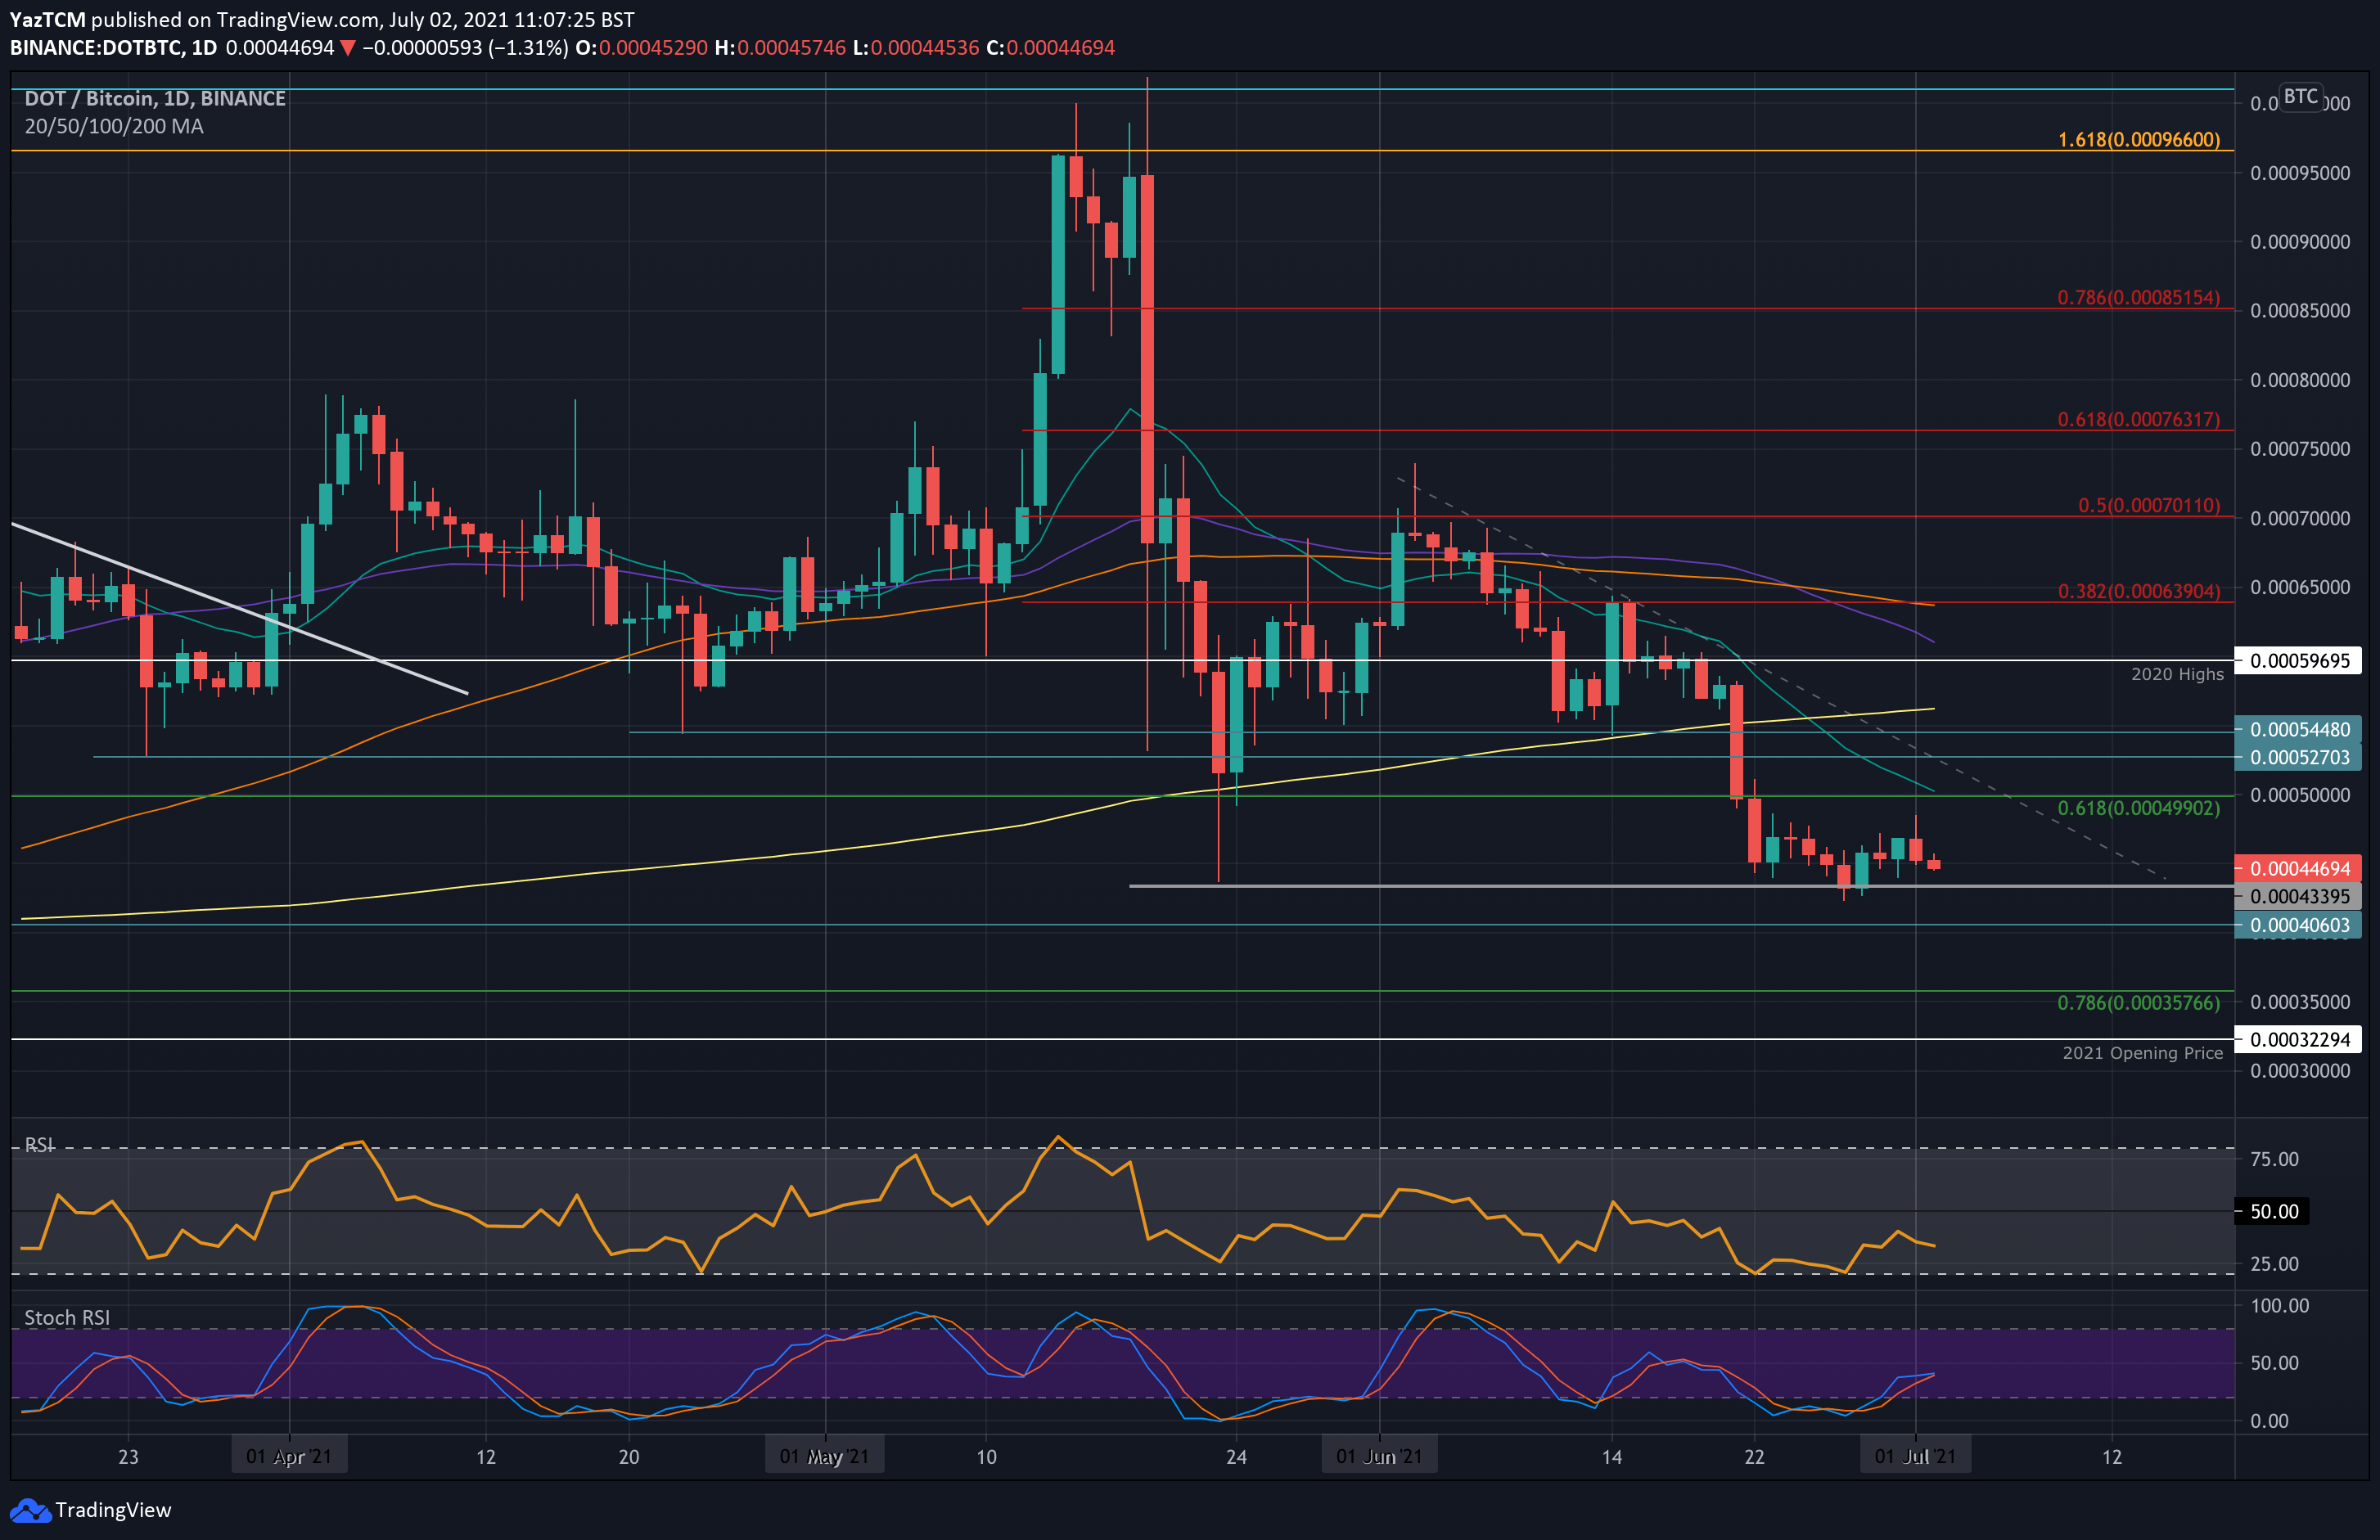
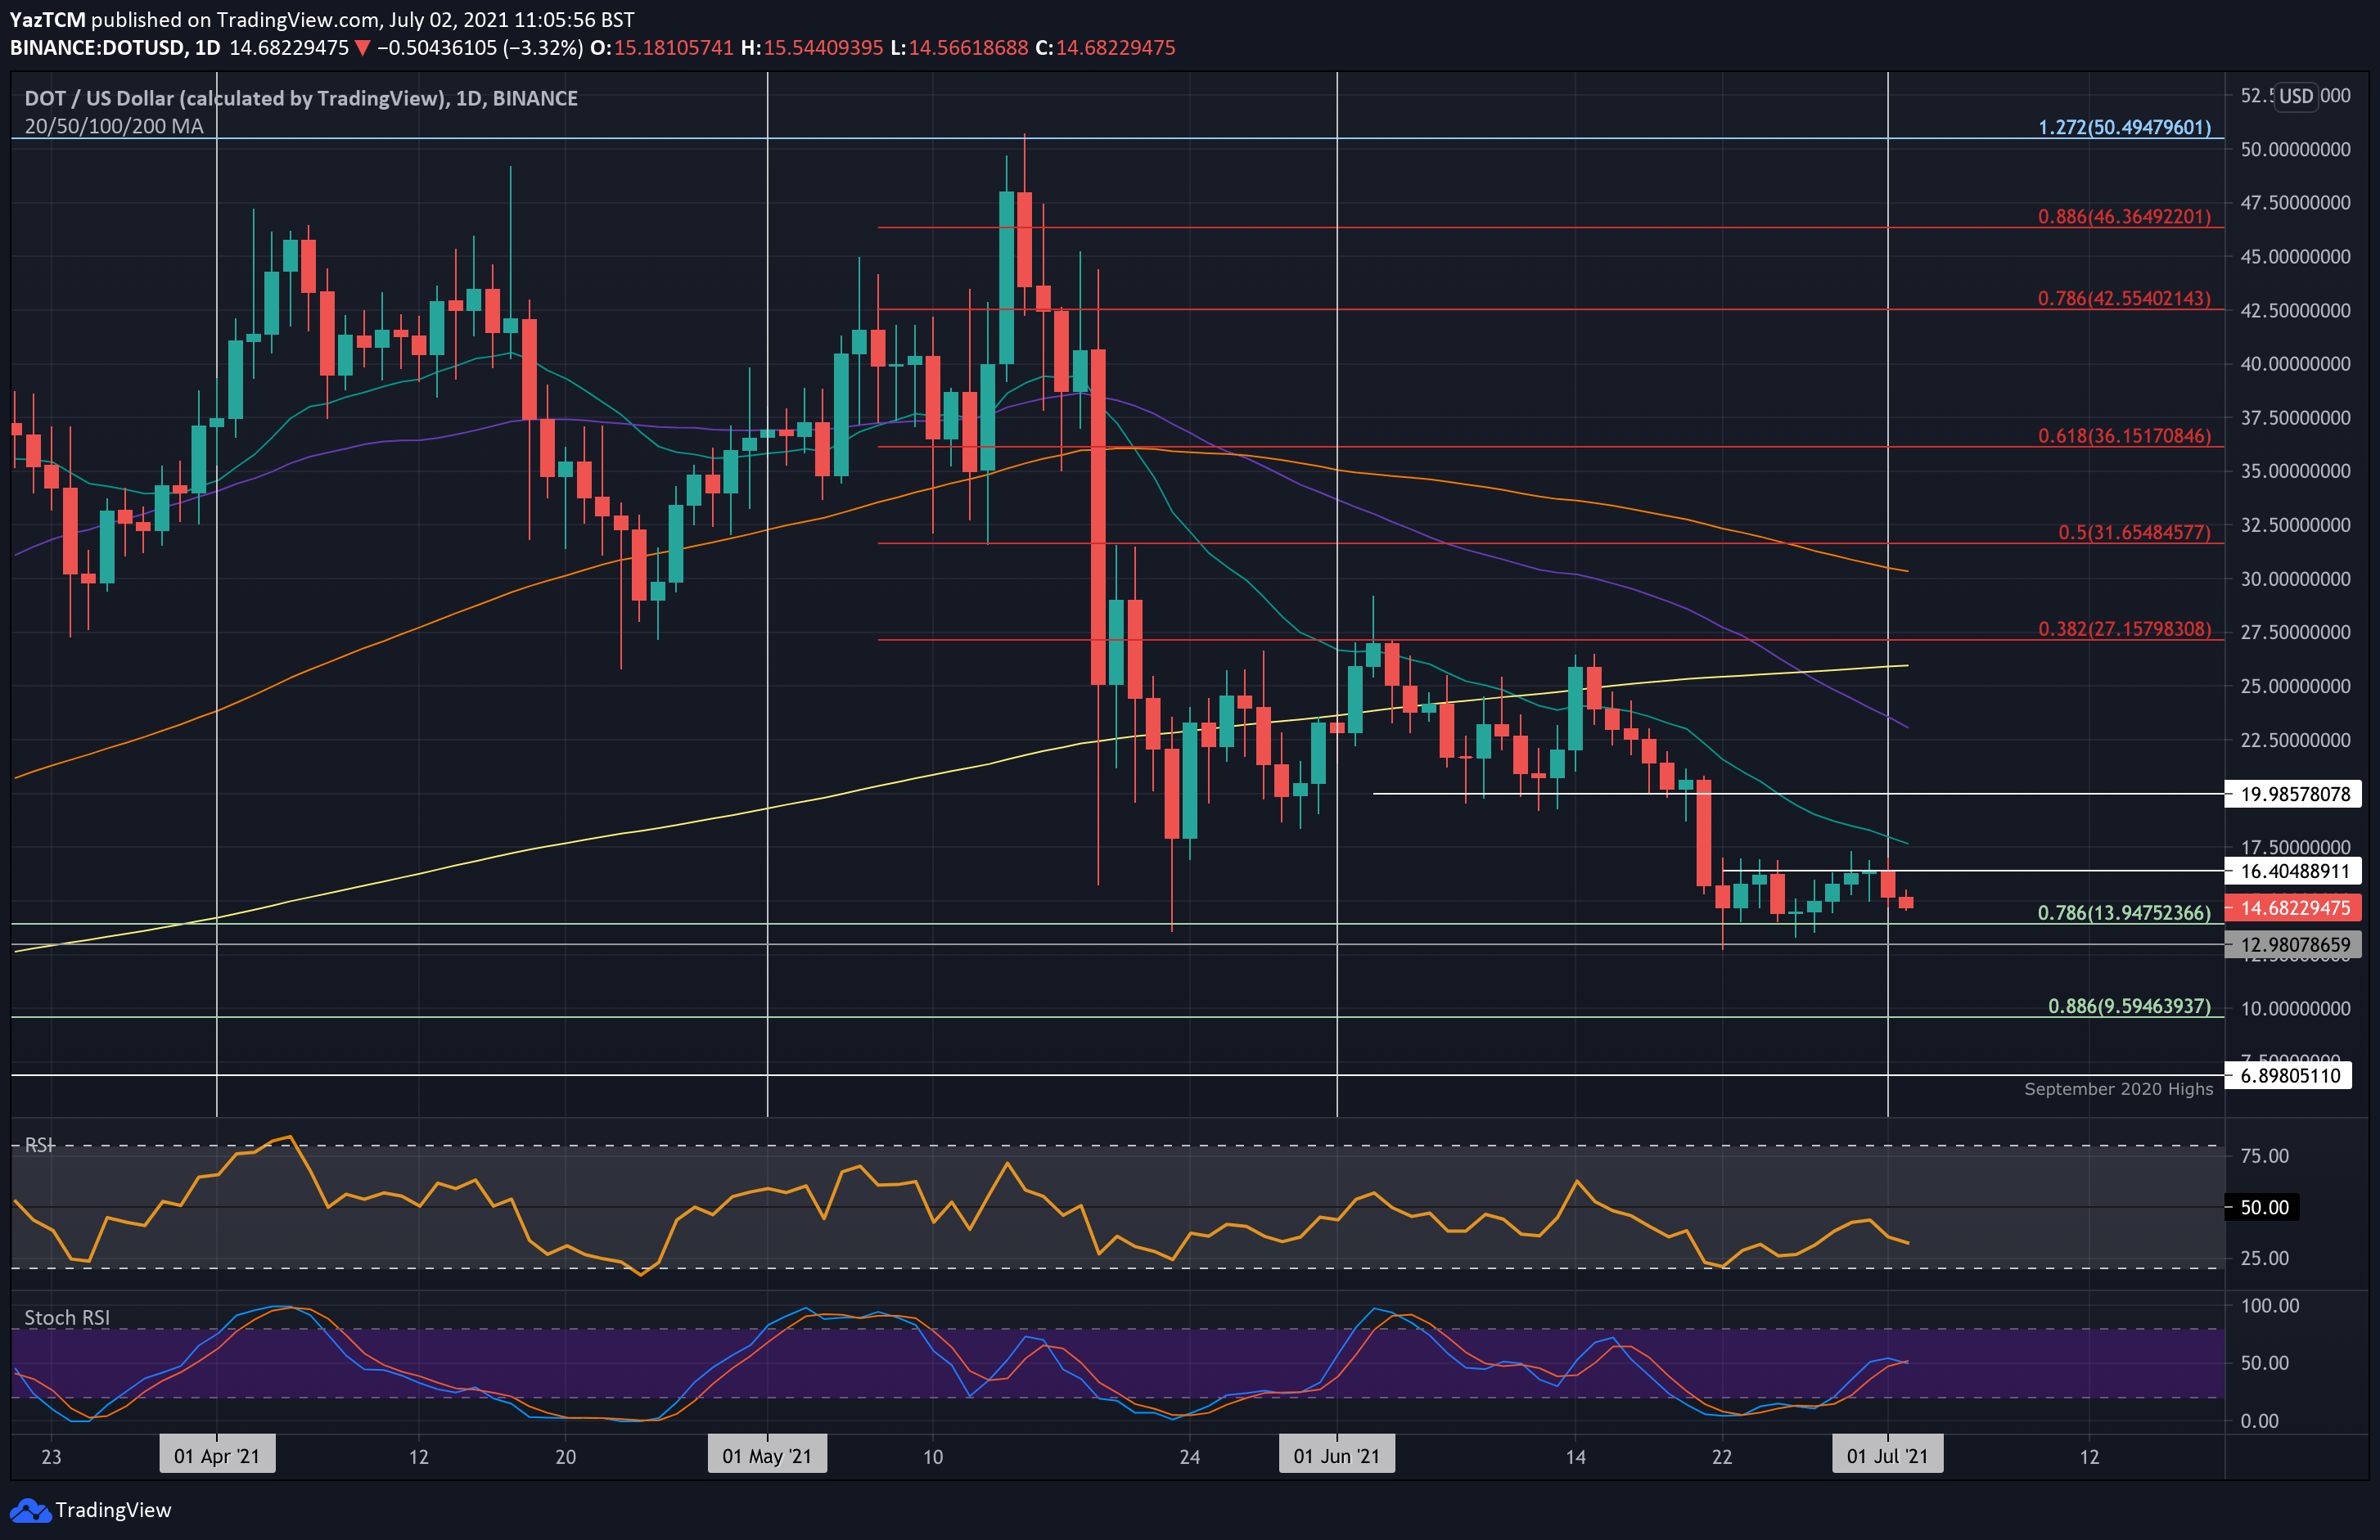
DOT is also down by a sharp 9.1% this week as it breaks back beneath $15. The cryptocurrency has been trading inside a range between $13.95 (.786 Fib) and $16.40 for the past fortnight.
It bounced from the lower boundary of the range over the weekend but could not break the upper boundary at $16.40 throughout the week. DOT will need to break this range to dictate the next direction for the market.
Looking ahead, the first support lies at the lower boundary of the range at $13.95. This is followed by $13, $12.50, and $10.
On the other side, the first resistance lies at $16.40. This is followed by $17.50 *20-day MA), $20 (early June support), and $23 (50-day MA).
Against BTC, DOT rebounded from the May support at 0.000433 BTC at the start of the week but could not close a daily candle above 0.00047 BTC during the week. It is also establishing a trading range between these two levels and must produce a breakout to dictate the next direction for the market.
Looking ahead, the first support lies at 0.000433 BTC (May lows). This is followed by 0.000406 BTC, 0.00037 BTC, and 0.000357 BTC (.786 Fib).
On the other side, the first resistance lies at 0.00047 BTC. This is followed by 0.0005 BTC (20-day MA), 0.00052 BTC (June resistance trendline), 0.000544 BTC, and 0.00056 BTC (200-day MA).