We saw another week of relatively choppy price action as the major cryptocurrencies failed to chart any serious gain. On the opposite – with a few exceptions, most of the coins underwater. Bitcoin Bitcoin is down by a total of 4.7% this week and is trading inside an ascending price channel as it battles to remain above the upper boundary at around ,600. The cryptocurrency had an interesting week of trading after meeting the resistance at ,760 (bearish .382 Fib) last week. It headed lower into the weekend until support was found at around ,520, where it formed a symmetrical triangle pattern. This triangle was penetrated at the start of June as BTC started to surge higher toward ,000. It formed an ascending price channel and was unable to overcome the upper
Topics:
Yaz Sheikh considers the following as important: ADABTC, ADAUSD, Bitcoin (BTC) Price, BTCEUR, BTCGBP, btcusd, btcusdt, Cardano (ADA) Price, ETH Analysis, ETHBTC, Ethereum (ETH) Price, ethusd, Price Analysis, Ripple (XRP) Price, Solana (SOL) Price Analysis, XRP Analysis, xrpbtc, xrpusd
This could be interesting, too:
Chayanika Deka writes XRP, SOL, and ADA Inclusion in US Crypto Reserve Pushes Traders on Edge
Chayanika Deka writes Why Arthur Hayes Is Bullish on Bitcoin Under Trump’s Economic Strategy
Mandy Williams writes Why the Bitcoin Market Is Stuck—and the Key Metric That Could Change It: CryptoQuant CEO
Wayne Jones writes Metaplanet Acquires 156 BTC, Bringing Total Holdings to 2,391
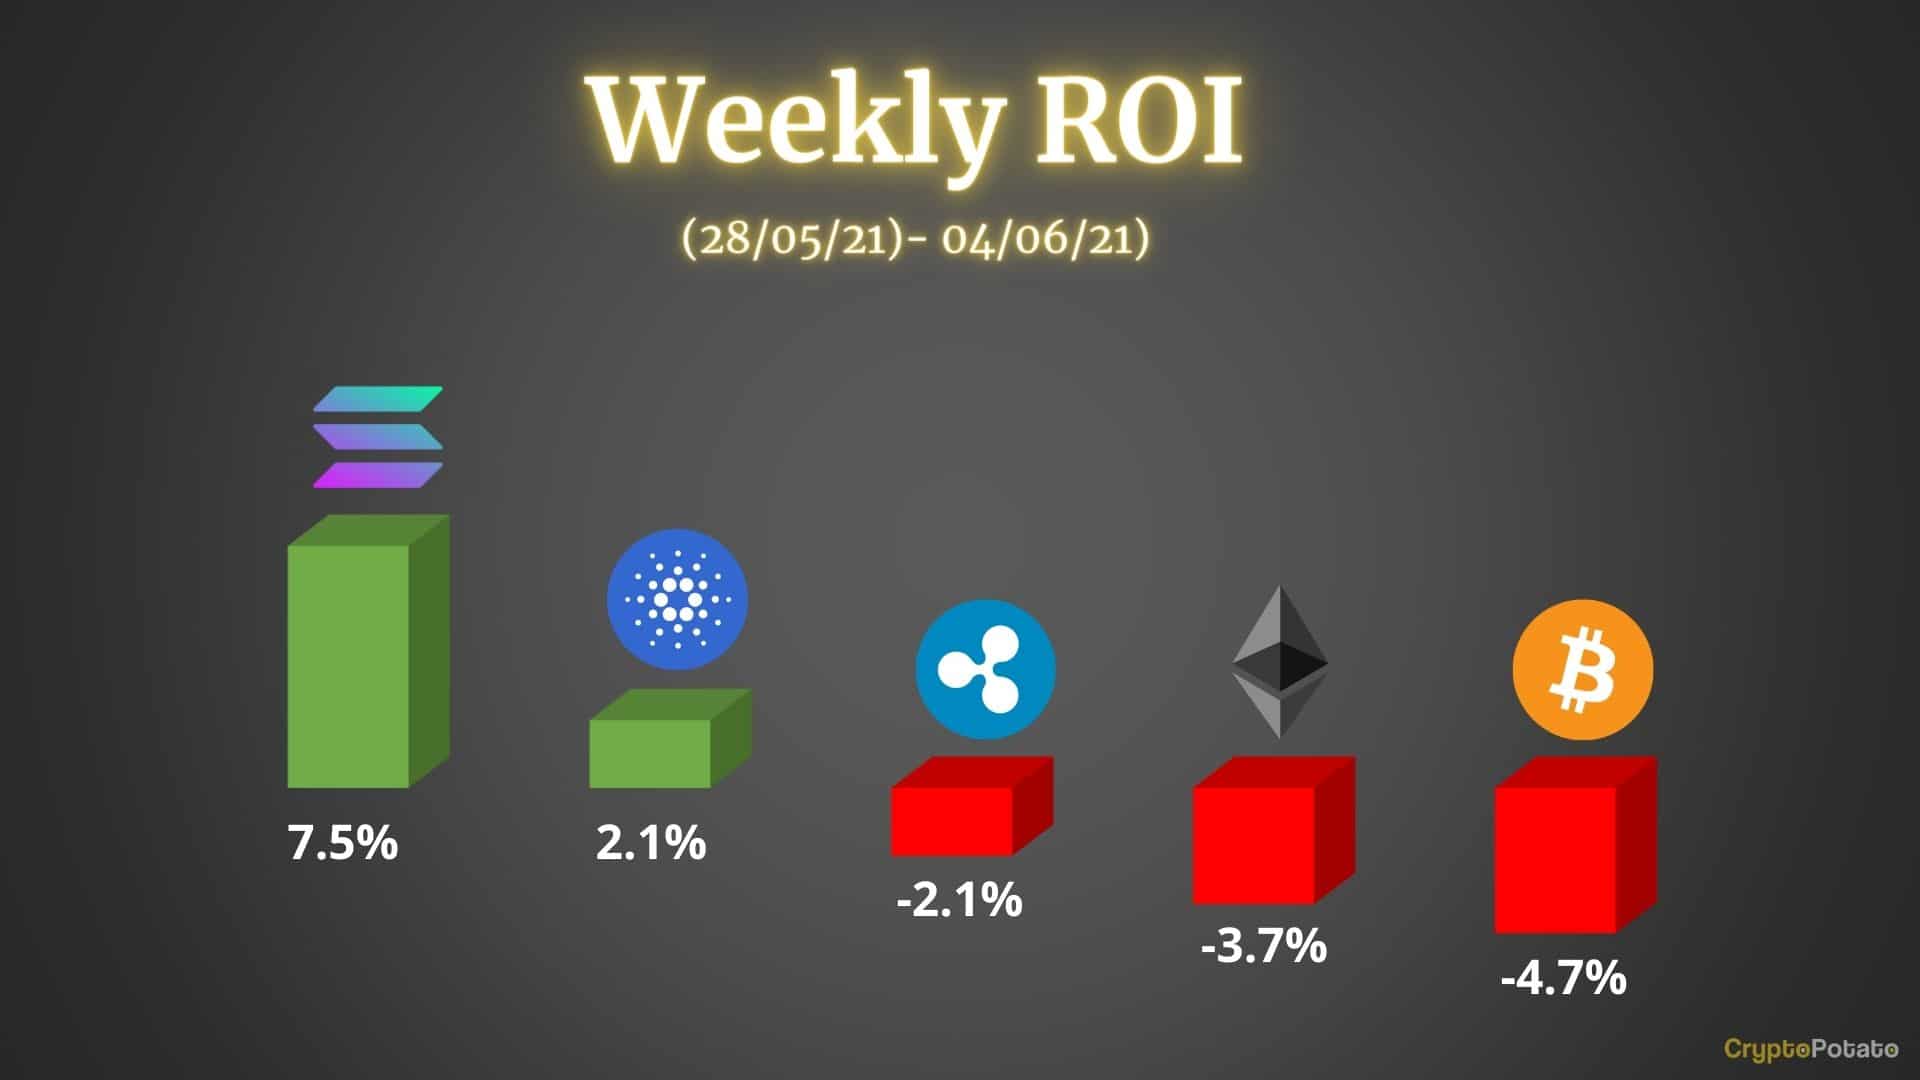
We saw another week of relatively choppy price action as the major cryptocurrencies failed to chart any serious gain. On the opposite – with a few exceptions, most of the coins underwater.
Bitcoin
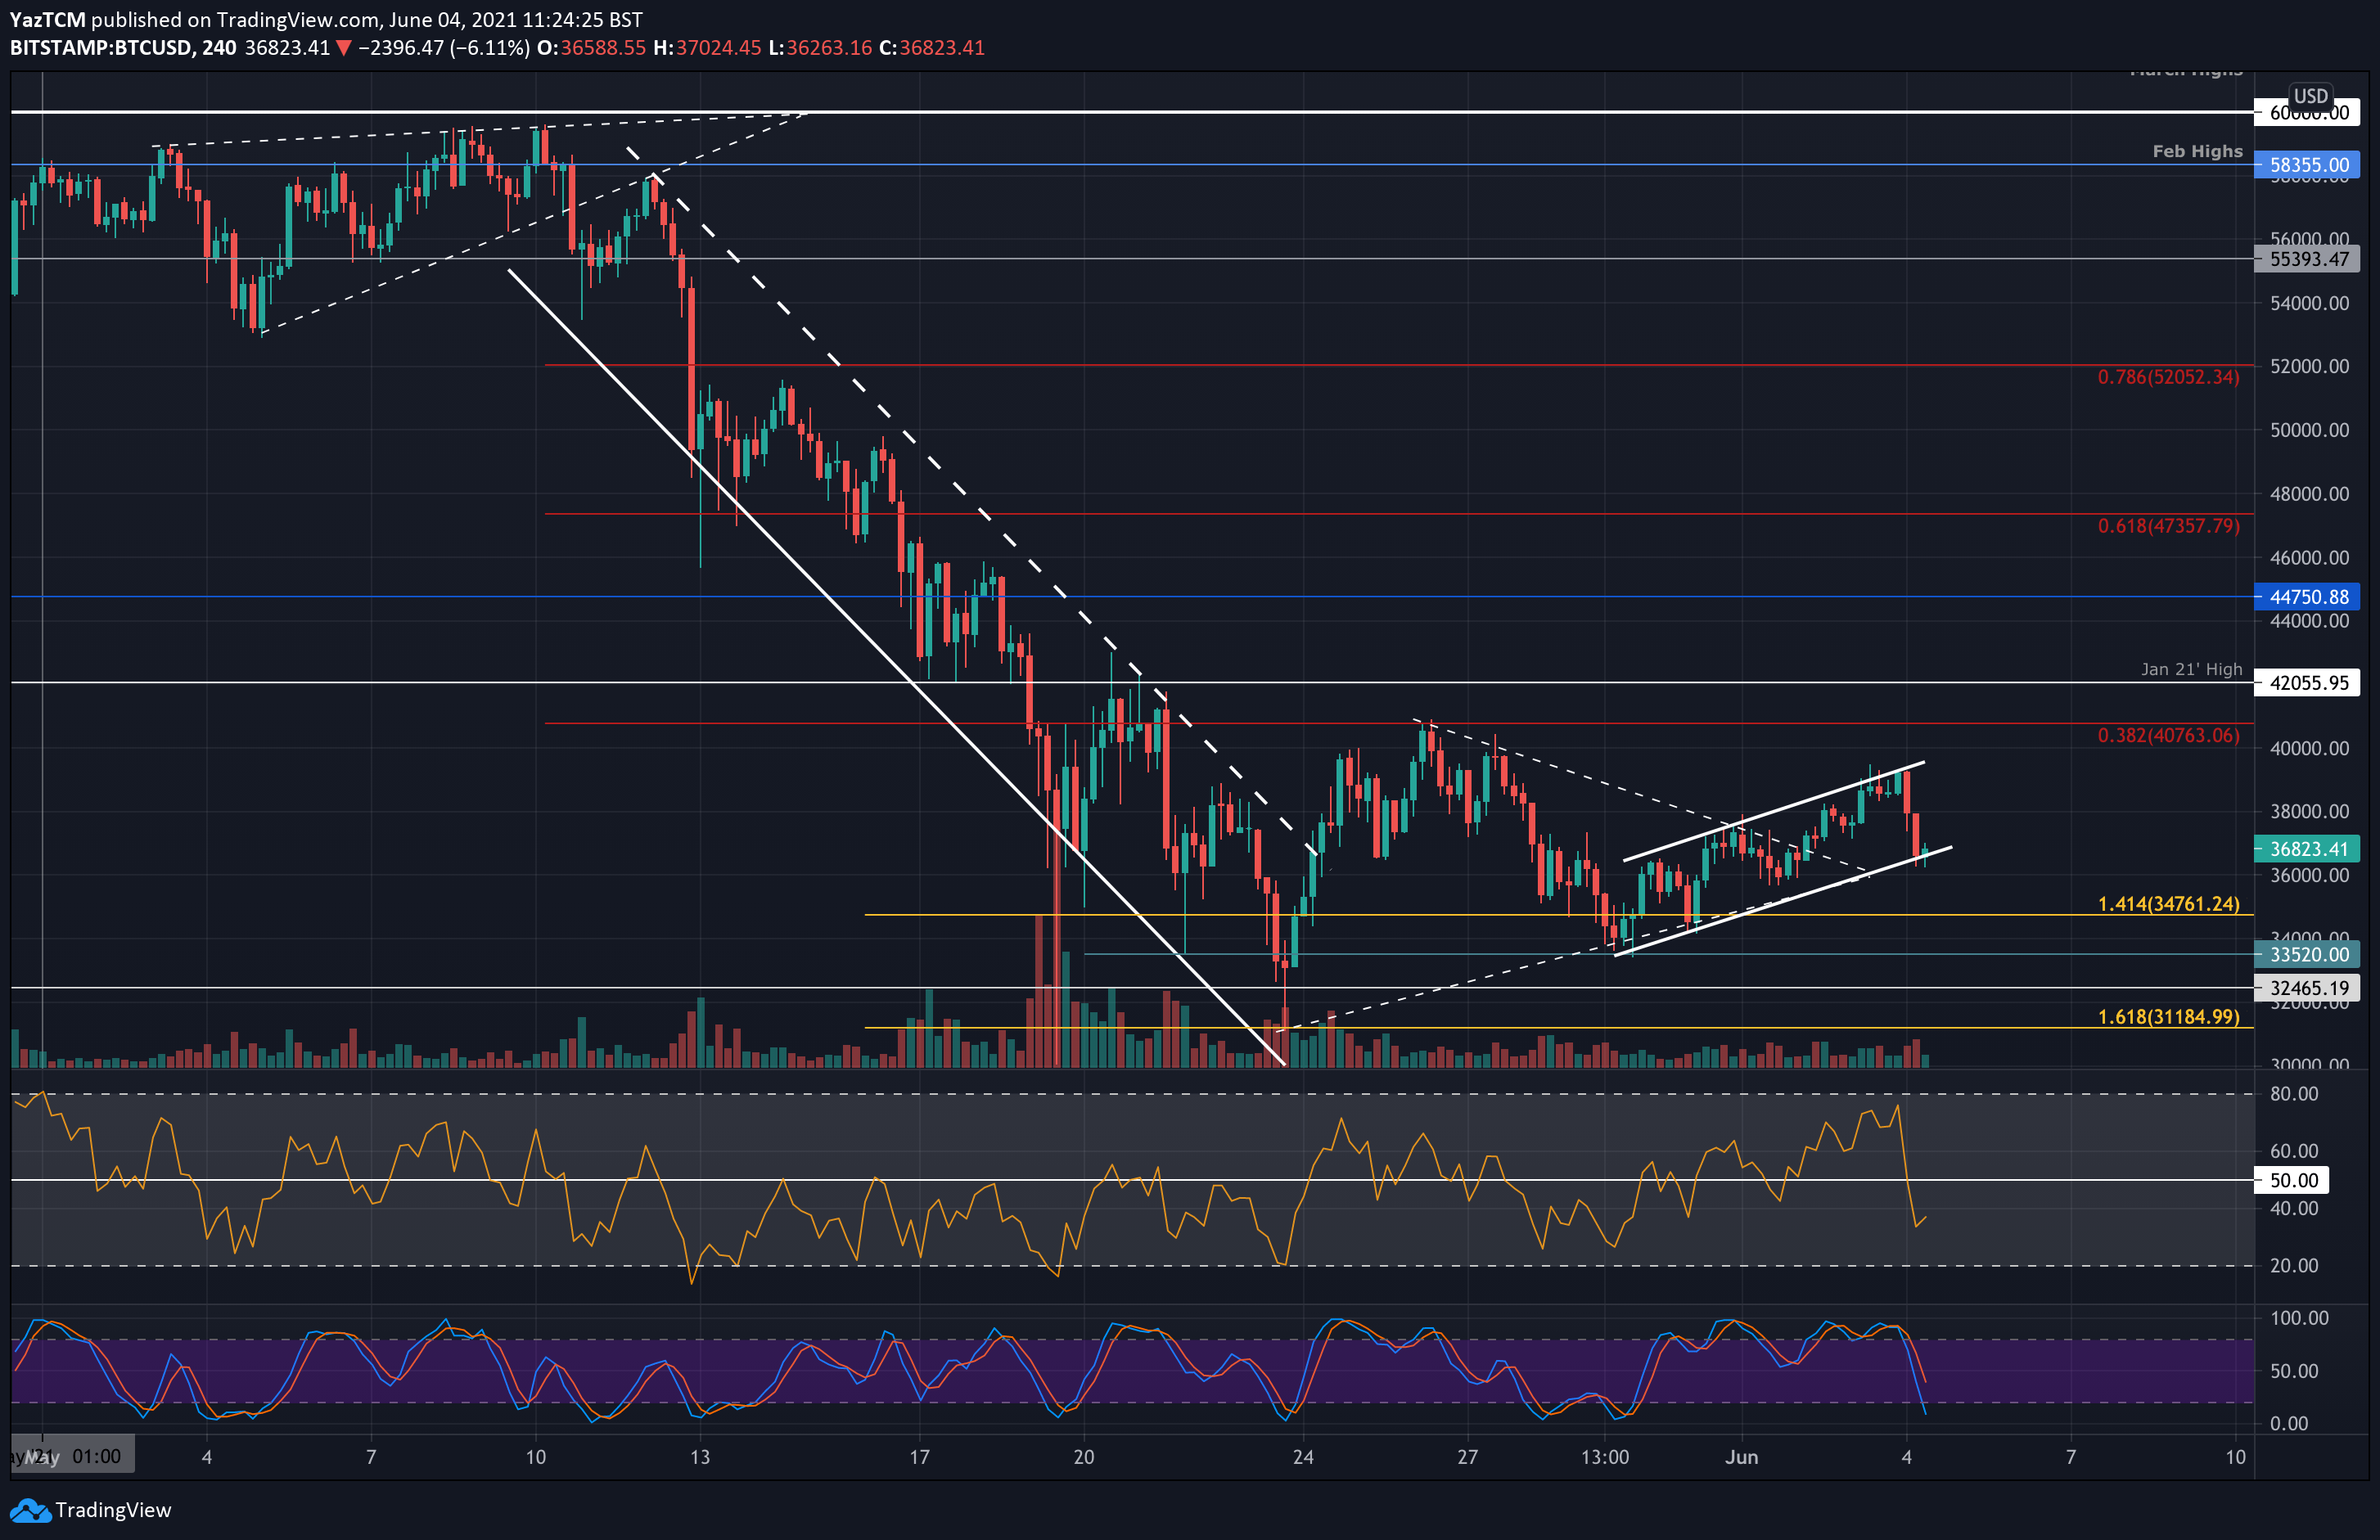
Bitcoin is down by a total of 4.7% this week and is trading inside an ascending price channel as it battles to remain above the upper boundary at around $36,600.
The cryptocurrency had an interesting week of trading after meeting the resistance at $40,760 (bearish .382 Fib) last week. It headed lower into the weekend until support was found at around $33,520, where it formed a symmetrical triangle pattern.
This triangle was penetrated at the start of June as BTC started to surge higher toward $39,000. It formed an ascending price channel and was unable to overcome the upper boundary of this channel today and has since dropped into the lower boundary.
Looking ahead, if the bears break the current short-term price channel, the first support lies at $36,000. This is followed by $34,760 (downside 1.414 Fib Extension), $34,000, $33,520, and $32,465. Added support lies at $31,185 (downside 1.618 Fib Extension) and $30,000.
On the other side, the first resistance lies at $38,000. This is followed by $39,000 (the upper boundary of the price channel), $40,000, and $40,760 (bearish .382 Fib). Added resistance lies at $42,055 and $44,750.
Ethereum
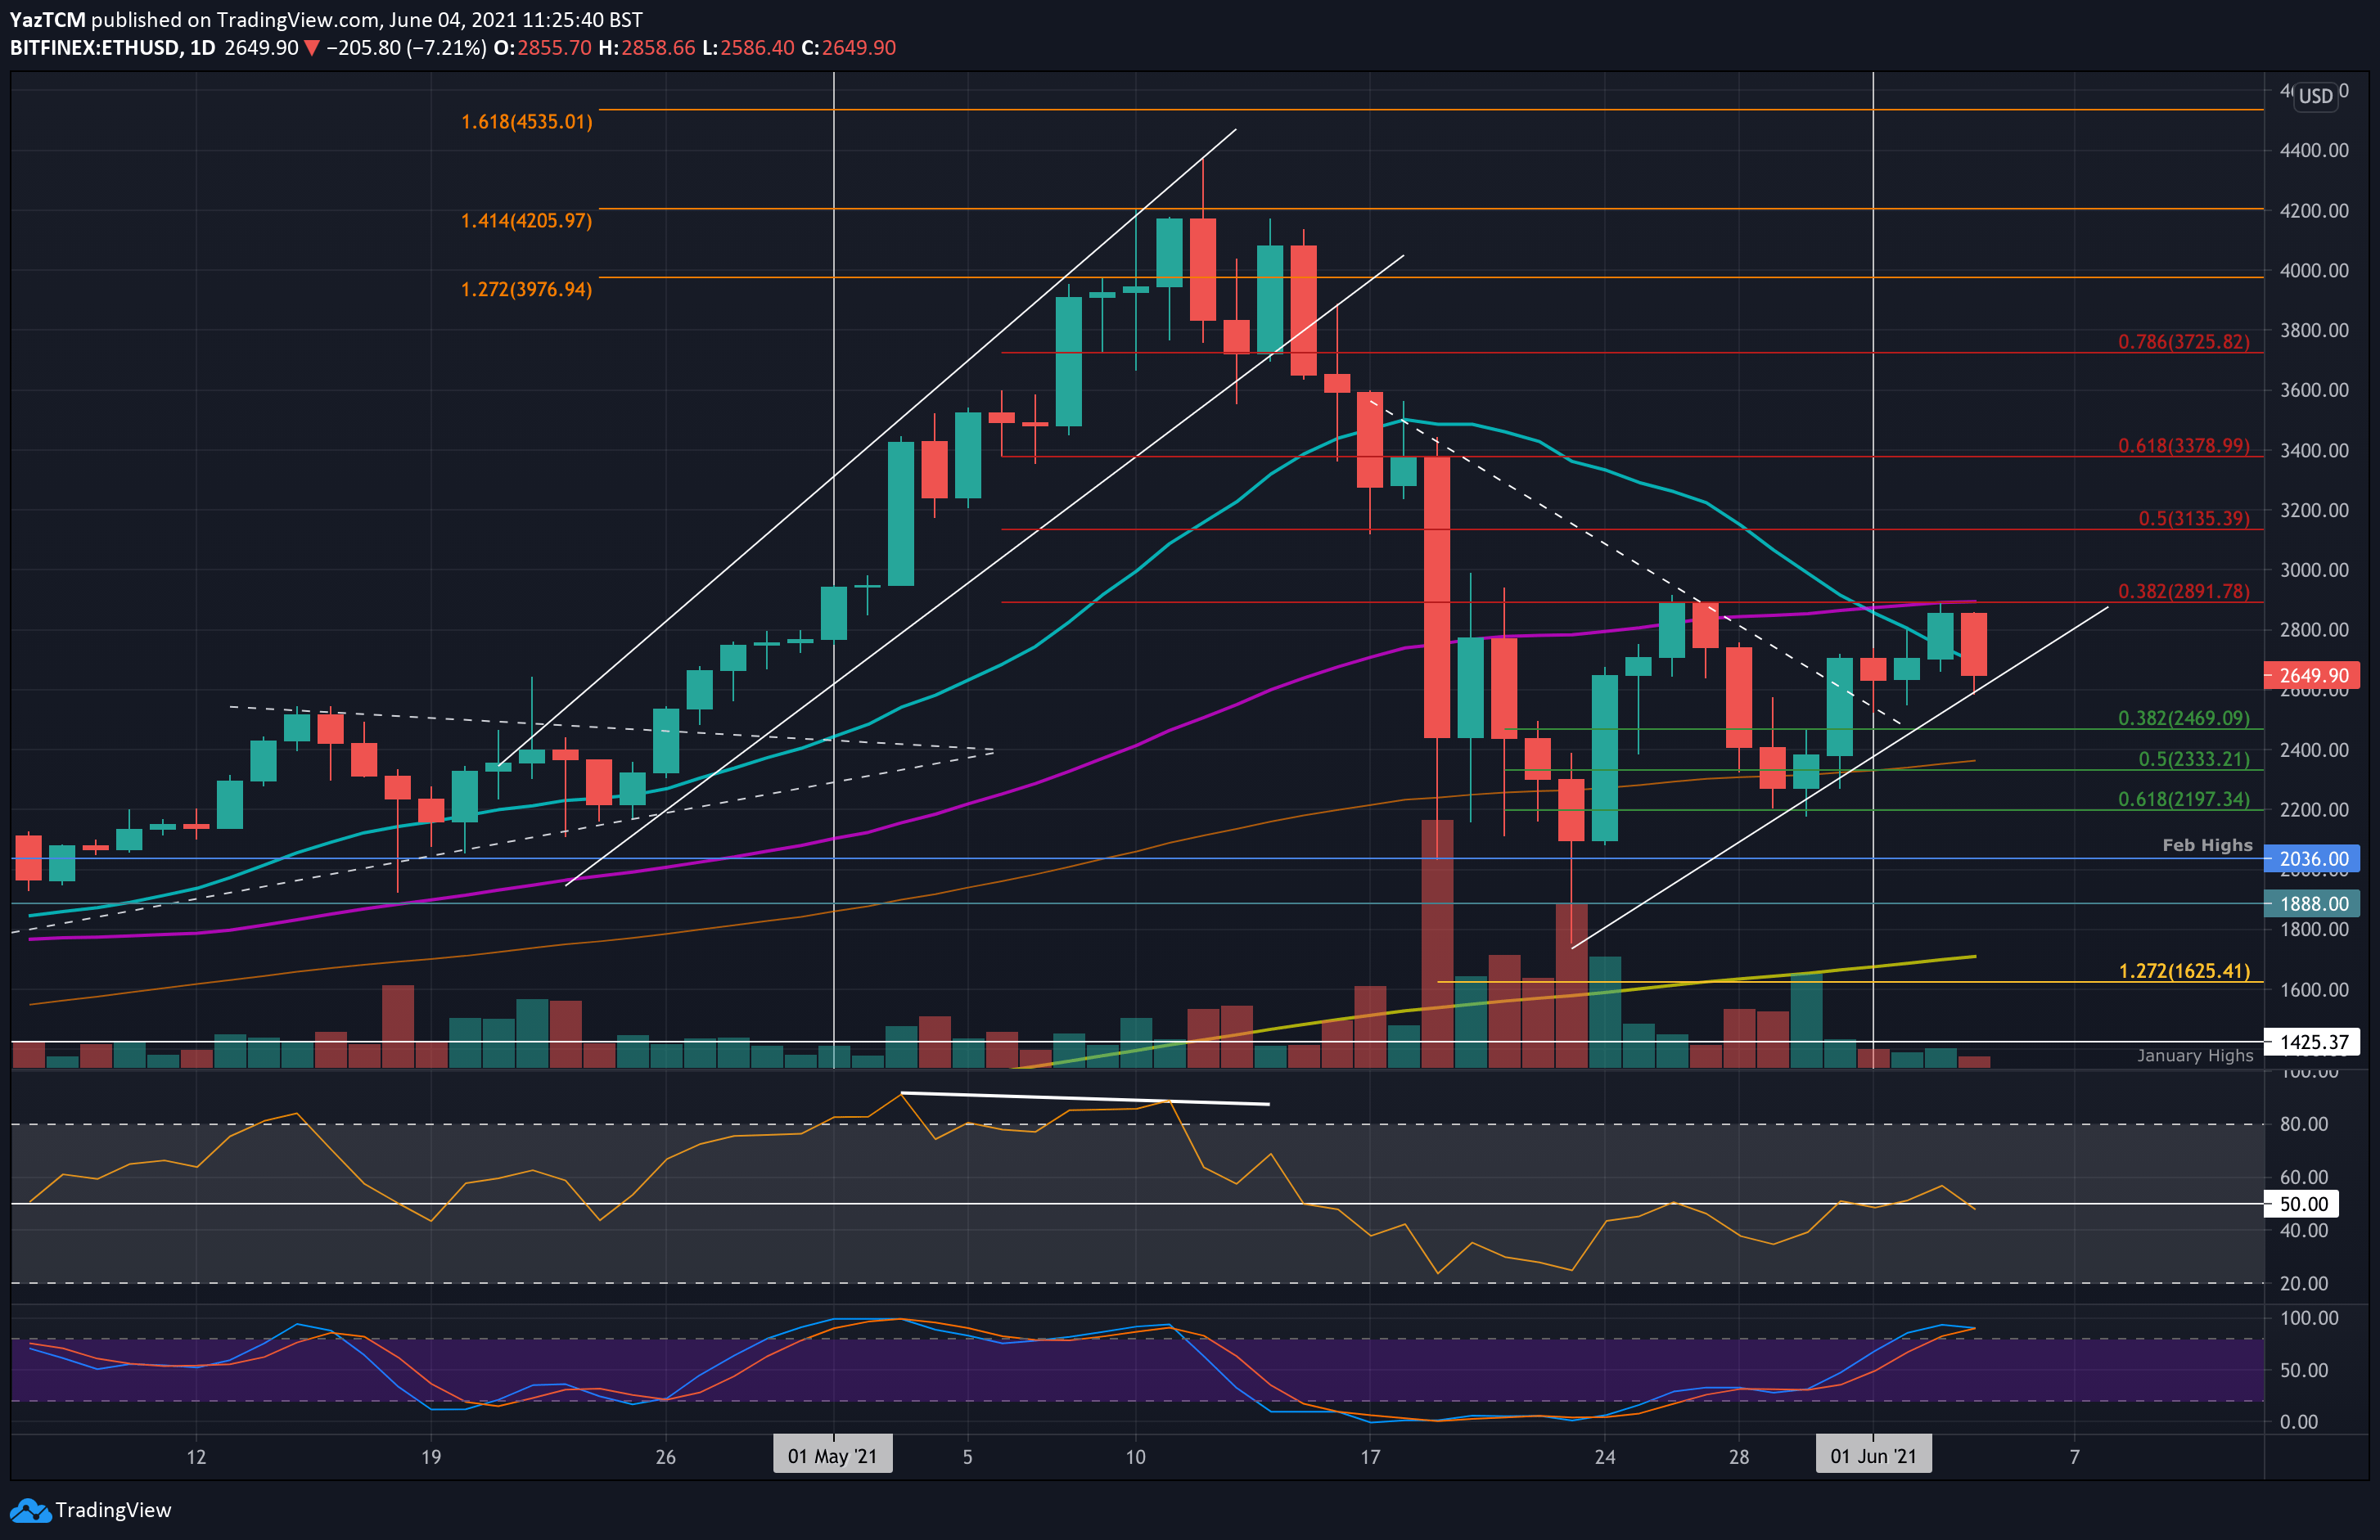
Ethereum is down by a small 3.7% this week as it currently trades at $2650. The cryptocurrency has now formed the making of an ascending triangle pattern with the roof of the triangle at $2890 (bearish .382 Fib & 50-day MA).
The coin started the week by rebounding from the $2200 support (.618 Fib) as it pished higher on Monday to break a falling trend line. Yesterday, ETH continued above $2700 and reached the resistance at $2891 (bearish .382 Fib & 50-day MA) but rolled over from there today to reach the support at the lower triangle angle at $2600.
Looking ahead, if the bears push beneath the triangle at $2600, support is expected at $2470 (.382 Fib), $2333 (.5 Fib & 100-day MA), $2200 (.618 Fib), and $2036 (Feb 2021 highs).
On the other side, the first strong resistance lies at $2800. This is followed by $2891 (bearish .382 Fib & 50-day MA), $3000, $3135 (bearish .5 Fib), and $3380 (bearish .618 Fib).
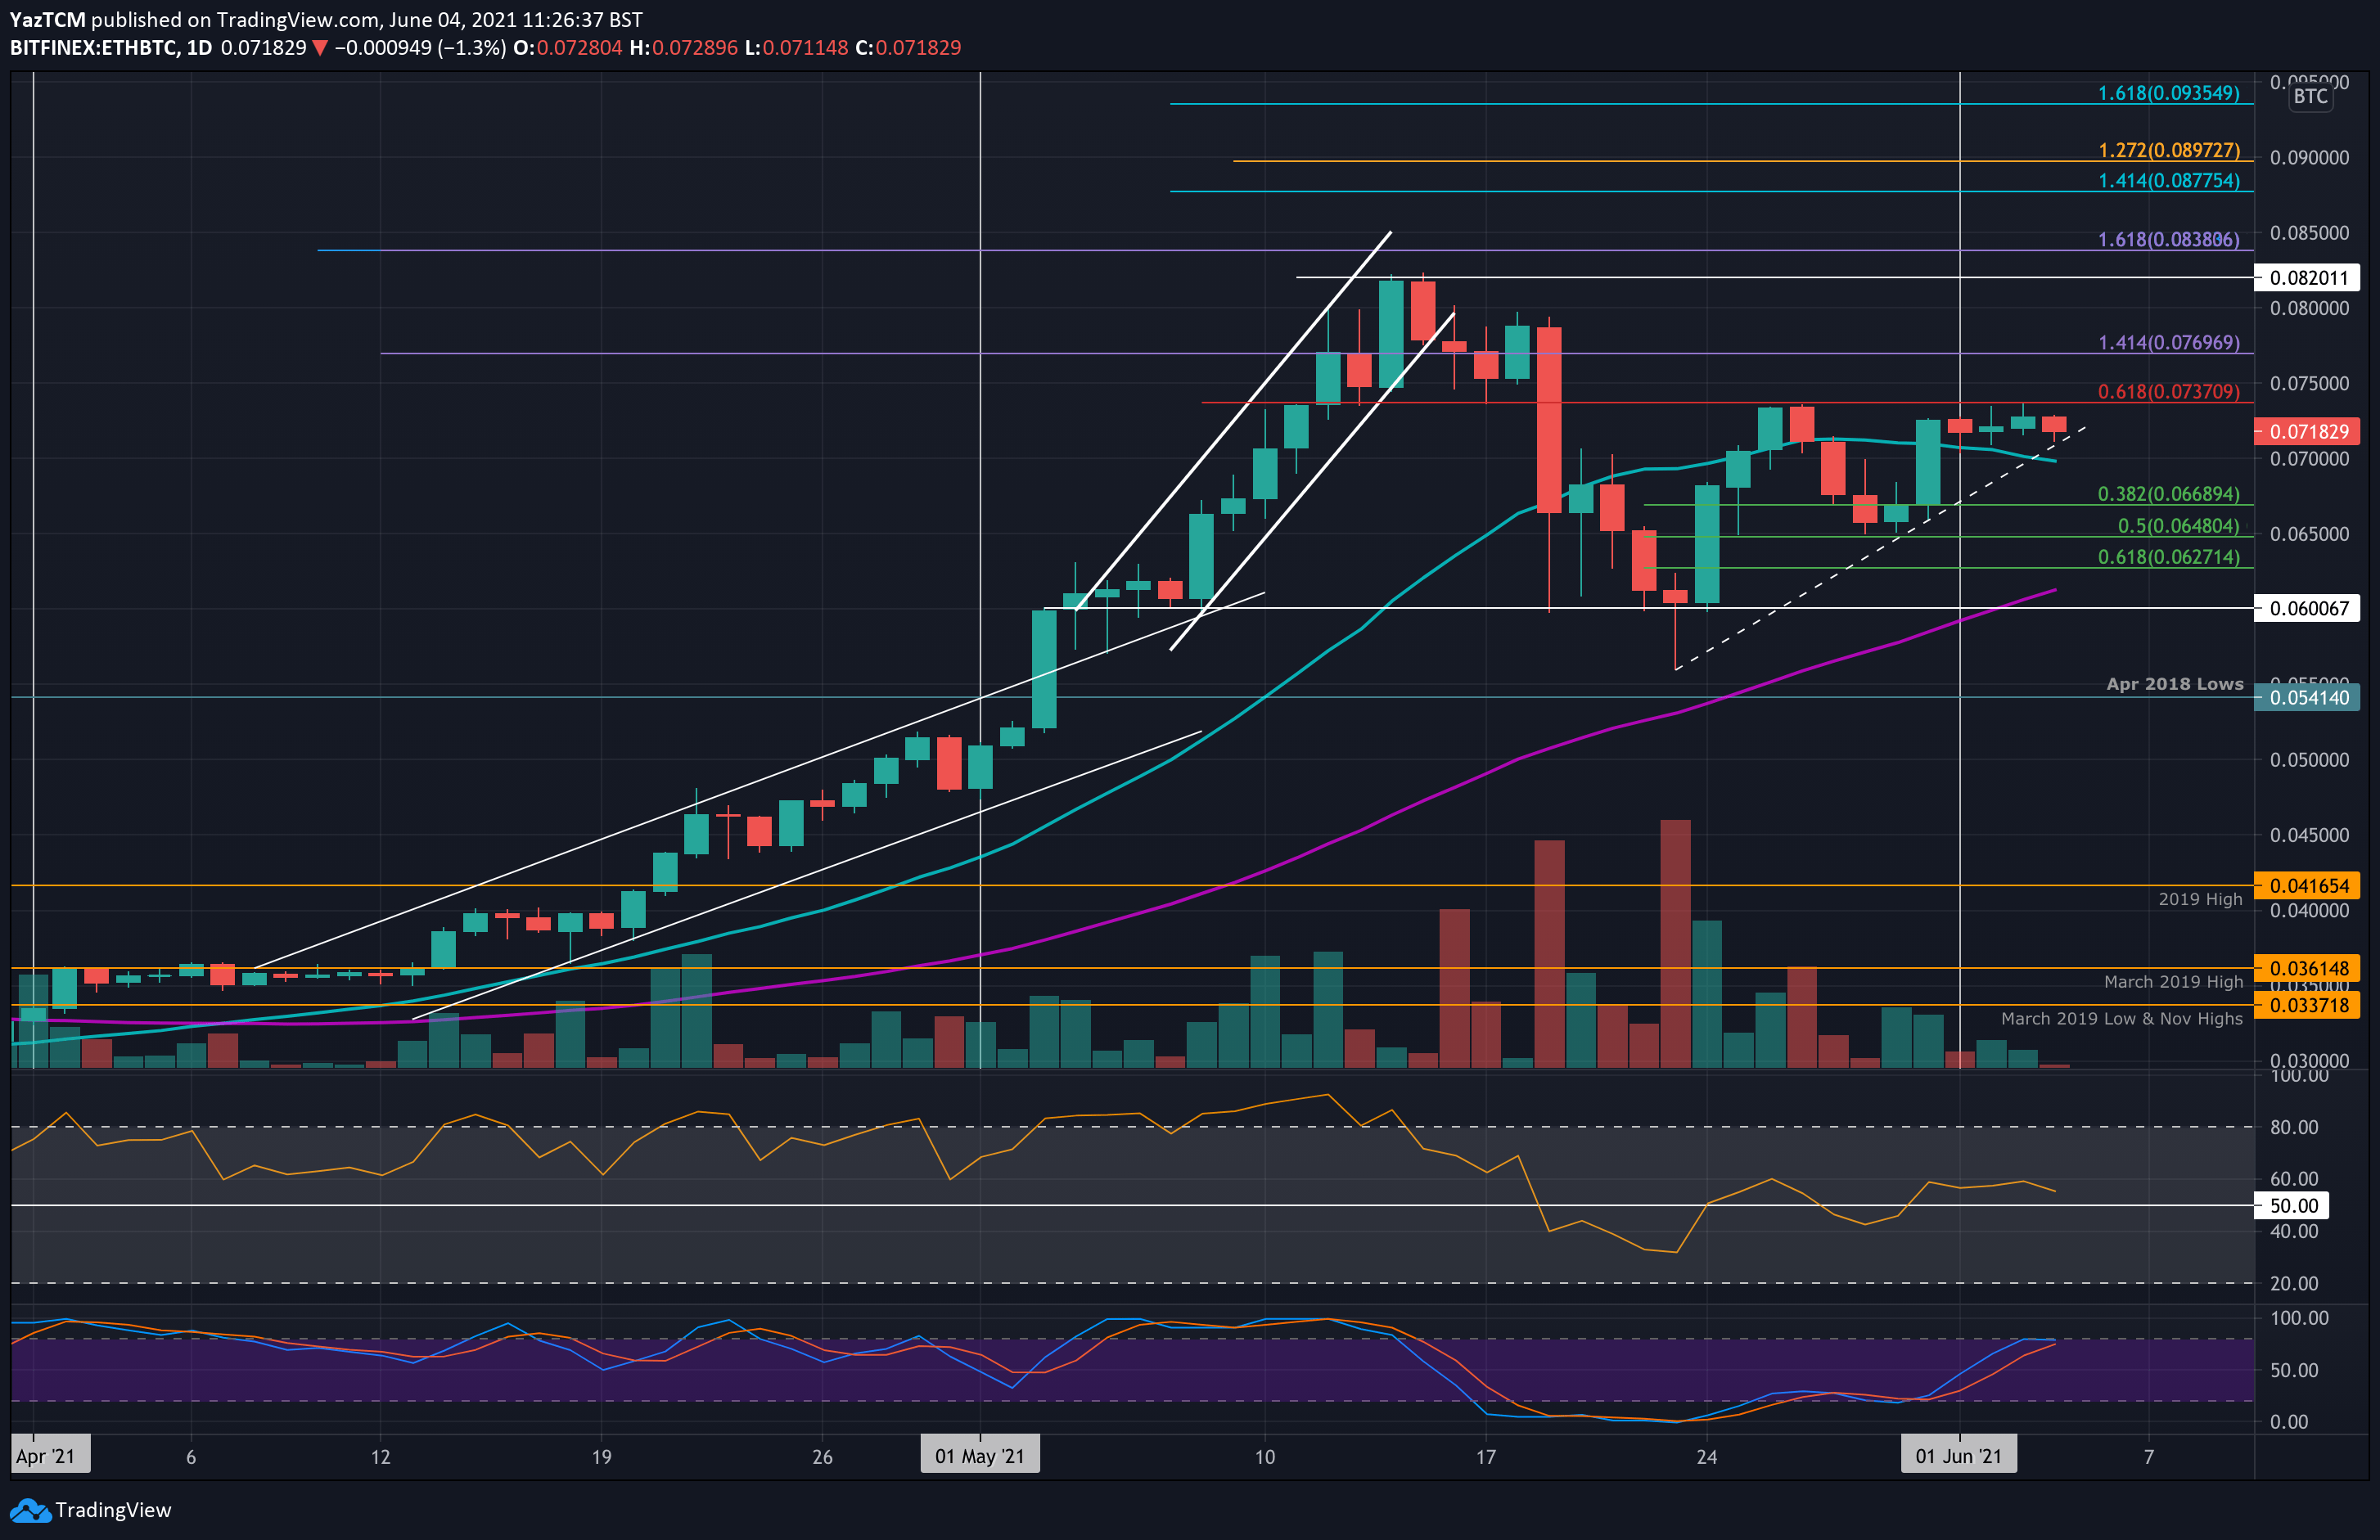
ETH is also trading inside an ascending triangle pattern against BTC, with the roof of the triangle at 0.0737 BTC (bearish .618 Fib Retracement). It started the week by rebounding from support at 0.0648 BTC (.5 Fib).
On Monday, ETH managed to break resistance at the 20-day MA, and it continued higher to reach the upper boundary of the triangle at 0.0737 BTC yesterday. It is still yet to break this resistance and has since dropped into the support at the lower angle today.
Looking ahead, if the bears break beneath the triangle, the first support lies at 0.07 BTC (20-day MA). This is followed by 0.0668 BTC (.382 Fib), 0.0648 BTC (.5 Fib), and 0.0627 BTC (.618 Fib).
On the other side, the first resistance lies at 0.0737 BTC (bearish .618 Fib). Above this triangle, resistance lies at 0.075 BTC, 0.077 BTC (1.414 Fib Extension), 0.08 BTC, and 0.082 BTC.
Ripple
XRP is down a small 2.1% from where it was last week but fell by a steep 11.5% today as it fell beneath the $1.00 level.
XRP is also trading inside an ascending triangle pattern with the roof of the triangle at $1.05. The coin rebound from the 2020 highs at $0.8282 at the start of the week and pushed higher to break $1.00 on Monday.
However, throughout the week, XRP failed to break above the $1.05 (bearish .382 Fib) resistance which is acting as the roof of the triangle and rolled over from there today to hit the support at the lower boundary.
Looking ahead, if the bears break the lower angle at $0.9, the first support lies at $0.8282 (2020 highs). This is followed by $0.8, $0.75 (.786 Fib), and $0.7 (200-day MA).
On the other side, the first resistance now lies at $1.00. This is followed by $1.05 (bearish .382, 20-day MA, & triangle upper boundary), $1.10, and $1.25 (Feb 2018 highs & 50-day MA).

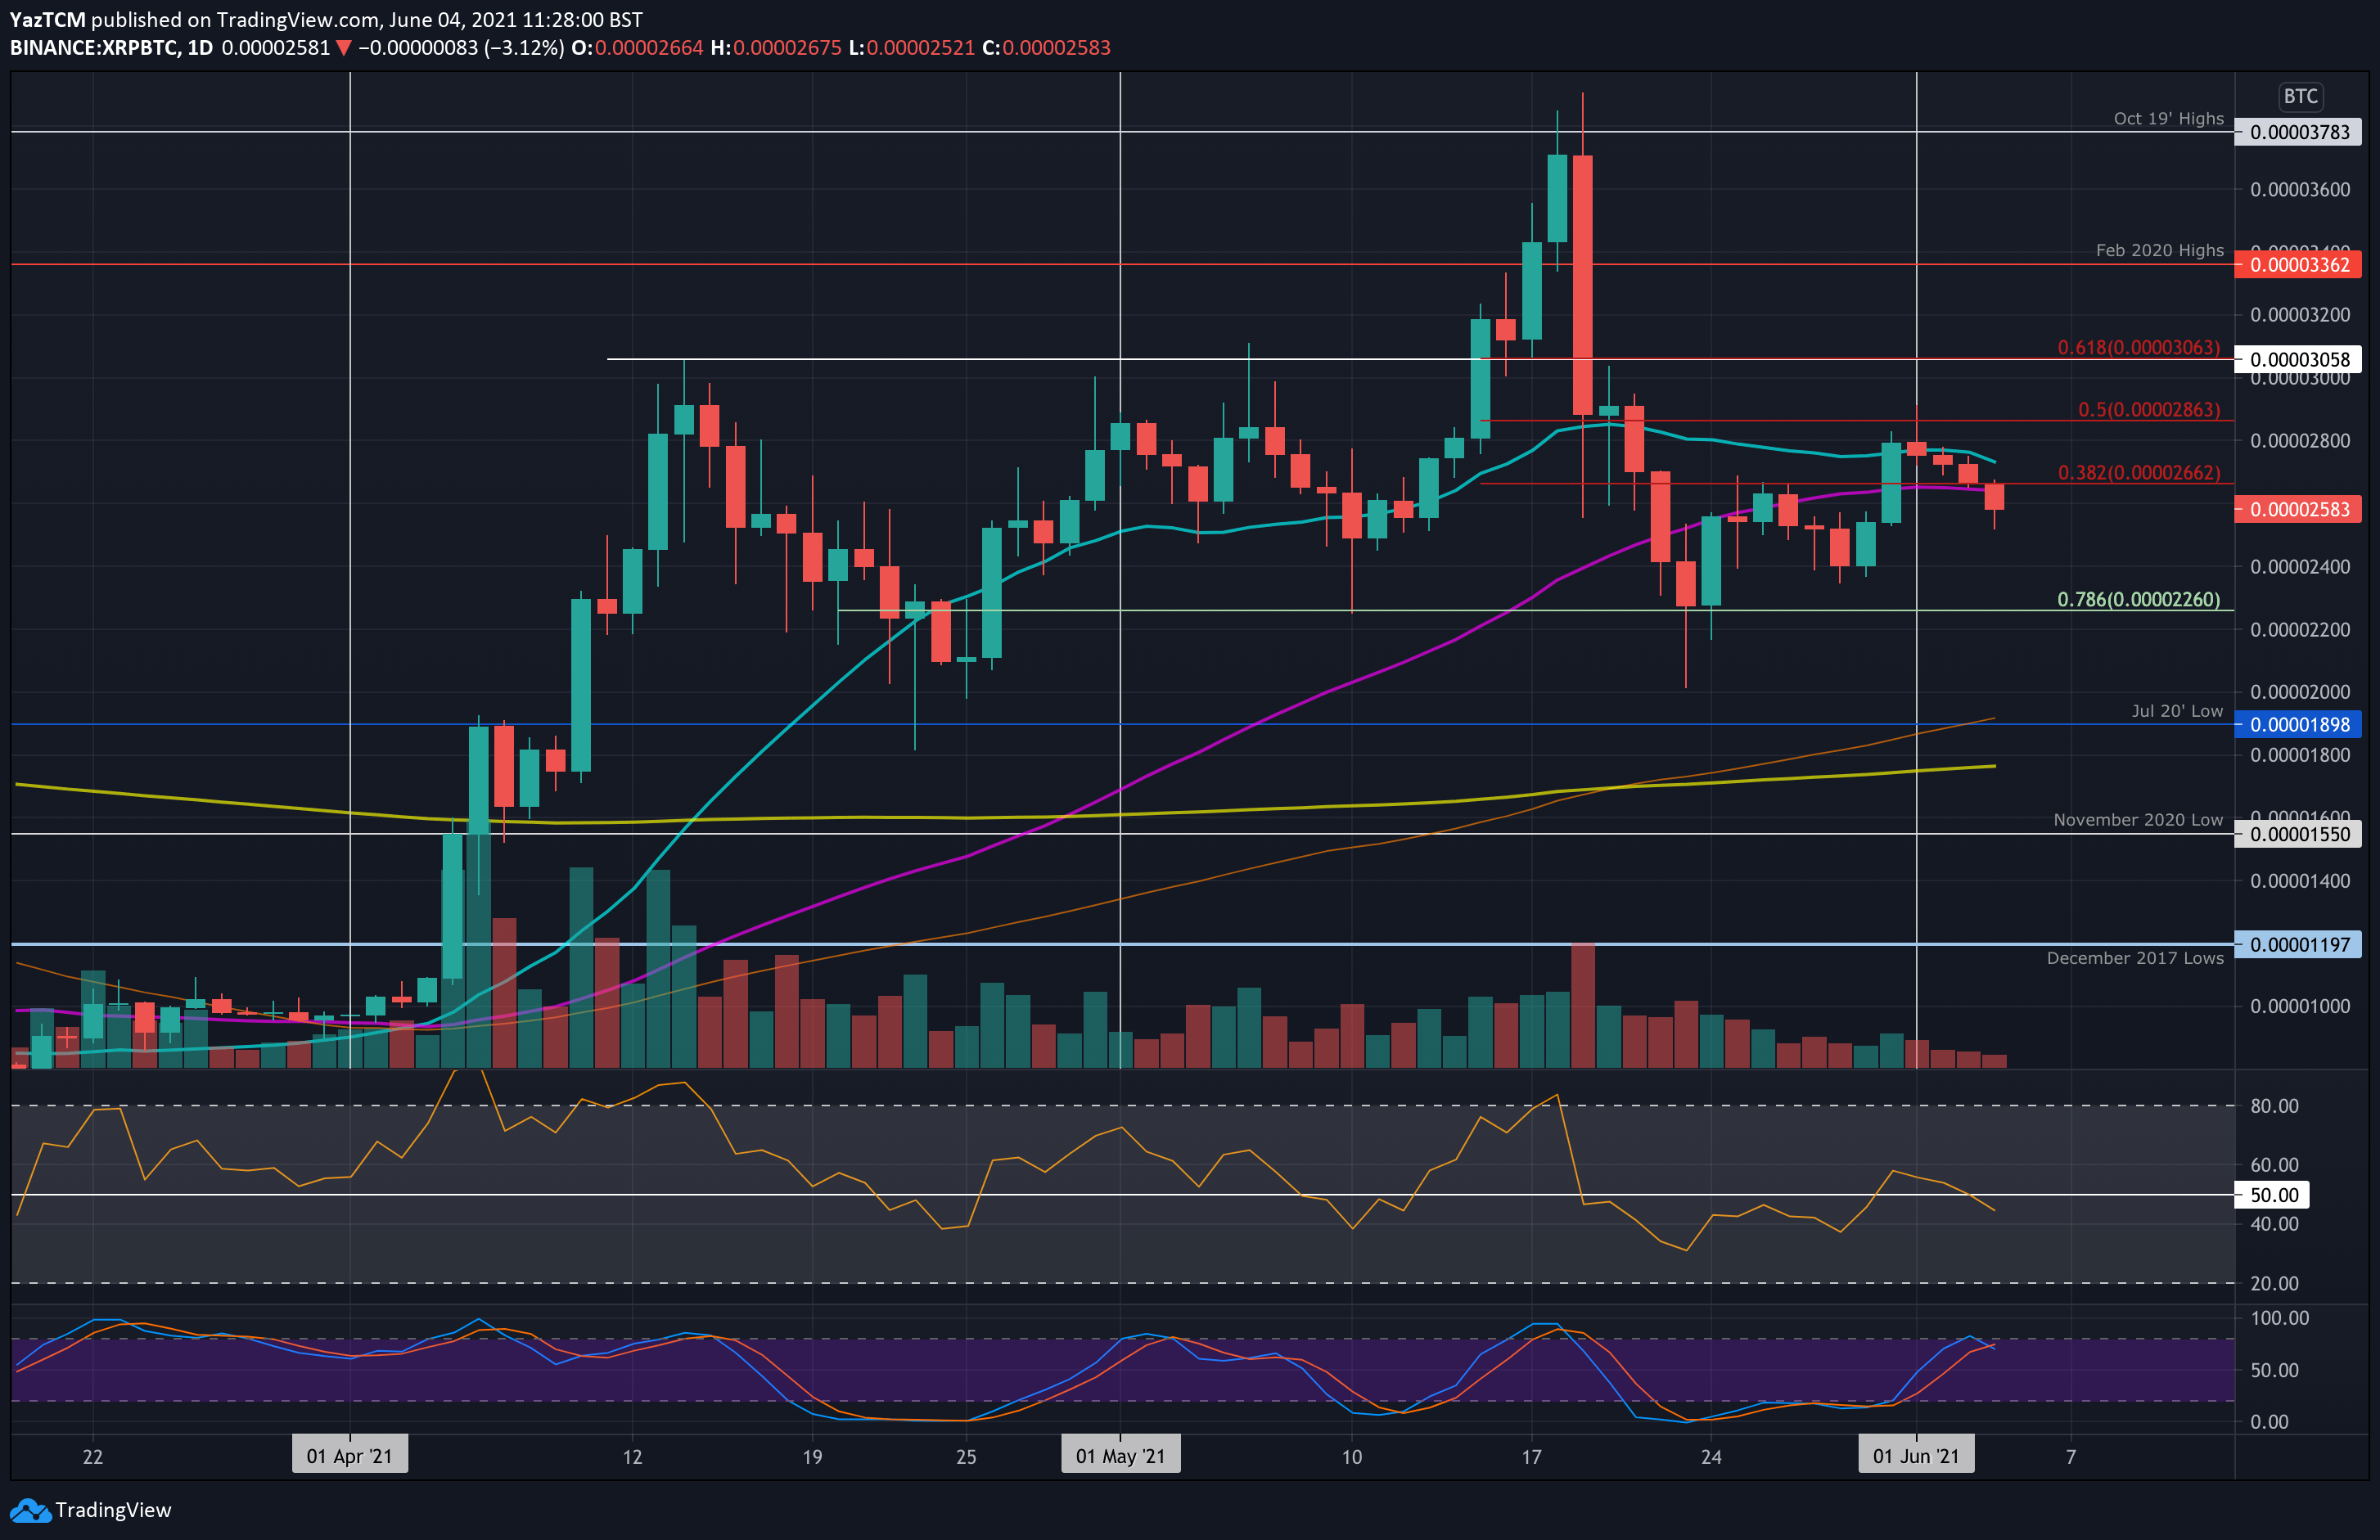
Against bitcoin, XRP bounced from the 2400 SAT support at the start of the week and pushed higher into resistance at 2800 SAT (20-day MA).
It did attempt to break this resistance but could not close a daily candle above it throughout the week. It has been slowly falling over the past three days and dropped beneath 2600 SAT and the 50-day MA today.
Moving forward, the first support lies at 2400 SAT. This is followed by 2260 SAT (.785 Fib), 2200 SAT, 2000 SAT, and 1900 SAT (July 2020 low & 100-day MA).
Alternatively, the first resistance lies at 2600 SAT (50-day MA). This is followed by 2700 SAT (20-day MA0, 2800 SAT, and 3000 SAT (bearish .618 Fib).
Cardano
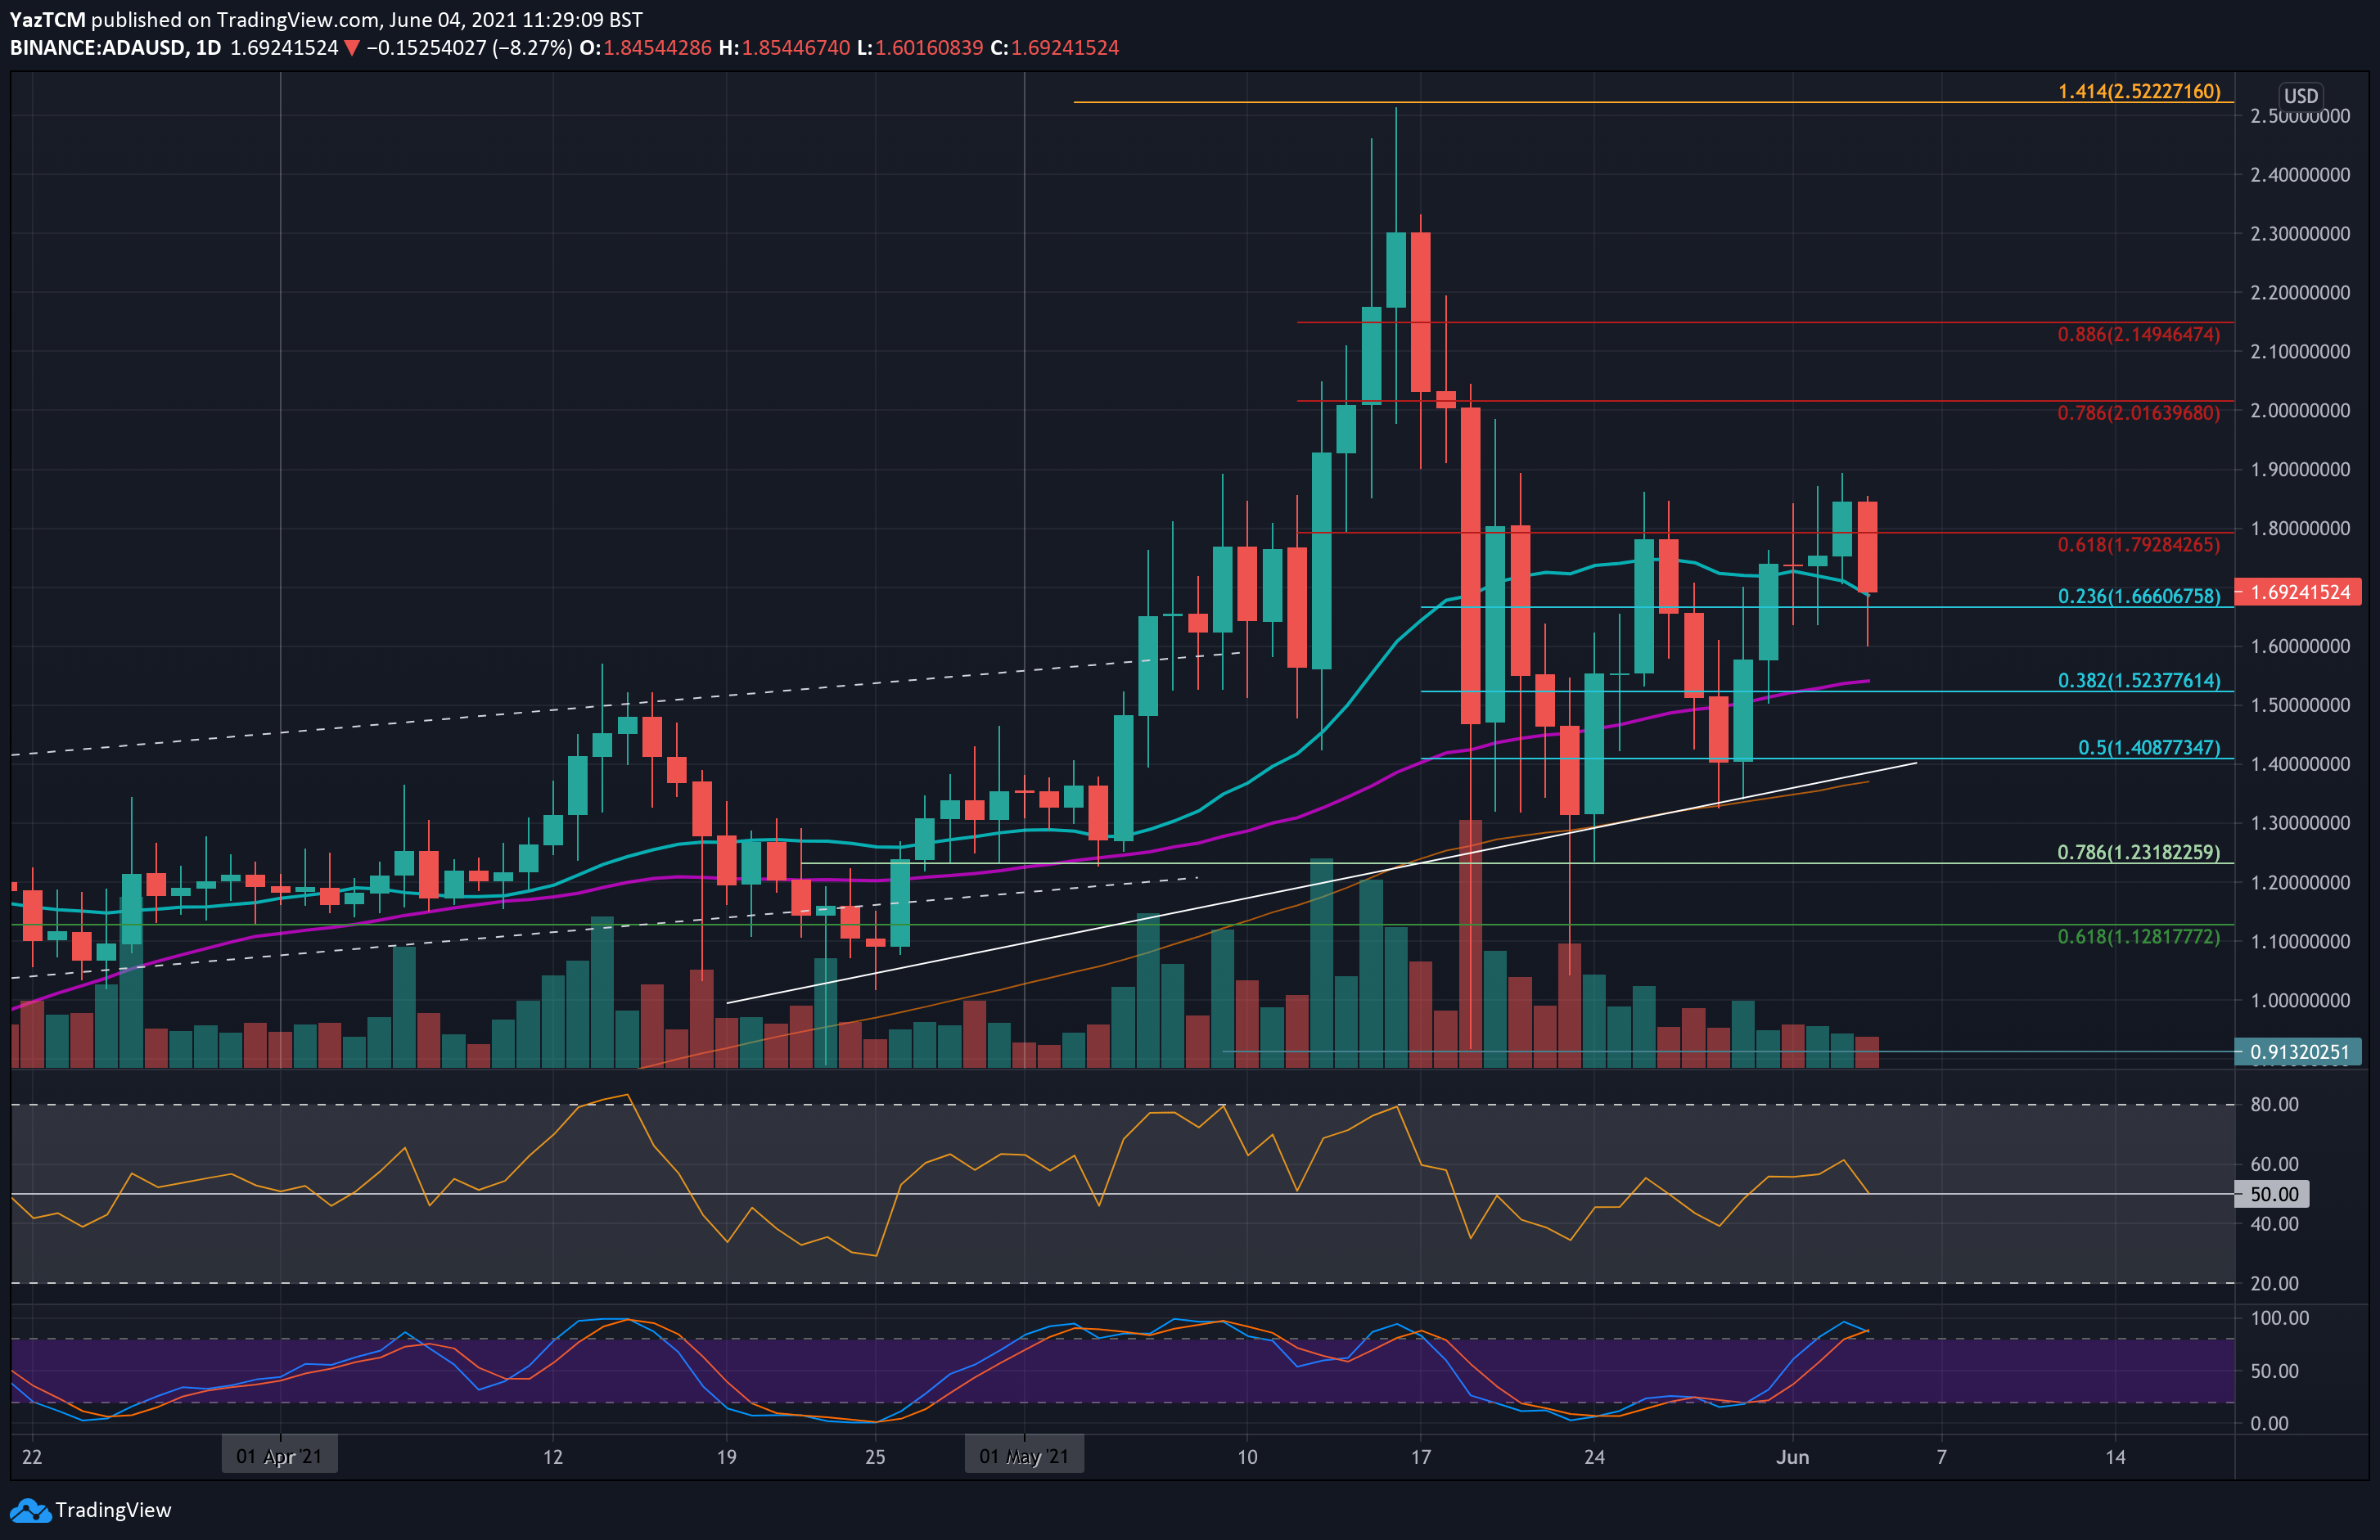
ADA saw a small 2.1% price hike this week as it currently trades at $1.70 (20-day MA). The coin found strong support at $1.40 (.5 Fib) at the start of the week and started to push higher.
Yesterday, ADA managed to penetrate last week’s resistance at $1.80 (bearish .618 Fib) and spiked as high as $1.90. Unfortunately, today’s BTC price drop caused ADA to fall back beneath this support and spike as low as $1.60. It has since recovered back above the 20-day MA.
Moving forward, if the bears break beneath the 20-day MA, the first support lies at $1.60. This is followed by $1.52 (.382 Fib & 50-day MA0, $1.40 (.5 Fib), and $1.35 (100-day MA).
On the other side, the first resistance lies at $1.80 (bearush .618 Fib). This is followed by $1.90, $2.00 (bearish .786 Fib), and $2.15 (bearish .886 Fib).
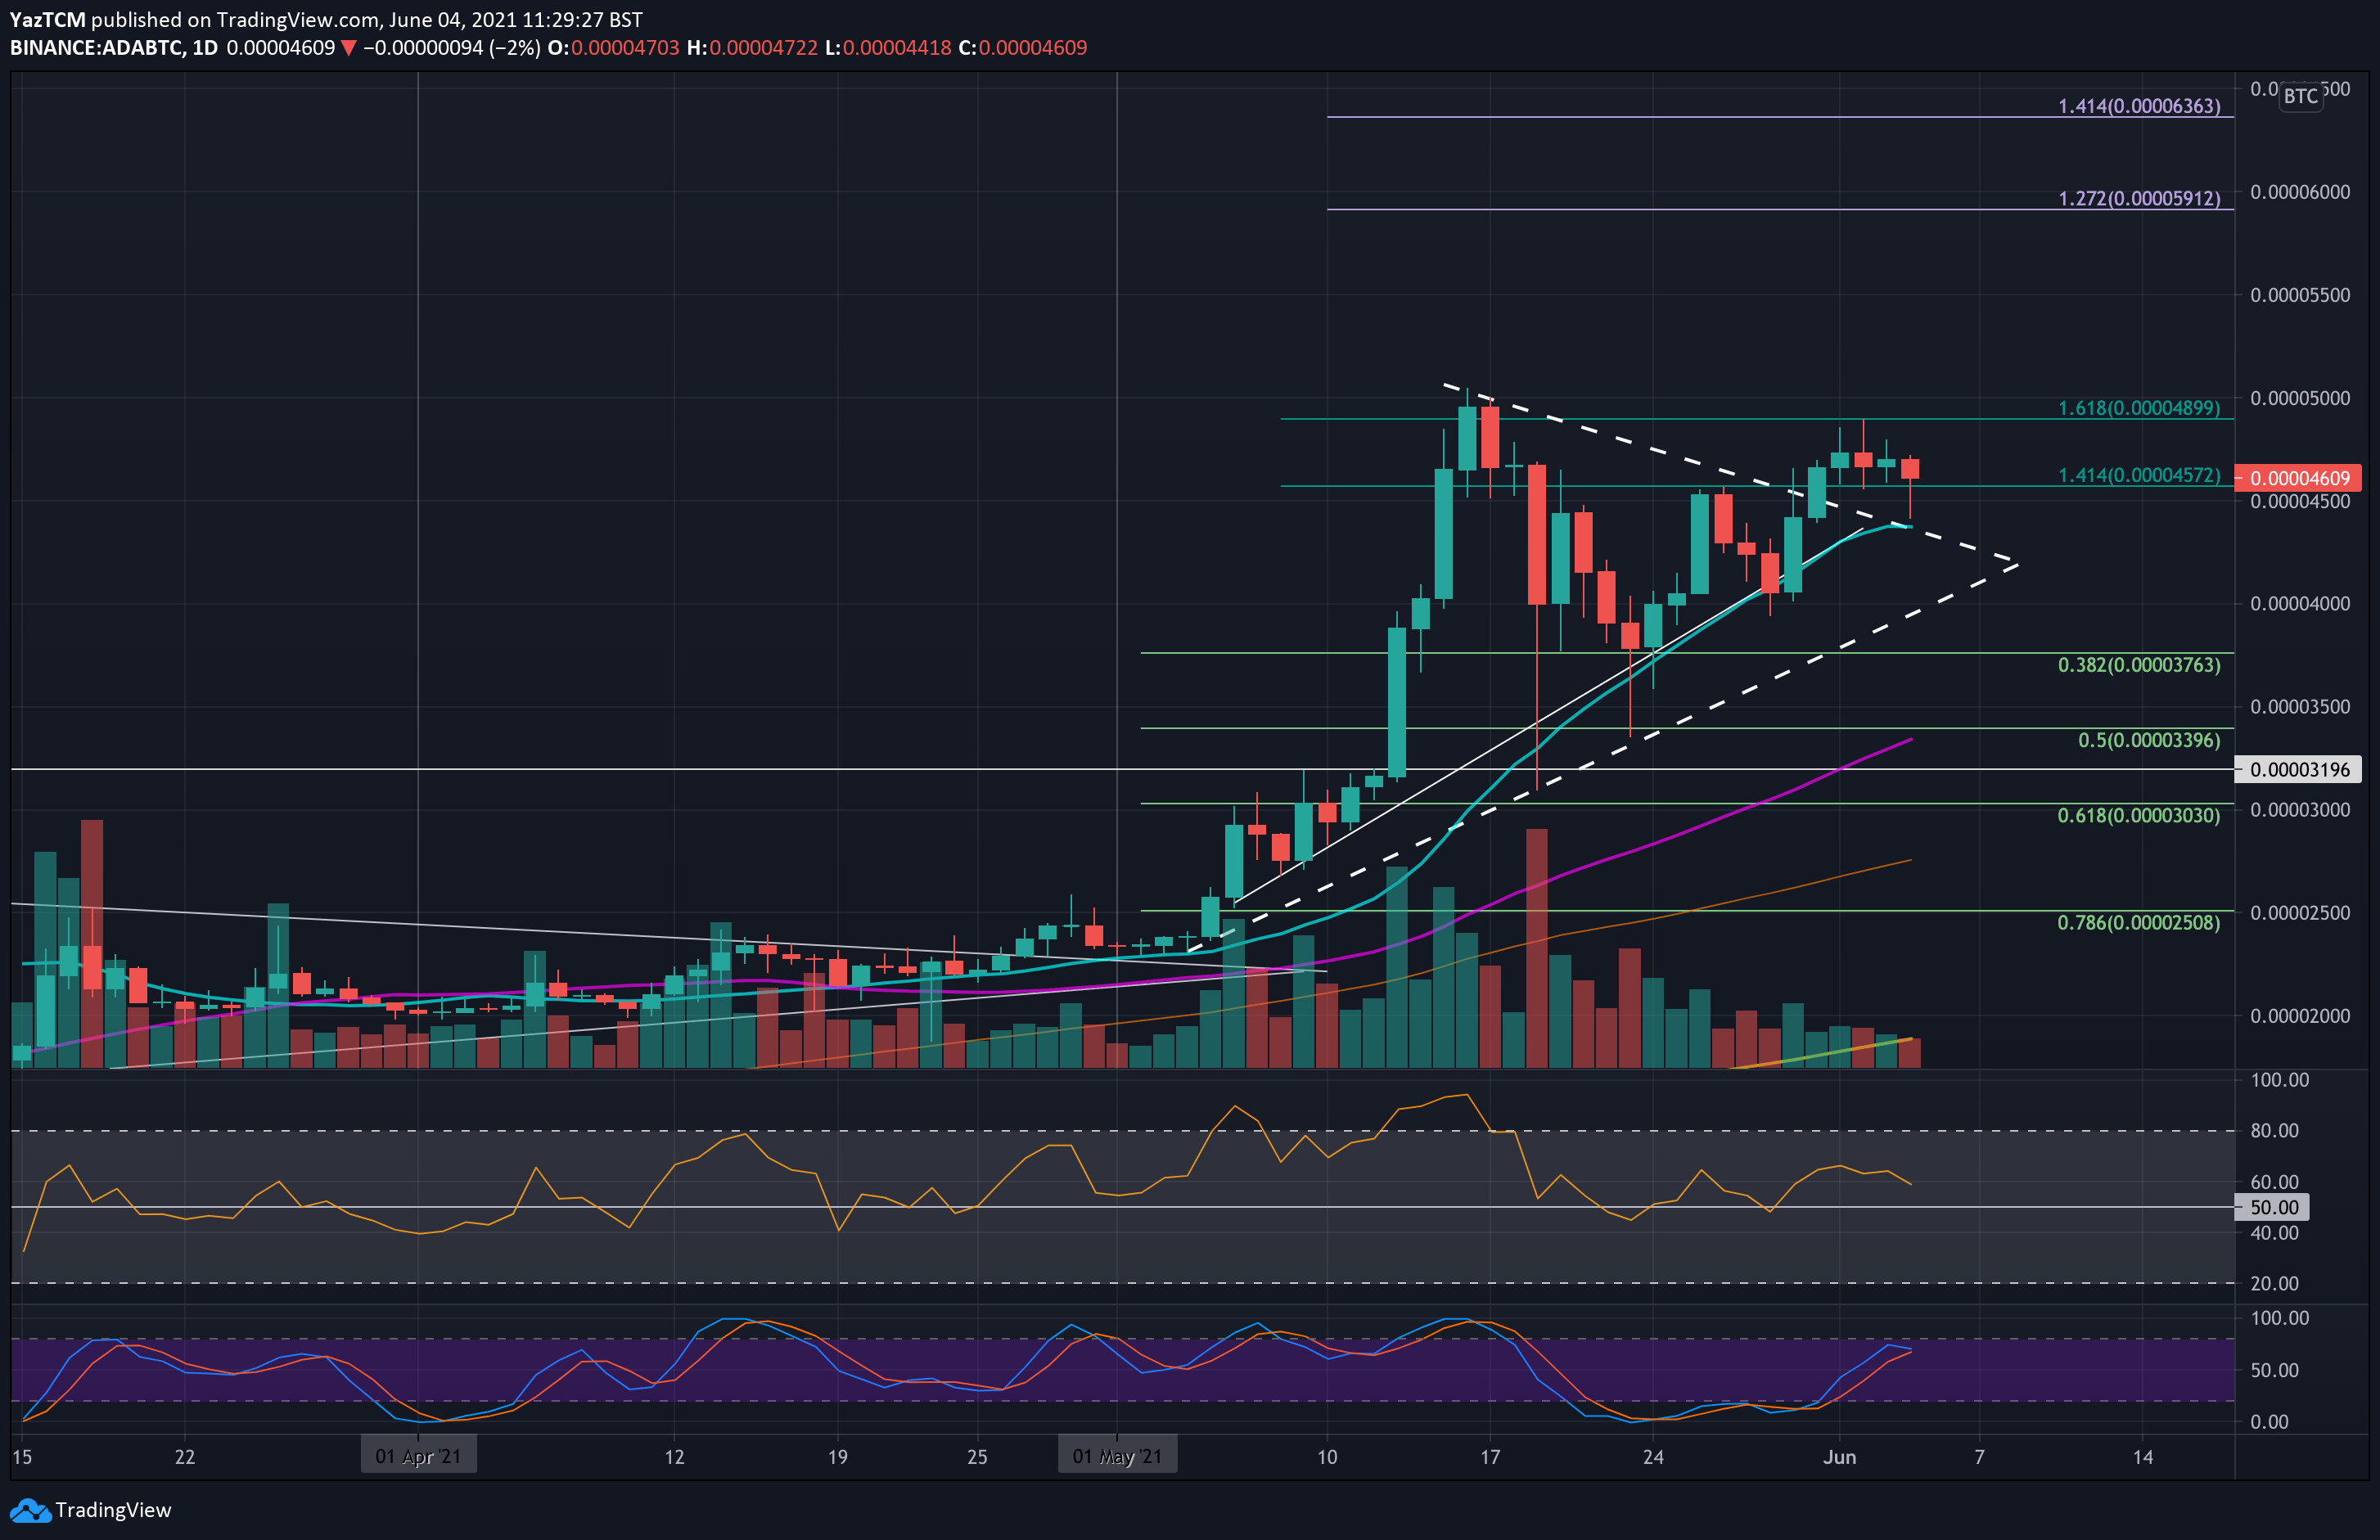
Against BTC, ADA bounced from support at 4000 SAT over the weekend and went on to break above a symmetrical triangle pattern through the week as the price pushed above 4500 SAT.
From there, ADA continued higher to test resistance at 4900 SAT (1.618 Fib Extension) but could not overcome it. Today, ADA has since dropped back into the 4570 SAT support which had previously provided resistance for the market.
Looking ahead, if the bears break 4500 SAT, the first support lies at 4400 (20-day MA). This is followed by 4200 SAT (short term .382 Fib), 4000 SAT, and 3760 SAT (.382 Fib).
On the other side, the first strong resistance lies at 4900 SAT (1.618 Fib Extension). This is followed by 5000 SAT, 5200 SAT, 5500 SAT, and 5910 SAT (1.272 Fib Extension).
Solana
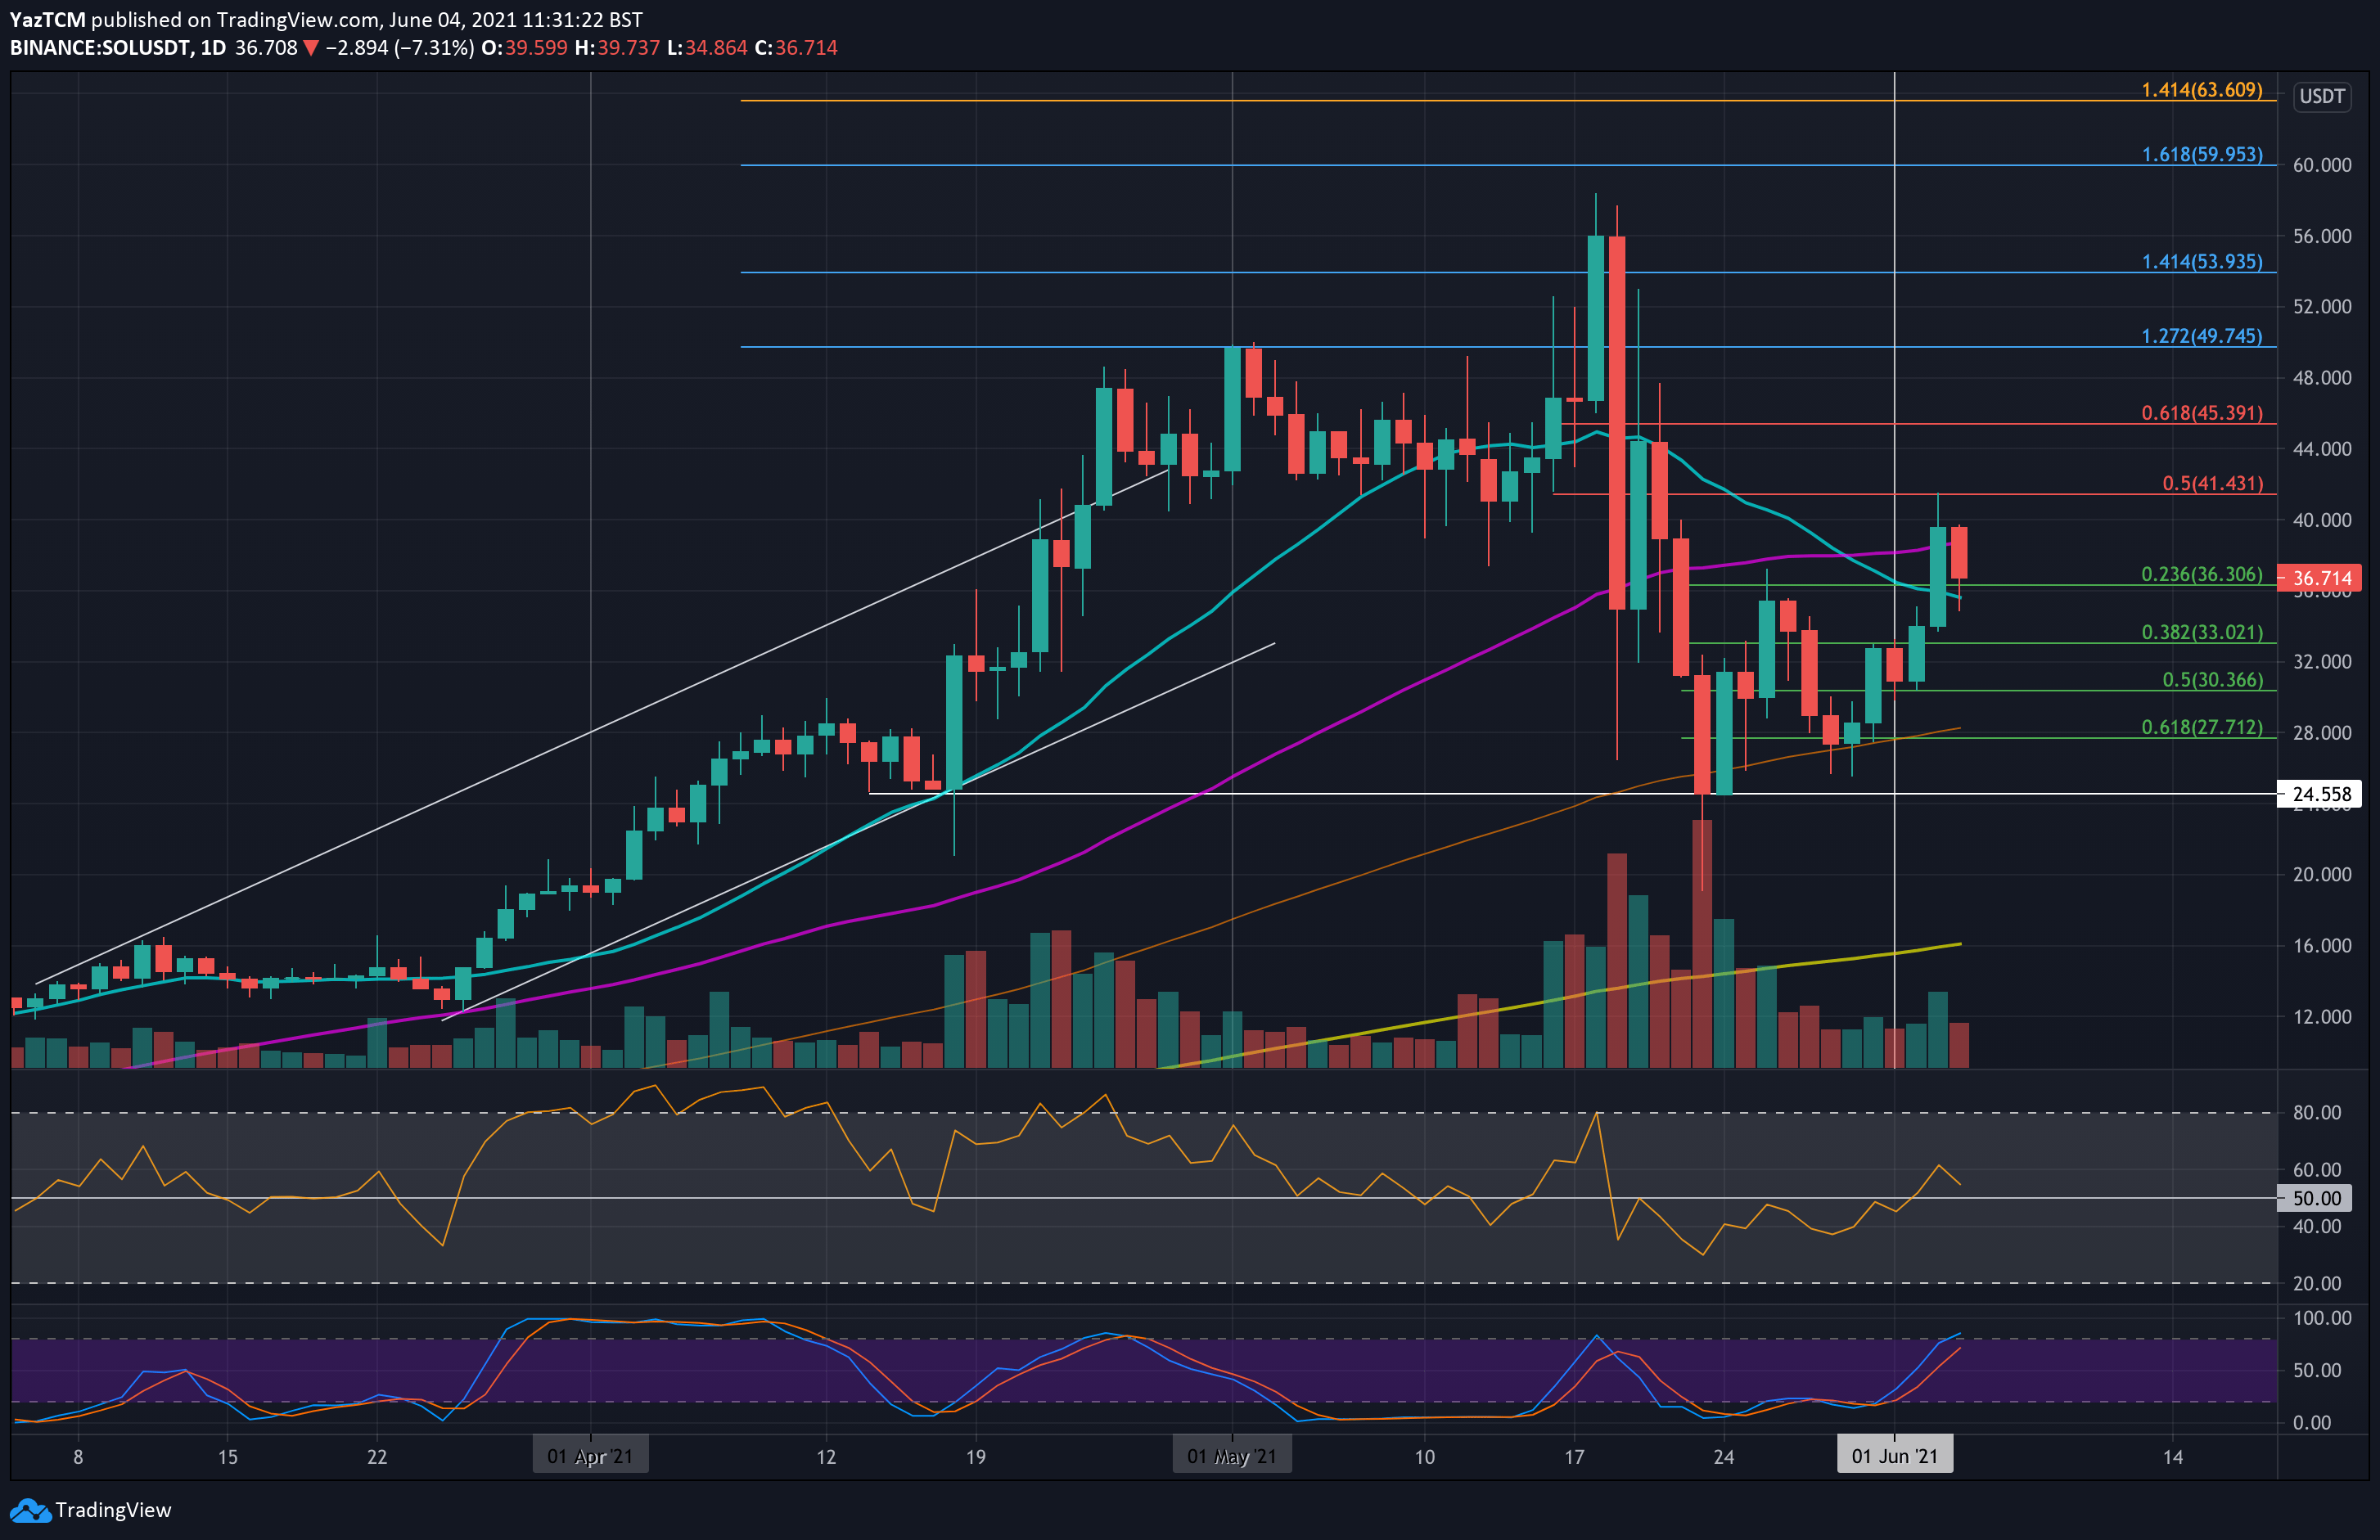
SOL saw a strong 7.5% price hike this week as the coin reached as high as $41.43. It started the week by rebounding at $28, where it found support at the 100-day MA.
Over the course of the week, SOL continued higher and eventually broke the 50-day MA yesterday to reach as high as $41.43. There, it found resistance at a bearish .5 Fib Retracement and has since dropped lower to $36.30 (.236 Fib).
Moving forward, the first support beneath $36.30 lies at $33 (.382 Fib). This is followed by $30.36 (.5 Fib), $27.71 (.618 Fib & 100-day MA), and $24.55.
On the other side, the first resistance lies at $38 (50-day MA). This is followed by $40, $41.43 (bearish .5 Fib), $44, and $45.40 (bearish .618 Fib).
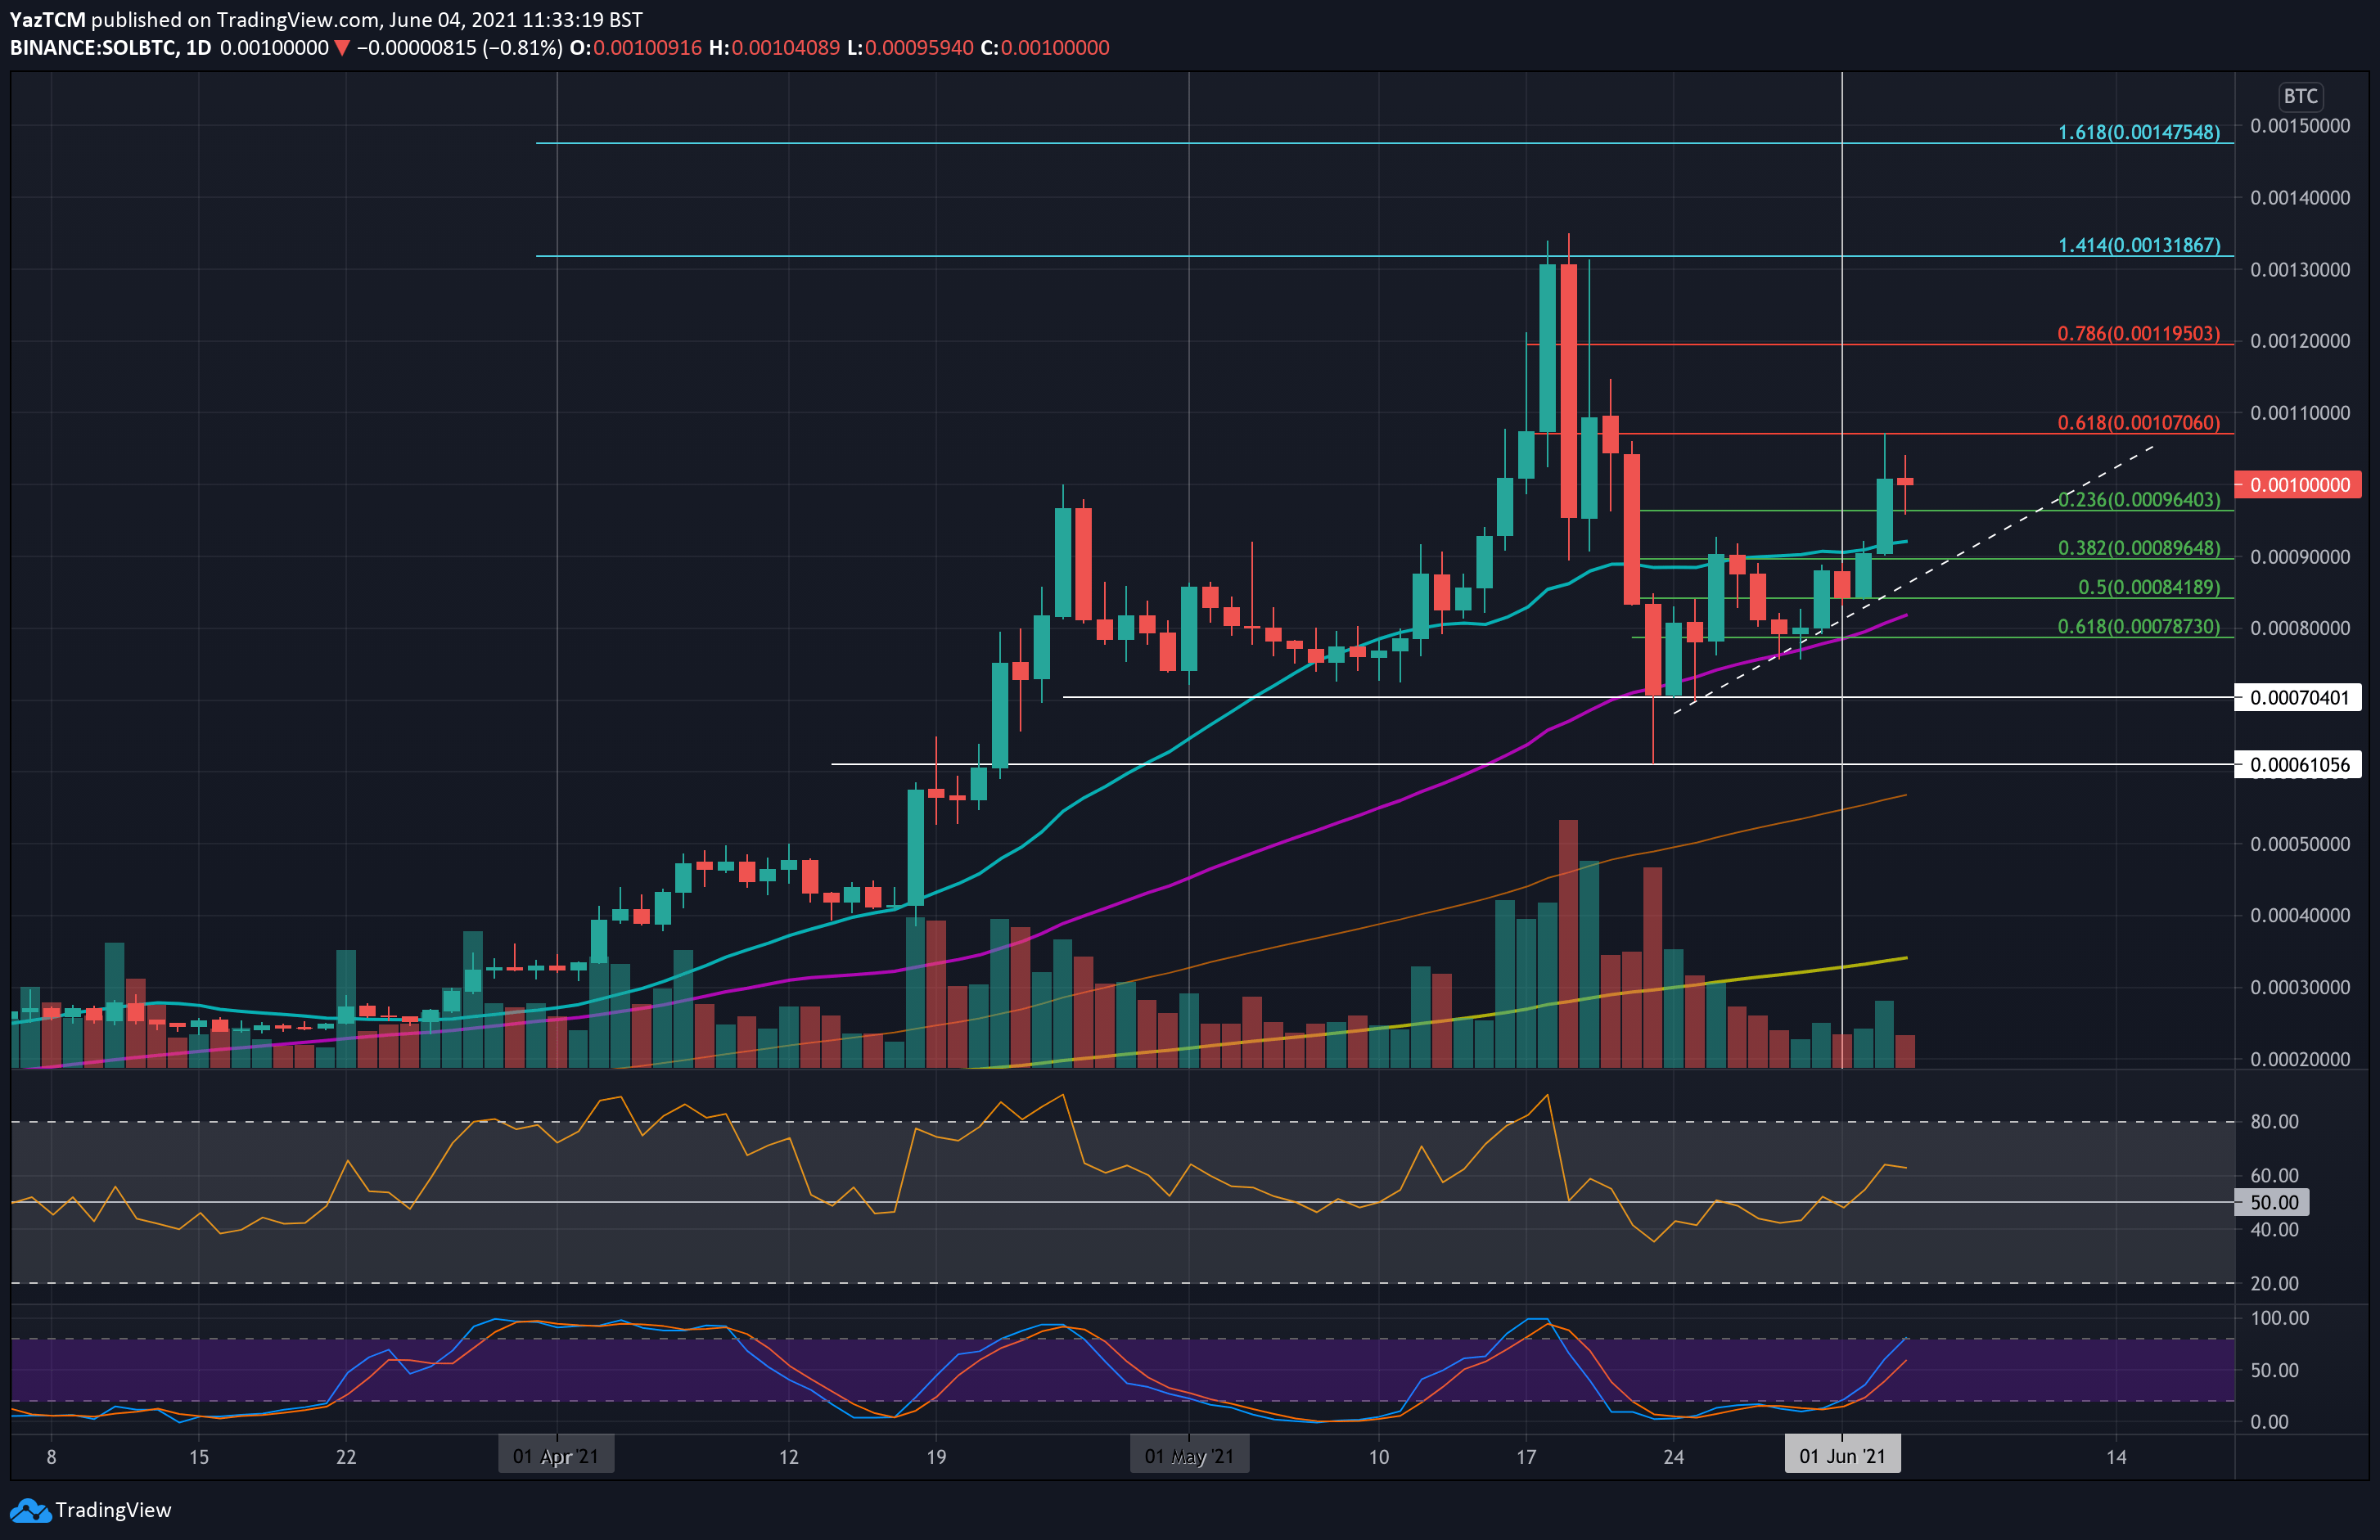
Against BTC, SOL bounced from support at 80,000 SAT (.618 Fib) at the start of the week. It managed to break resistance at the 20-day MA yesterday and continued to push higher to reach as high as 107,000 SAT.
It has since dropped to trade at 100,000 SAT today.
Looking ahead, the first support beneath 100,000 SAT lies at 96,400 SAT(.236 Fib). This is followed by 90,000 SAT (.382 Fib & 20-day MA), 84,200 SAT (.5 Fib), and 80,000 SAT.
On the other side, the first resistance lies at 107,000 SAT (bearish .618 Fib). This is followed by 119,500 SAT (bearish .786 Fib), 131,870 SAT (1.414 Fib Extension), and 140,000 SAT.