We saw a rollercoaster of price action over the past seven days as Bitcoin went to set a new all-time high slightly below K, only to retrace to about K a couple of days later. Most of the altcoins followed suit, though some came out of it better than others.BitcoinBitcoin is up by a small 2% over the past week as it trades at the ,000 level. The cryptocurrency had surged higher last weekend to set a new ATH at ,781. It was trading inside an ascending price channel for the majority of March until it hit the ATH over the weekend.From there, Bitcoin started to fall at the beginning of the week. Initially, it found support at ,465 (.382 Fib) on Monday but continued to spike lower into ,500 (.5 Fib) on Tuesday. Luckily, the daily candle for Tuesday closed above ,465, and it
Topics:
Yaz Sheikh considers the following as important: ADABTC, ADAUSD, Binance Coin (BNB) Price, Bitcoin (BTC) Price, BNBBTC, bnbusd, BTCEUR, BTCGBP, btcusd, btcusdt, Cardano (ADA) Price, ETH Analysis, ETHBTC, Ethereum (ETH) Price, ethusd, Price Analysis, Ripple (XRP) Price, XRP Analysis, xrpbtc, xrpusd
This could be interesting, too:
Chayanika Deka writes XRP, SOL, and ADA Inclusion in US Crypto Reserve Pushes Traders on Edge
Chayanika Deka writes Why Arthur Hayes Is Bullish on Bitcoin Under Trump’s Economic Strategy
Mandy Williams writes Why the Bitcoin Market Is Stuck—and the Key Metric That Could Change It: CryptoQuant CEO
Wayne Jones writes Metaplanet Acquires 156 BTC, Bringing Total Holdings to 2,391
We saw a rollercoaster of price action over the past seven days as Bitcoin went to set a new all-time high slightly below $62K, only to retrace to about $53K a couple of days later. Most of the altcoins followed suit, though some came out of it better than others.
Bitcoin
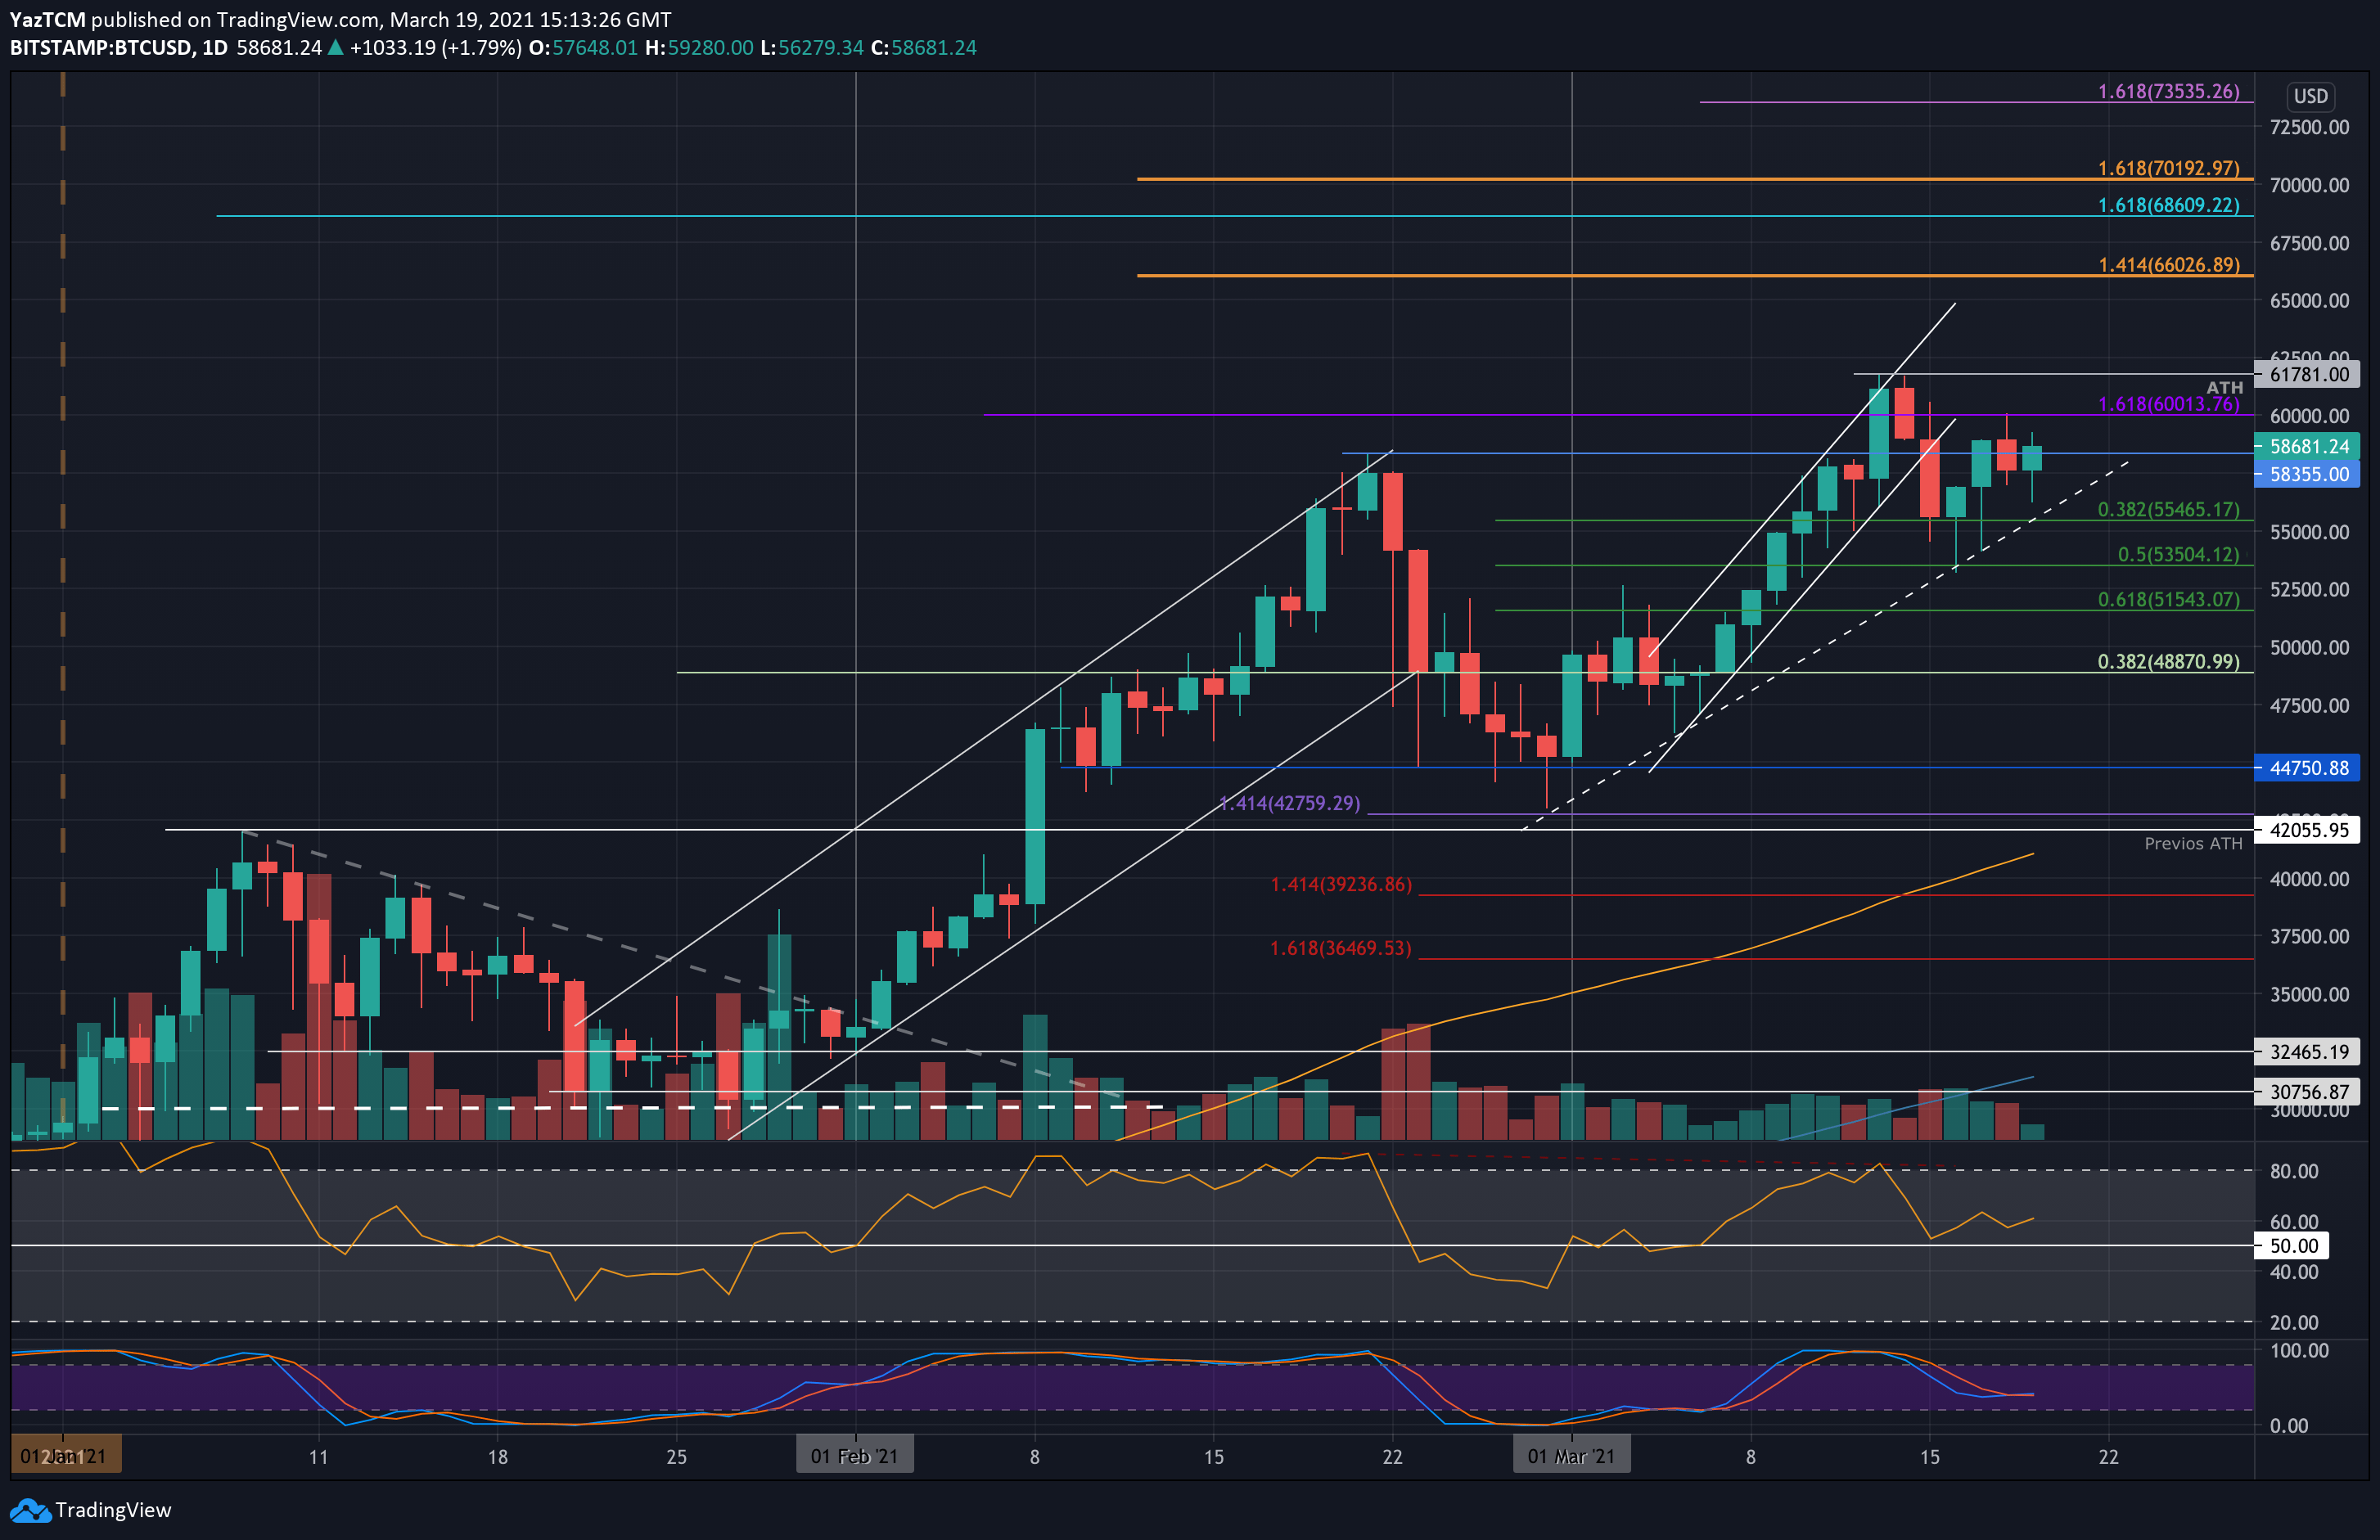
Bitcoin is up by a small 2% over the past week as it trades at the $59,000 level. The cryptocurrency had surged higher last weekend to set a new ATH at $61,781. It was trading inside an ascending price channel for the majority of March until it hit the ATH over the weekend.
From there, Bitcoin started to fall at the beginning of the week. Initially, it found support at $55,465 (.382 Fib) on Monday but continued to spike lower into $53,500 (.5 Fib) on Tuesday. Luckily, the daily candle for Tuesday closed above $55,465, and it allowed BTC to rebound from there,
Yesterday, BTC spiked higher to $60,000 but eventually closed the daily candle at $58,000. Today, it is now pushing $59,000.
Looking ahead, the first level of strong resistance lies at $60,000. This is followed by $61,780 (ATH price) and $62,500. Additional resistance lies at $65,000, $66,000, and $67,500.
On the other side, the first level of support lies at $58,000. This is followed by $55,465 (.382 Fib), $55,000, $53,500 (.5 Fib), and $51,540 (.618 Fib).
Ethereum
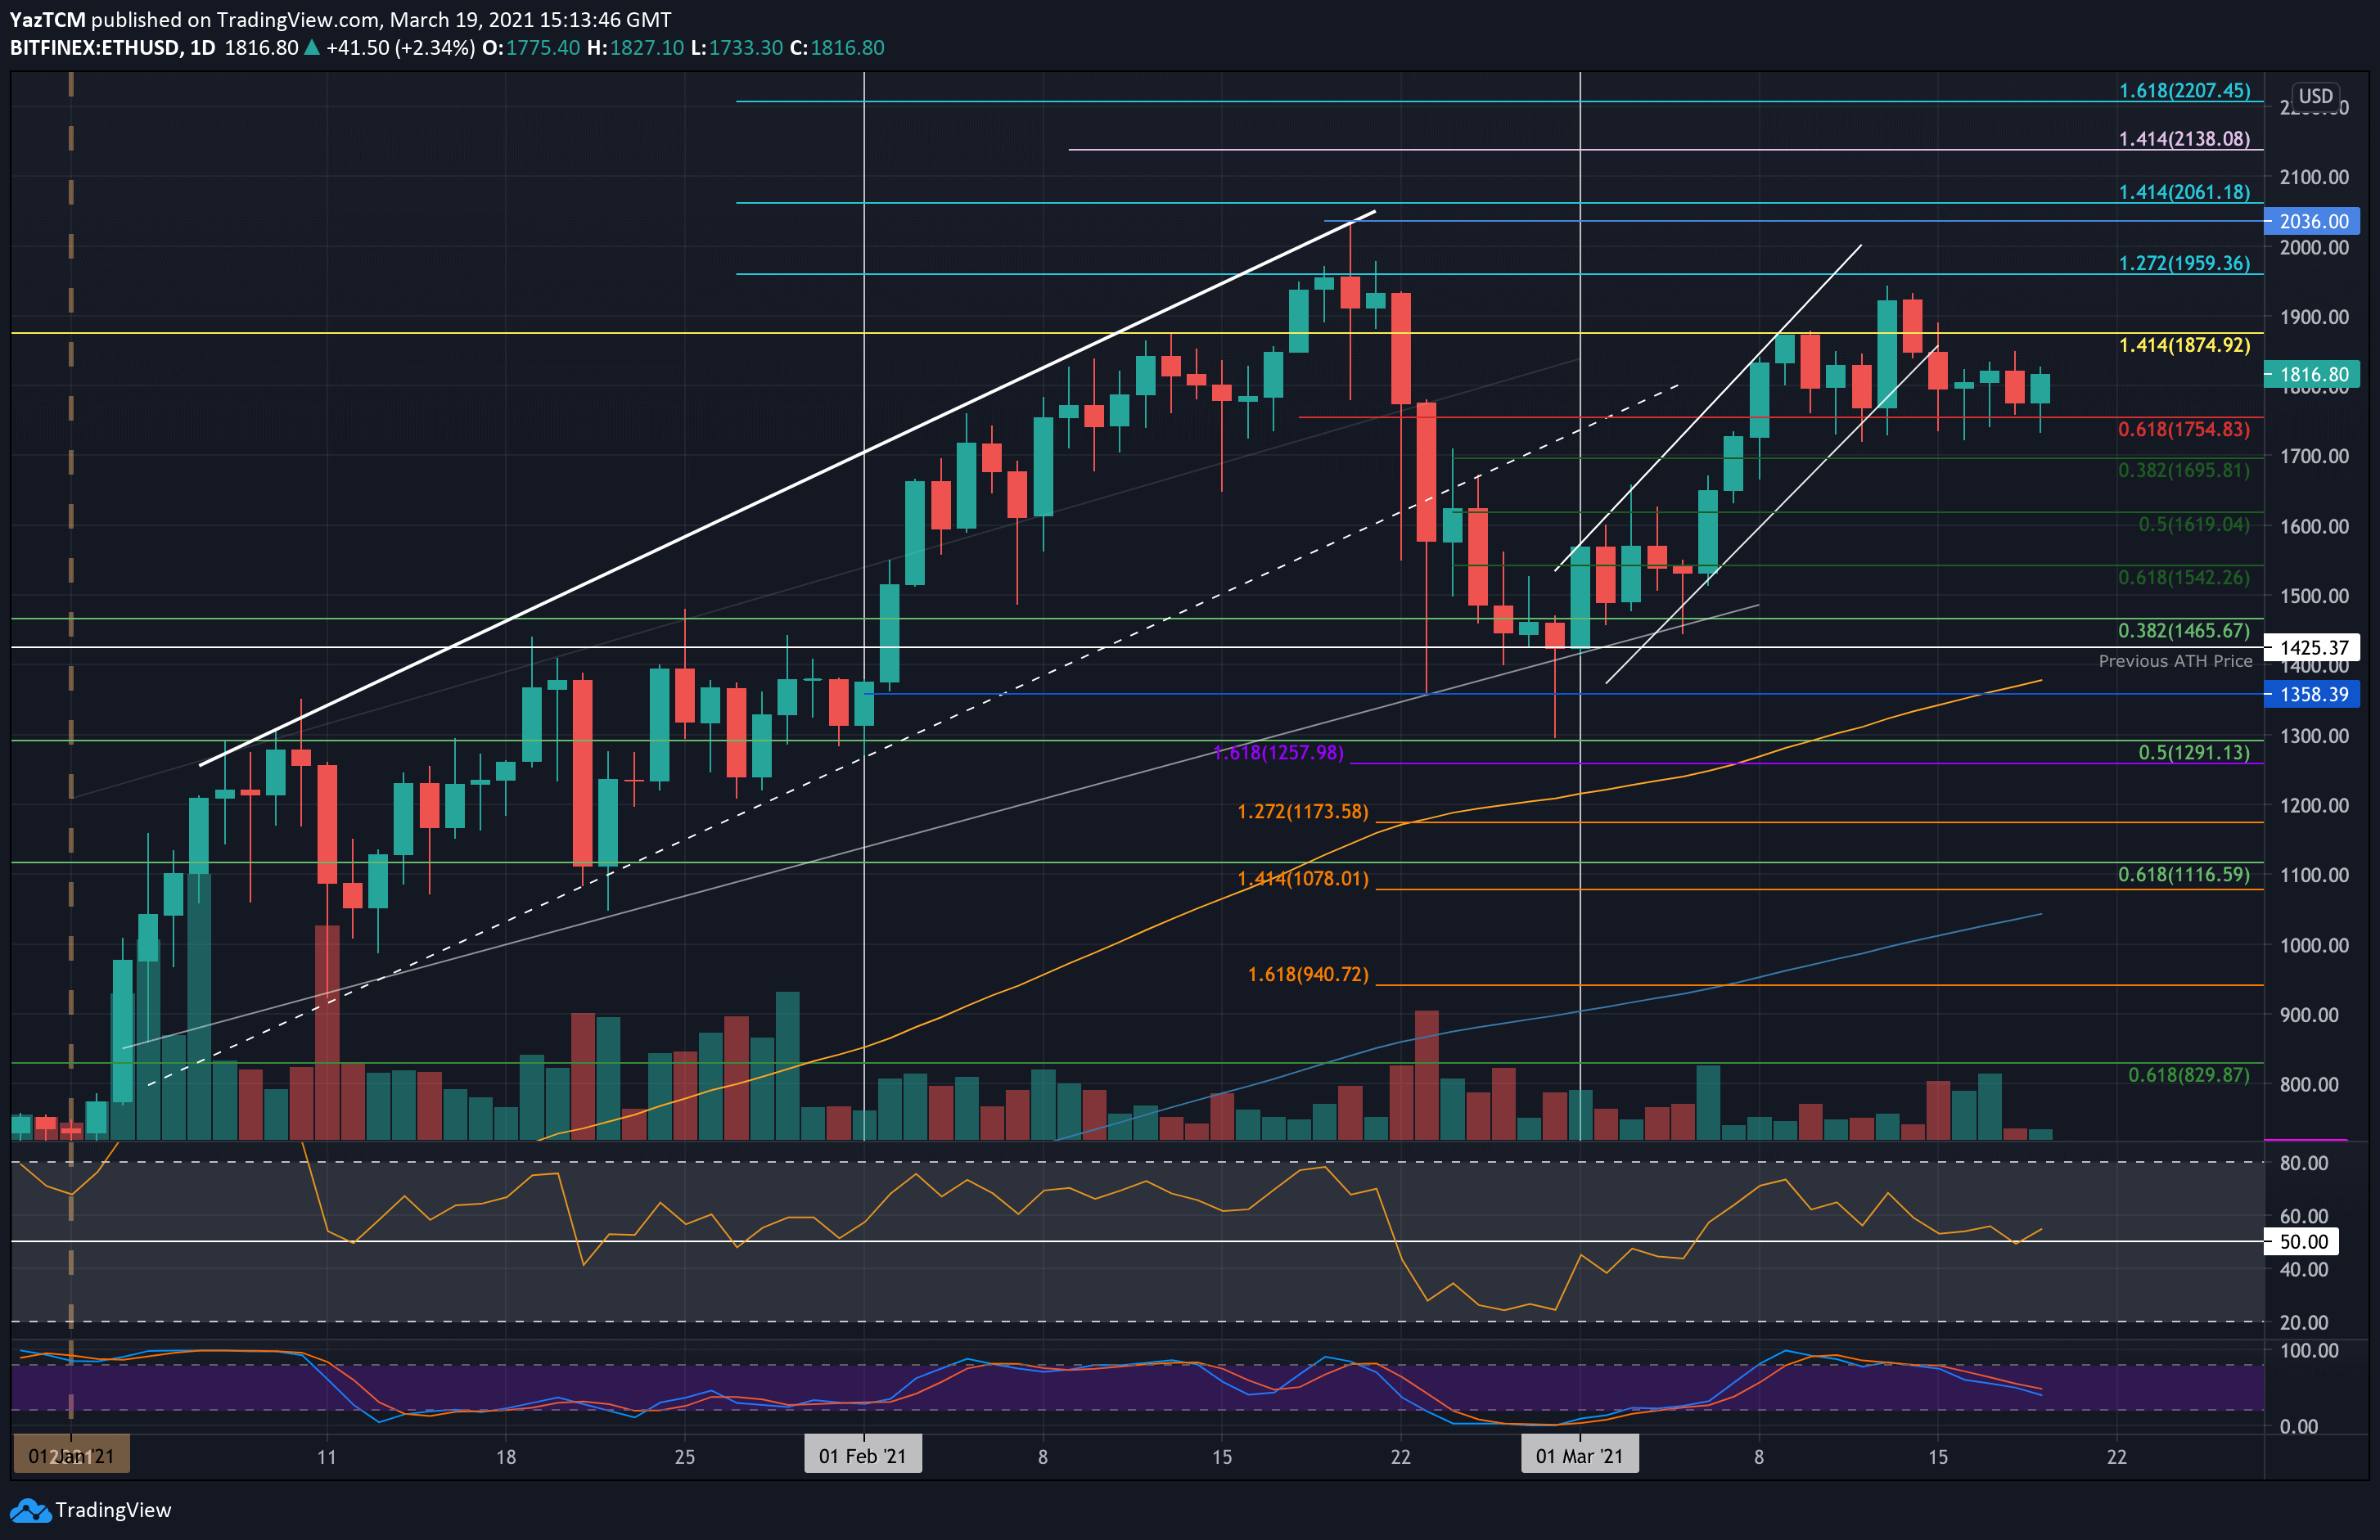
Ethereum pretty much moved sideways this week as it trades along with the support at $1755. The coin was trading at this level last Friday but managed to spike above $ 1900 over the weekend. However, as Bitcoin started to drop on Monday, Etheruem also headed lower until finding support at $1755.
It has now traded between $1755 and $1875 for the past fortnight (besides the weekend spike higher) and must break this range to dictate the next direction for the market.
Looking ahead, the first level of resistance lies at $1875 (1.414 Fib Extension – yellow). This is followed by resistance at $1900, $1960 (1.272 Fib Extension & All-time high day closing price), $2000, and $2036 (ATH).
On the other side, the first level of support lies at $1755. This is followed by $1695 (.382 Fib), $1620 (.5 Fib), $1540 (.618 Fib), and $1425 (previous ATH).
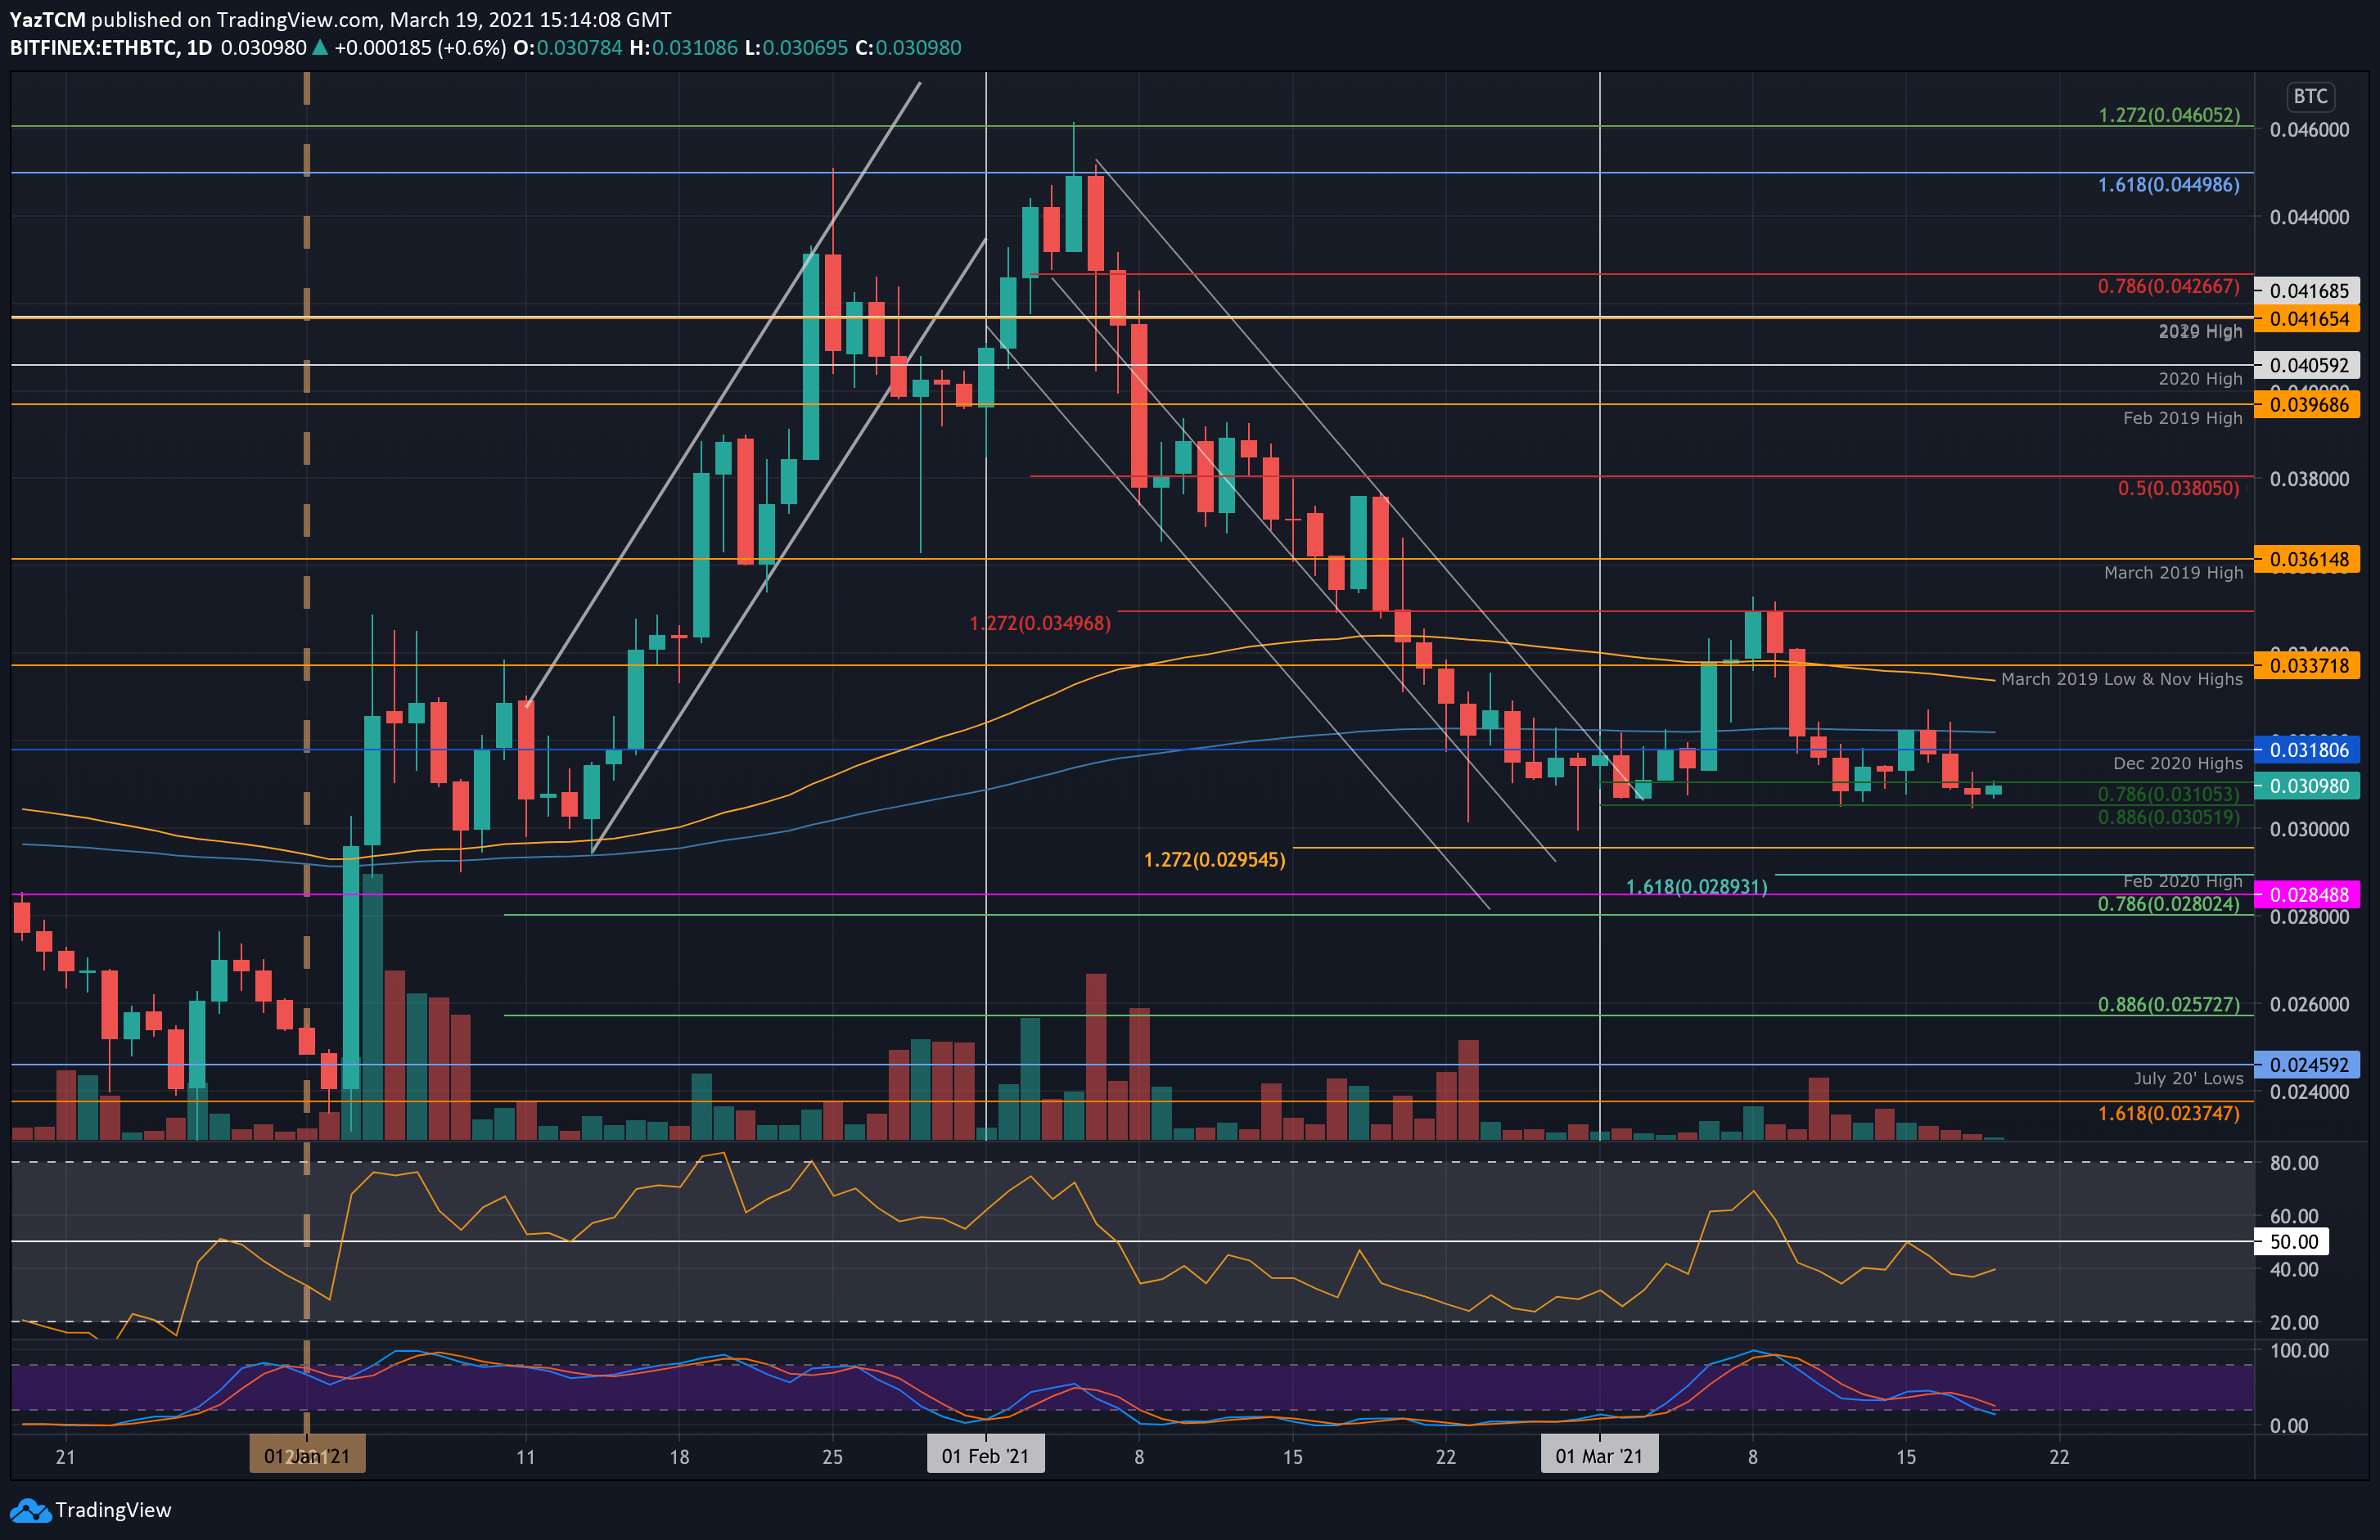
Etheruem has also moved sideways this past week against BTC. It was trading at support around 0.0305 BTC last Friday but managed to push into the resistance at the 200-day EMA during the week. Unfortunately, it could not close a daily candle above the 200-day EMA at around 0.0321 BTC and ended up rolling over the past few days.
It dropped until support was found at 0.0305 BTC again yesterday and has since pushed slightly higher to 0.0309 BTC.
Looking ahead, the first level of resistance lies at 0.0318 BTC (Dec 2020 highs). This is followed by resistance at 0.0321 (200-days EMA), 0.0337 BTC (March 2019 lows & 100-days EMA), and 0.035 BTC (March resistance).
On the other side, the first level of support lies at 0.035 BTC (.886 Fib). This is followed by 0.03 BTC, 0.0295 BTC, 0.0289 BTC, and 0.0284 BTC (Feb 2020 Highs).
Ripple
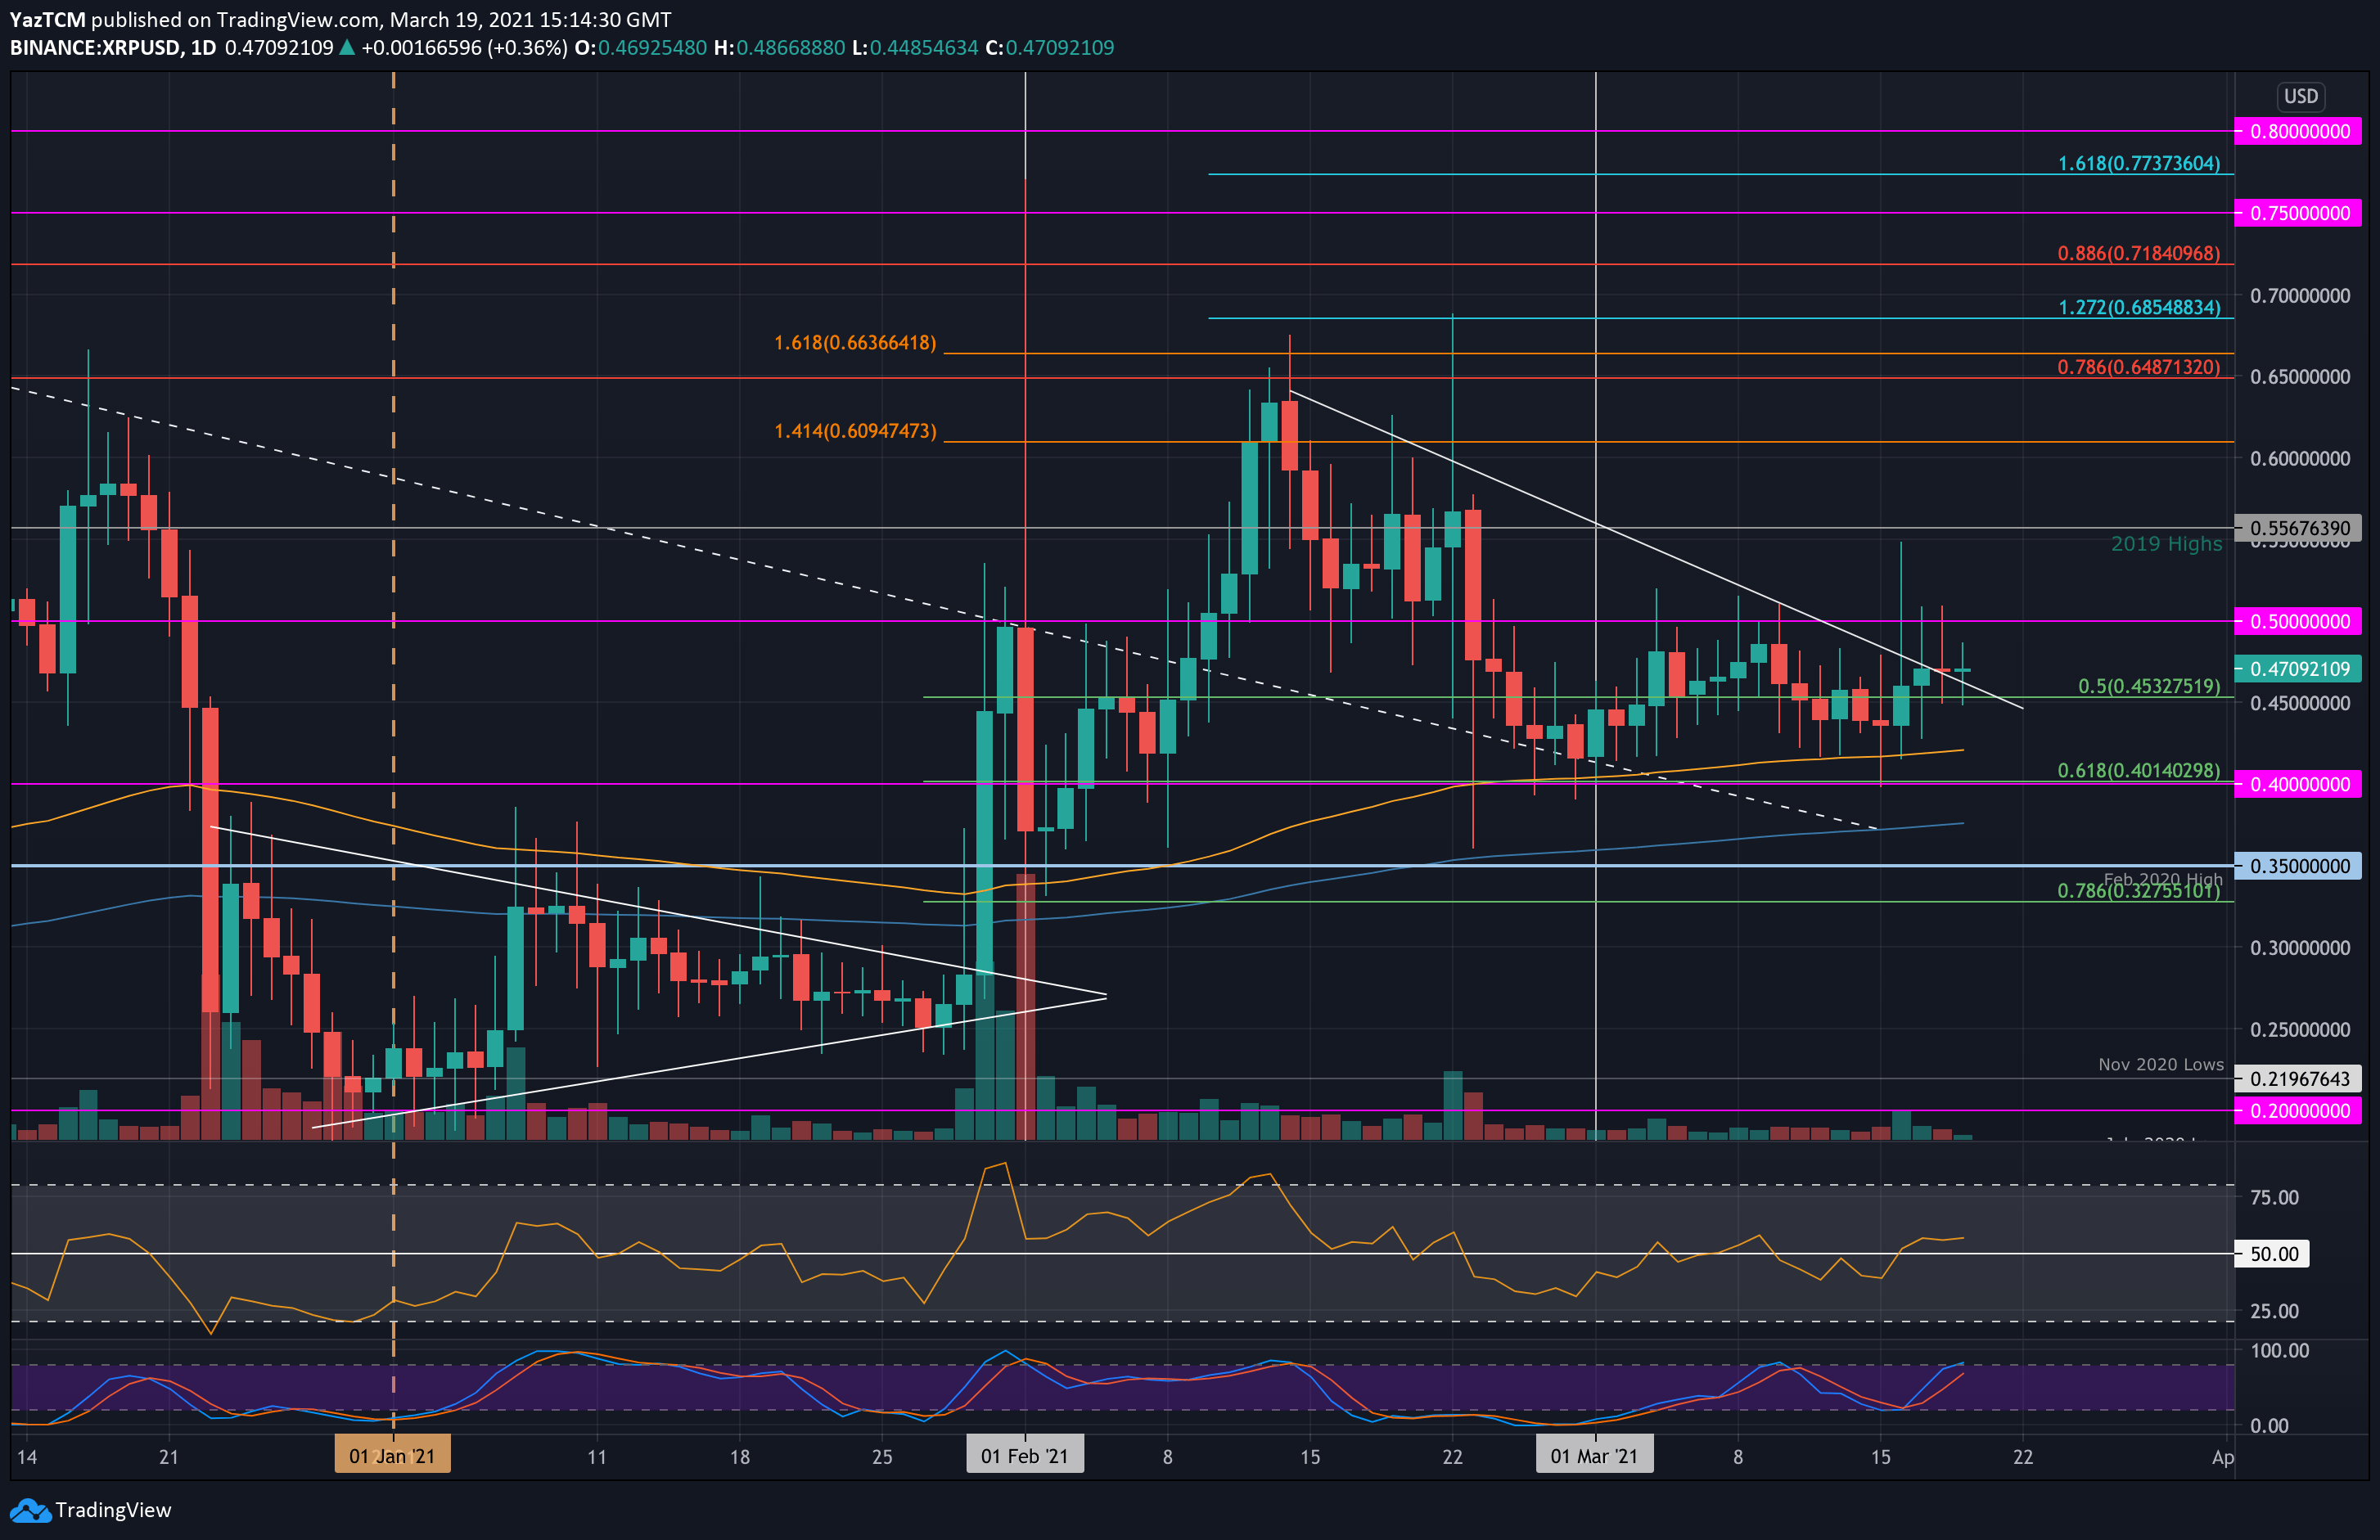
XRP saw a small 4.5% price hike this week as it currently trades at $0.47. The cryptocurrency fell beneath $0.45 last week as it found support at the 100-day EMA at around $0.42. Throughout the week, XRP started to push higher and even managed to spike higher above $0.5 on Tuesday.
Unfortunately, it was unable to sustain these highs and has since dropped to $0.45.
Looking ahead, the first level of resistance lies at $0.5. This is followed by $0.556 (2019 highs), $0.6, and $0.647 (bearish .786 Fib Retracement).
On the other side, the first support lies at $0.452 (.5 Fib). This is followed by $0.42 (100-days EMA), $0.401 (.618 Fib), and $0.37 (200-days EMA).
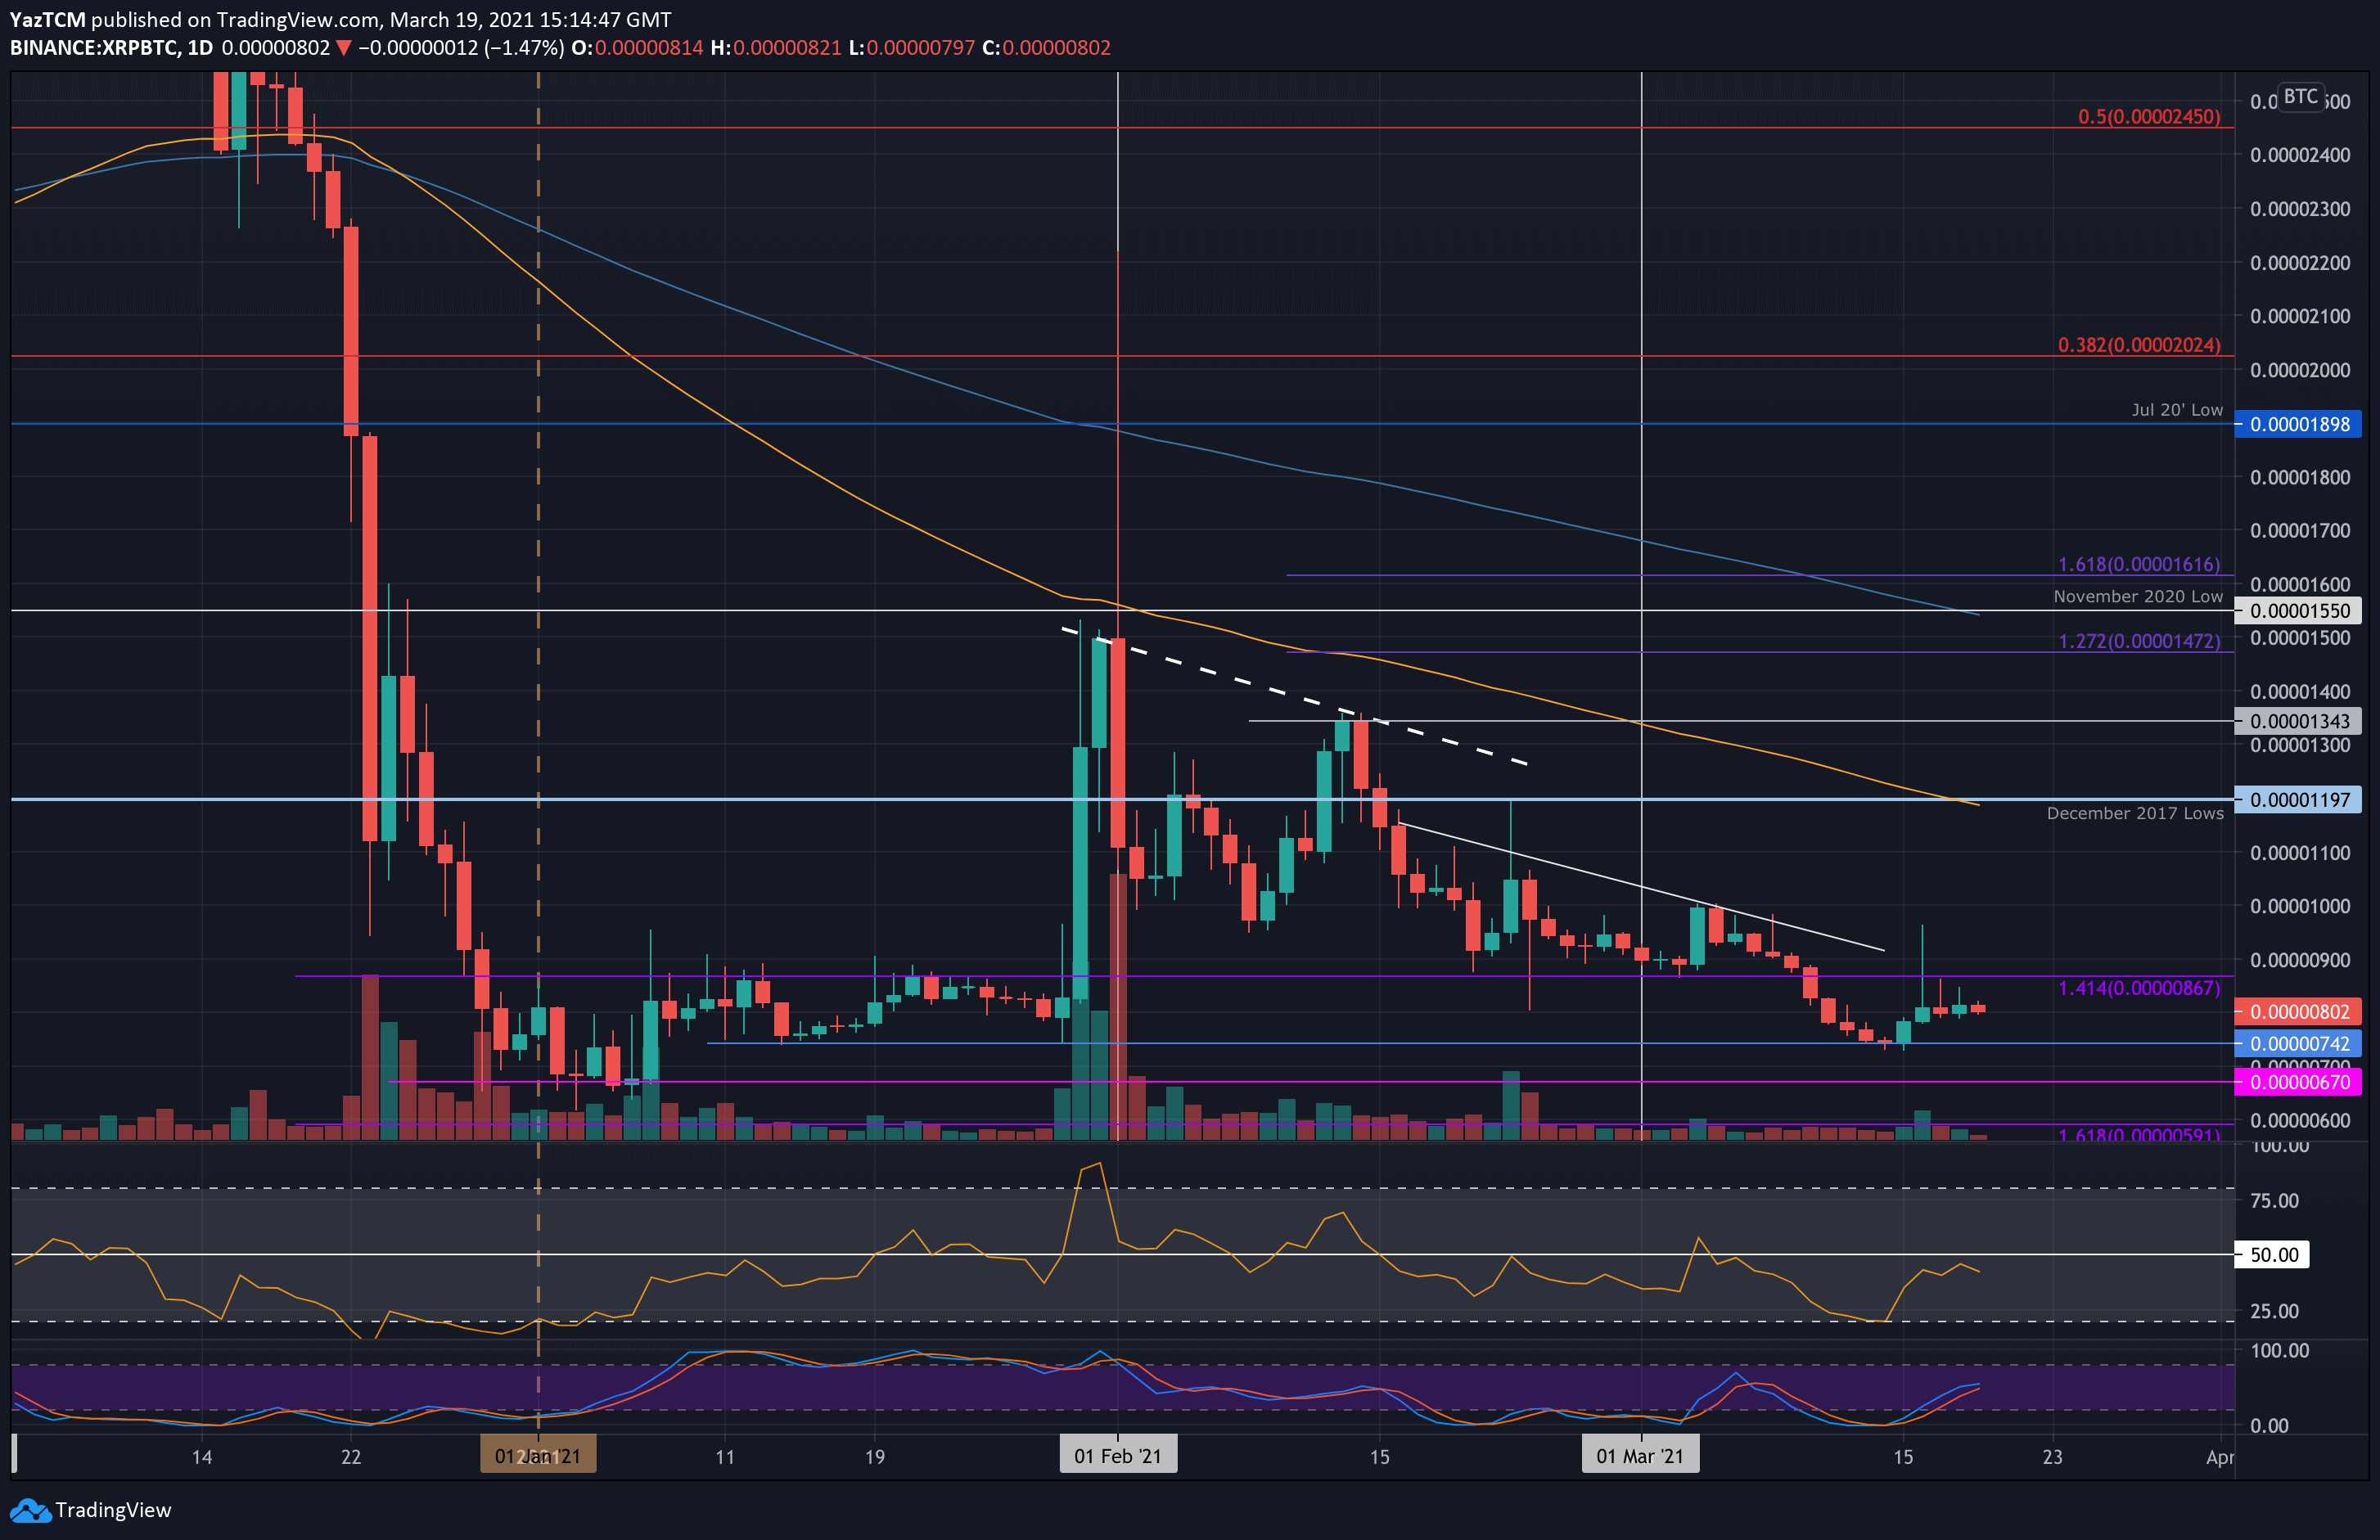
Against Bitcoin, XRP is attempting to recover from last week’s price fall when it dropped beneath 1000 SAT to reach the support at 742 SAT. Over the past seven days, XRP has pushed higher but has been unable to move much further above 800 SAT, where it currently trades.
Looking ahead, the first level of resistance lies at 867 SAT (the upper boundary of January’s trading range). This is followed by resistance at 900 SAT, 1000 SAT, and 1200 SAT (December 2017 lows & 100-days EMA).
On the other side, the first level of support lies at 742 SAT. This is followed by 700 SAT, 670 SAT (lower boundary of January trading range), and 600 SAT.
Binance Coin
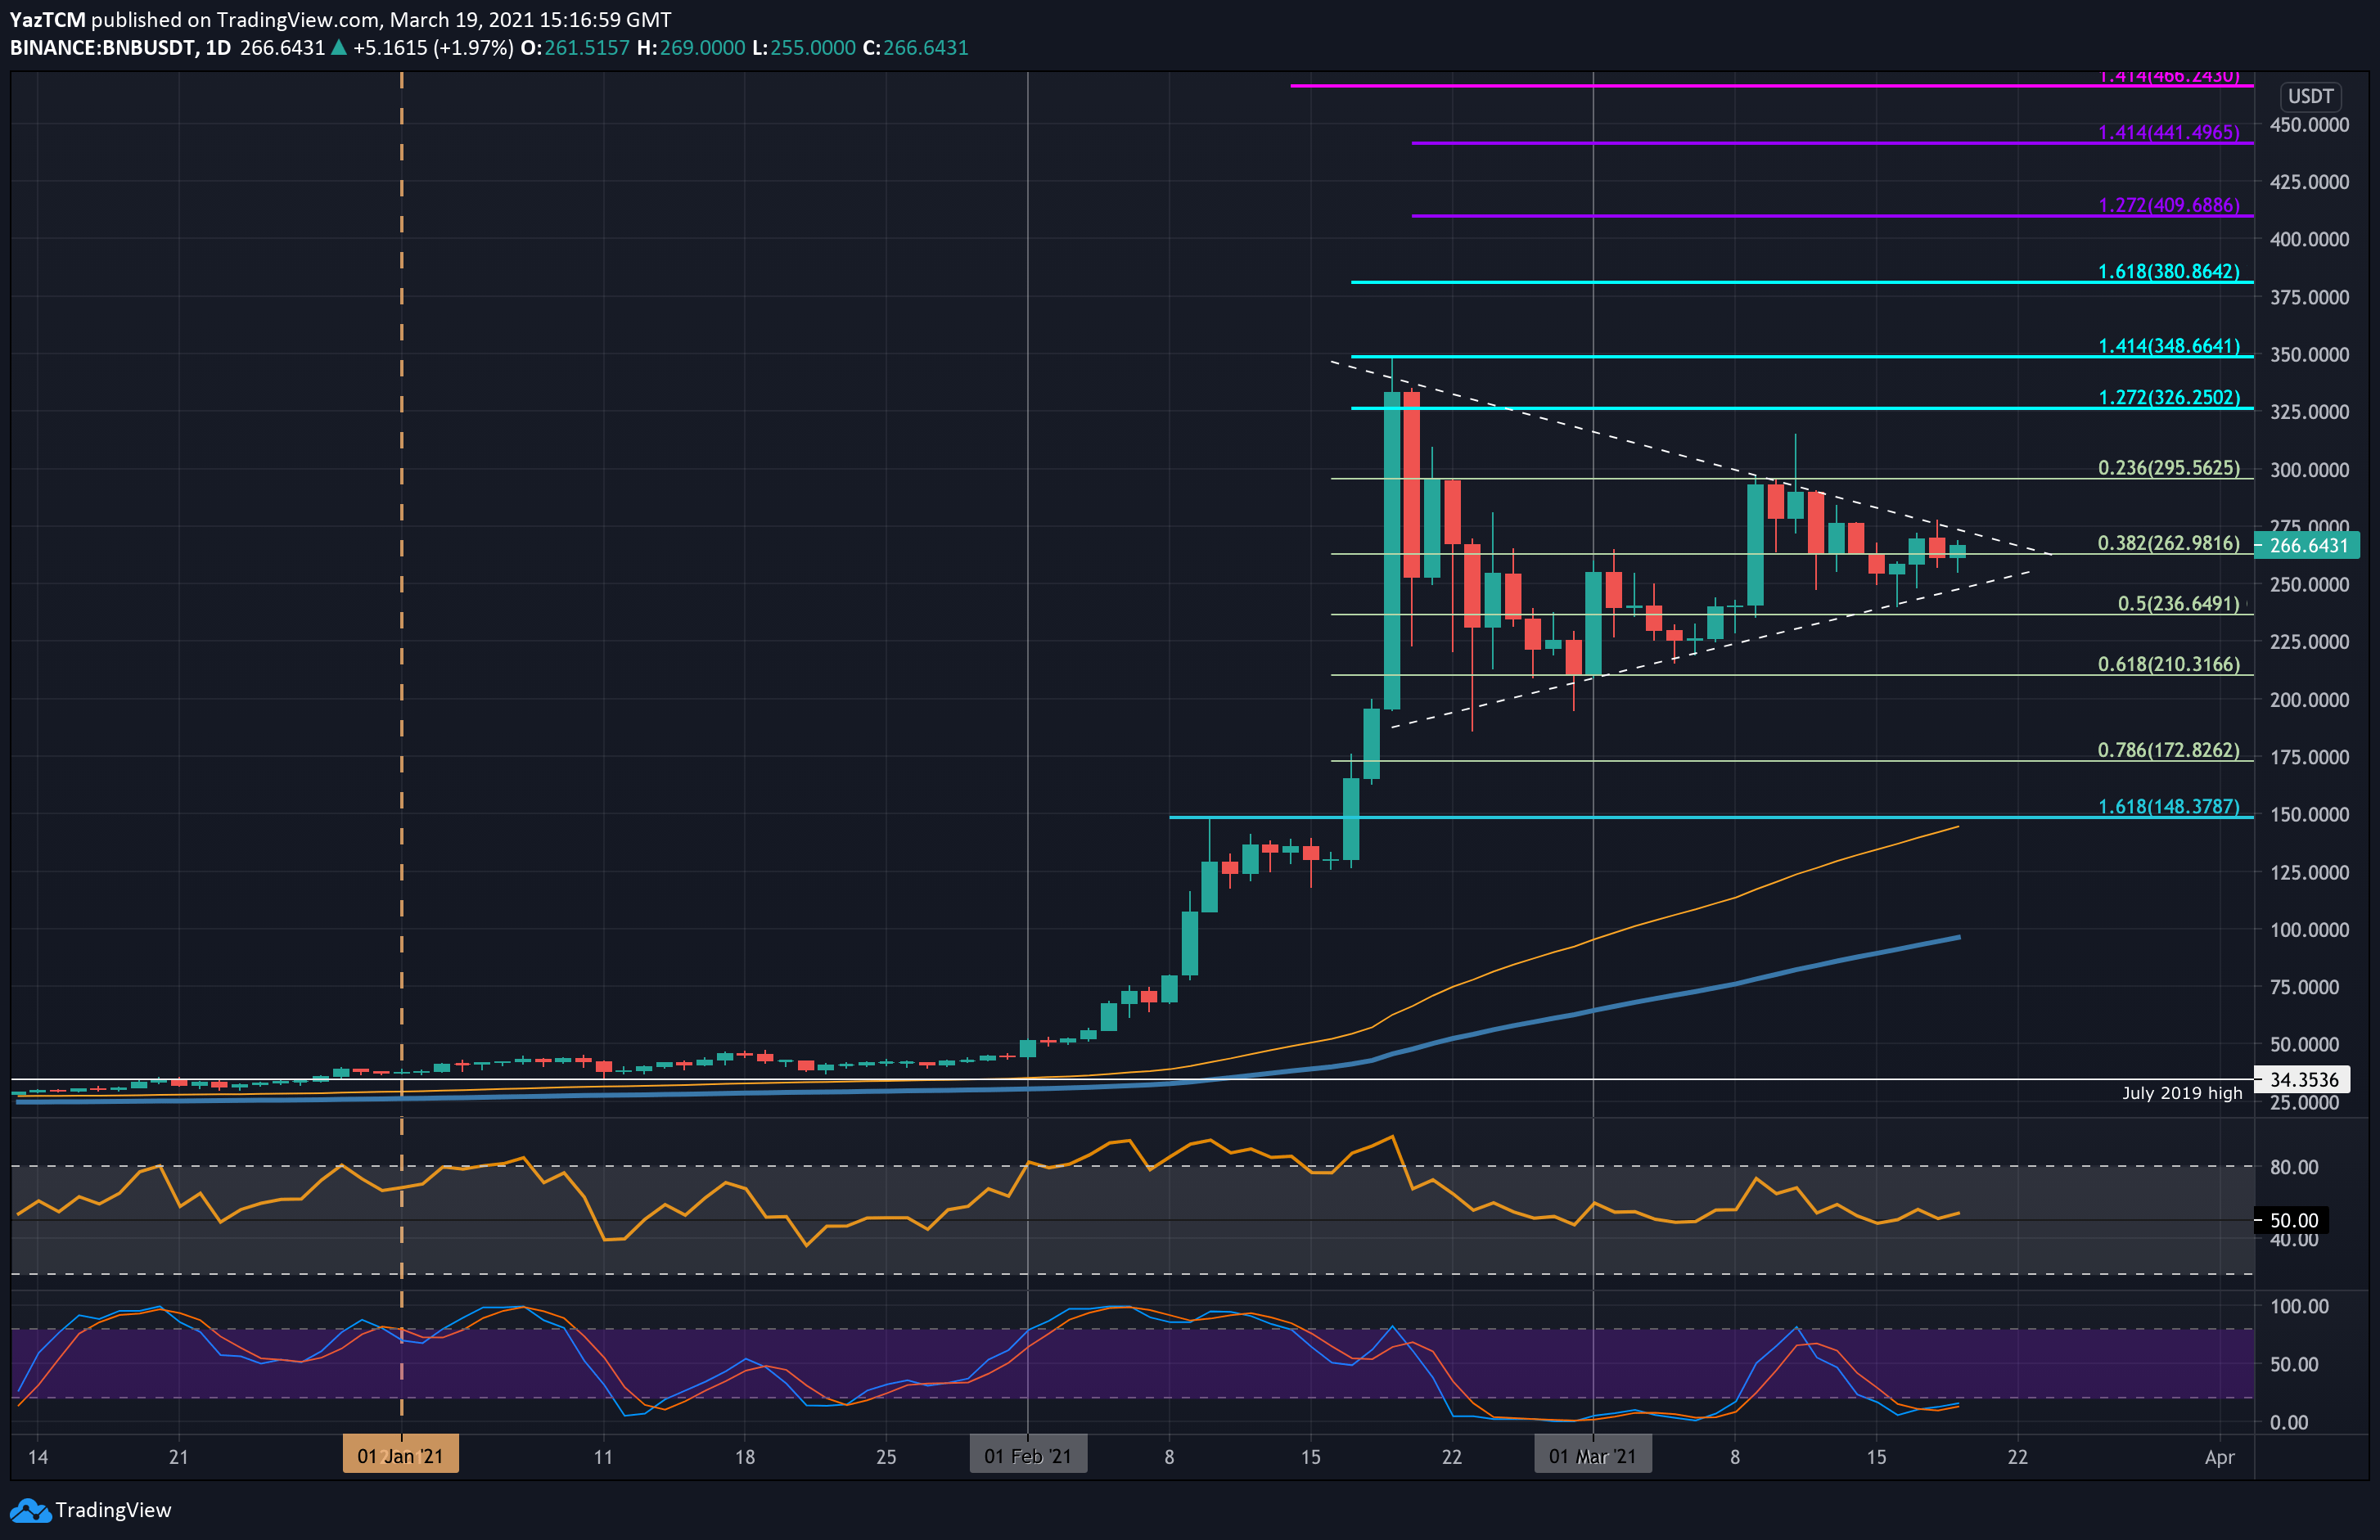
Binance Coin saw a sharp 7% price fall over the last week as it currently sits at $266. The cryptocurrency had been trading at $295 at the start of the week as it started to drop lower and headed beneath support at $262 (.382 Fib Retracement).
After breaking beneath this support, BNB managed to bounce from the support at the lower boundary of the symmetrical triangle it is currently trading within. BNB will need to break one of the boundaries of this triangle to dictate the next direction for the market moving forward.
Looking ahead, if the buyers break the upper boundary of the triangle, the first level of resistance lies at $295. This is quickly followed by resistance at $300, $326 (1.272 Fib Extension), $348 (1.414 FIb Extension & ATH), and $380 (1.618 Fib Extnesion).
On the other side, the first level of support lies at the lower boundary of the triangle at $250. Beneath this, support lies at $236 (.5 Fib), $225, and $210 (.618 Fib). Added support lies at $200, $172 (.786 Fib), and $160 (100-days EMA).
BNB has been relatively static against Bitcoin over the past week. It did drop from above 0.005 BTC last Friday to reach support around 0.0045 BTC (.5 Fib). It has held this support over the past week of trading.
Looking ahead, if the bears drop BNB beneath 0.0045 BTC, the first level of support lies at 0.00406 BTC (.618 Fib). This is followed by support at 0.004 BTC, 0.00387 BTC, 0.00338 BTC (.786 Fib), and 0.00316 BTC (Sep 2020 Highs).
On the other side, the first resistance lies at 0.005 BTC. This is followed by 0.0055 BTC, 0.0056 BTC, and 0.006 BTC.

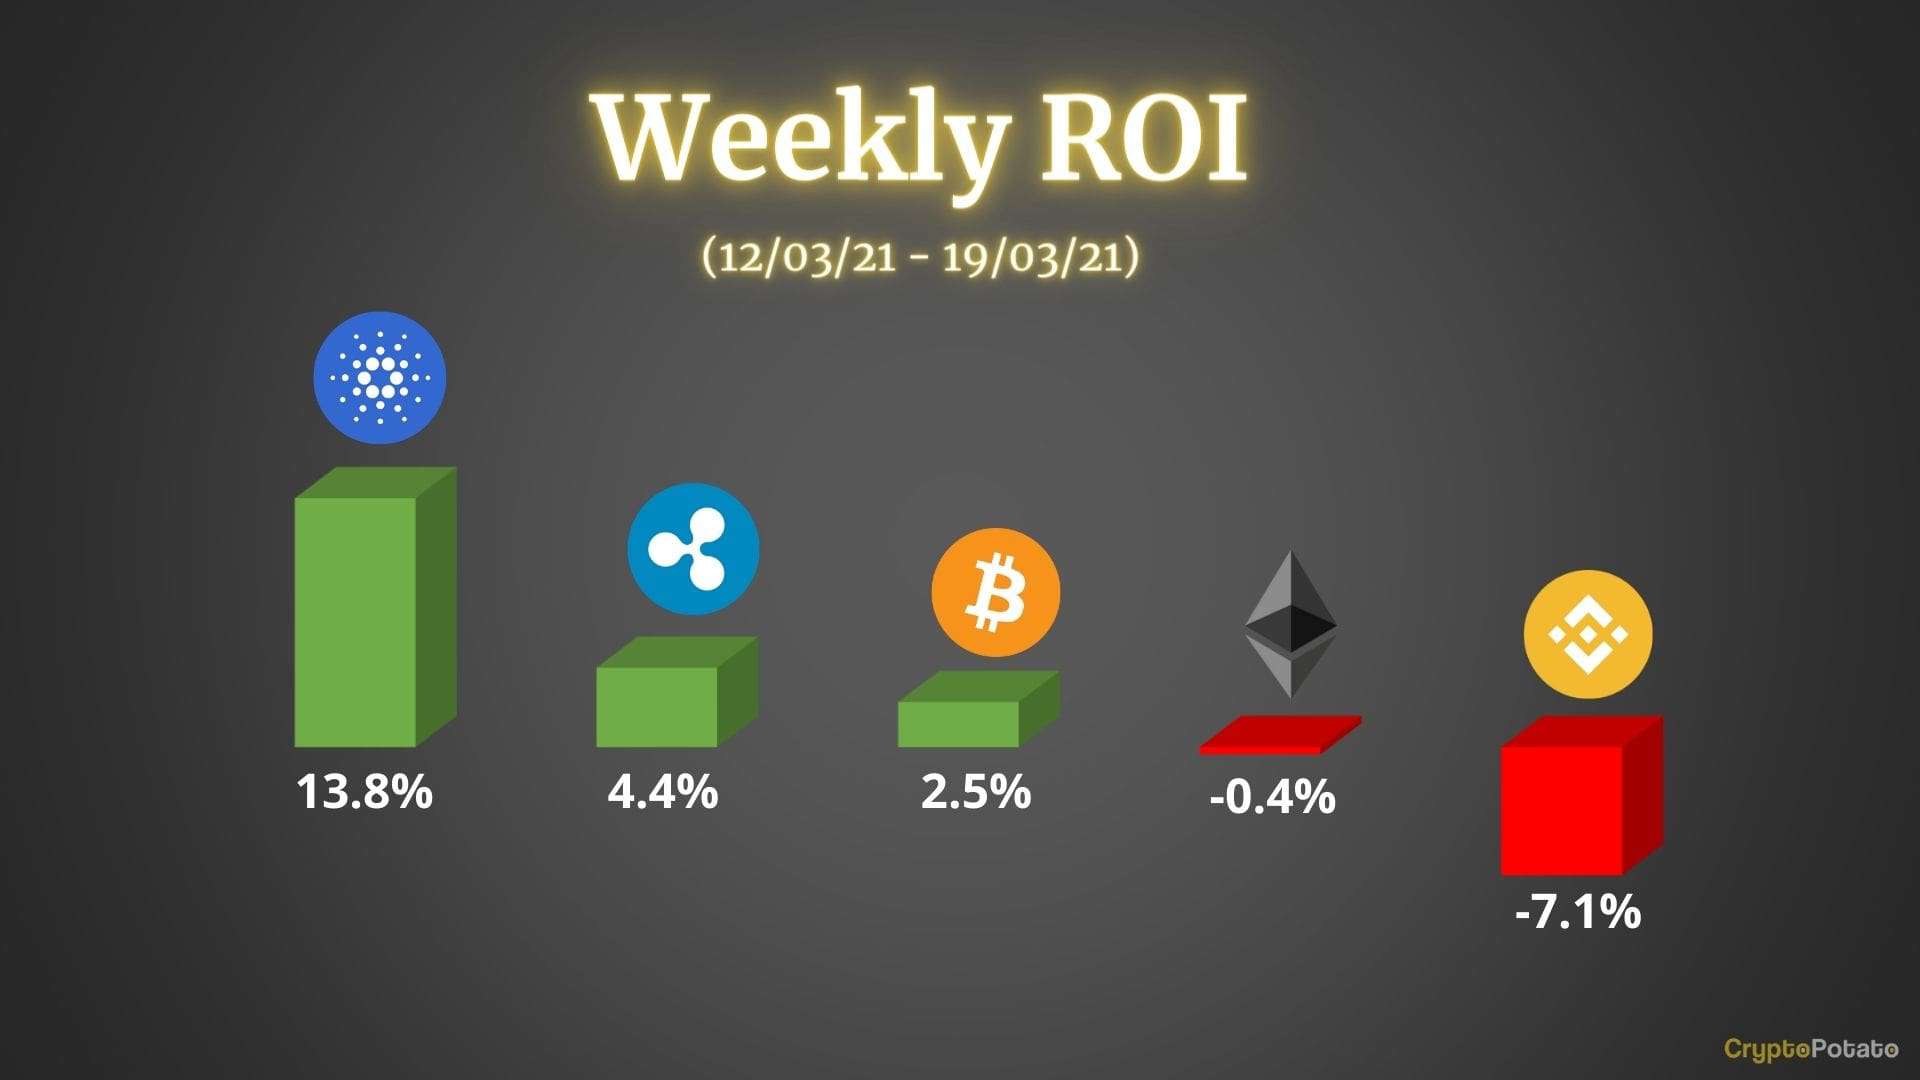
Cardano
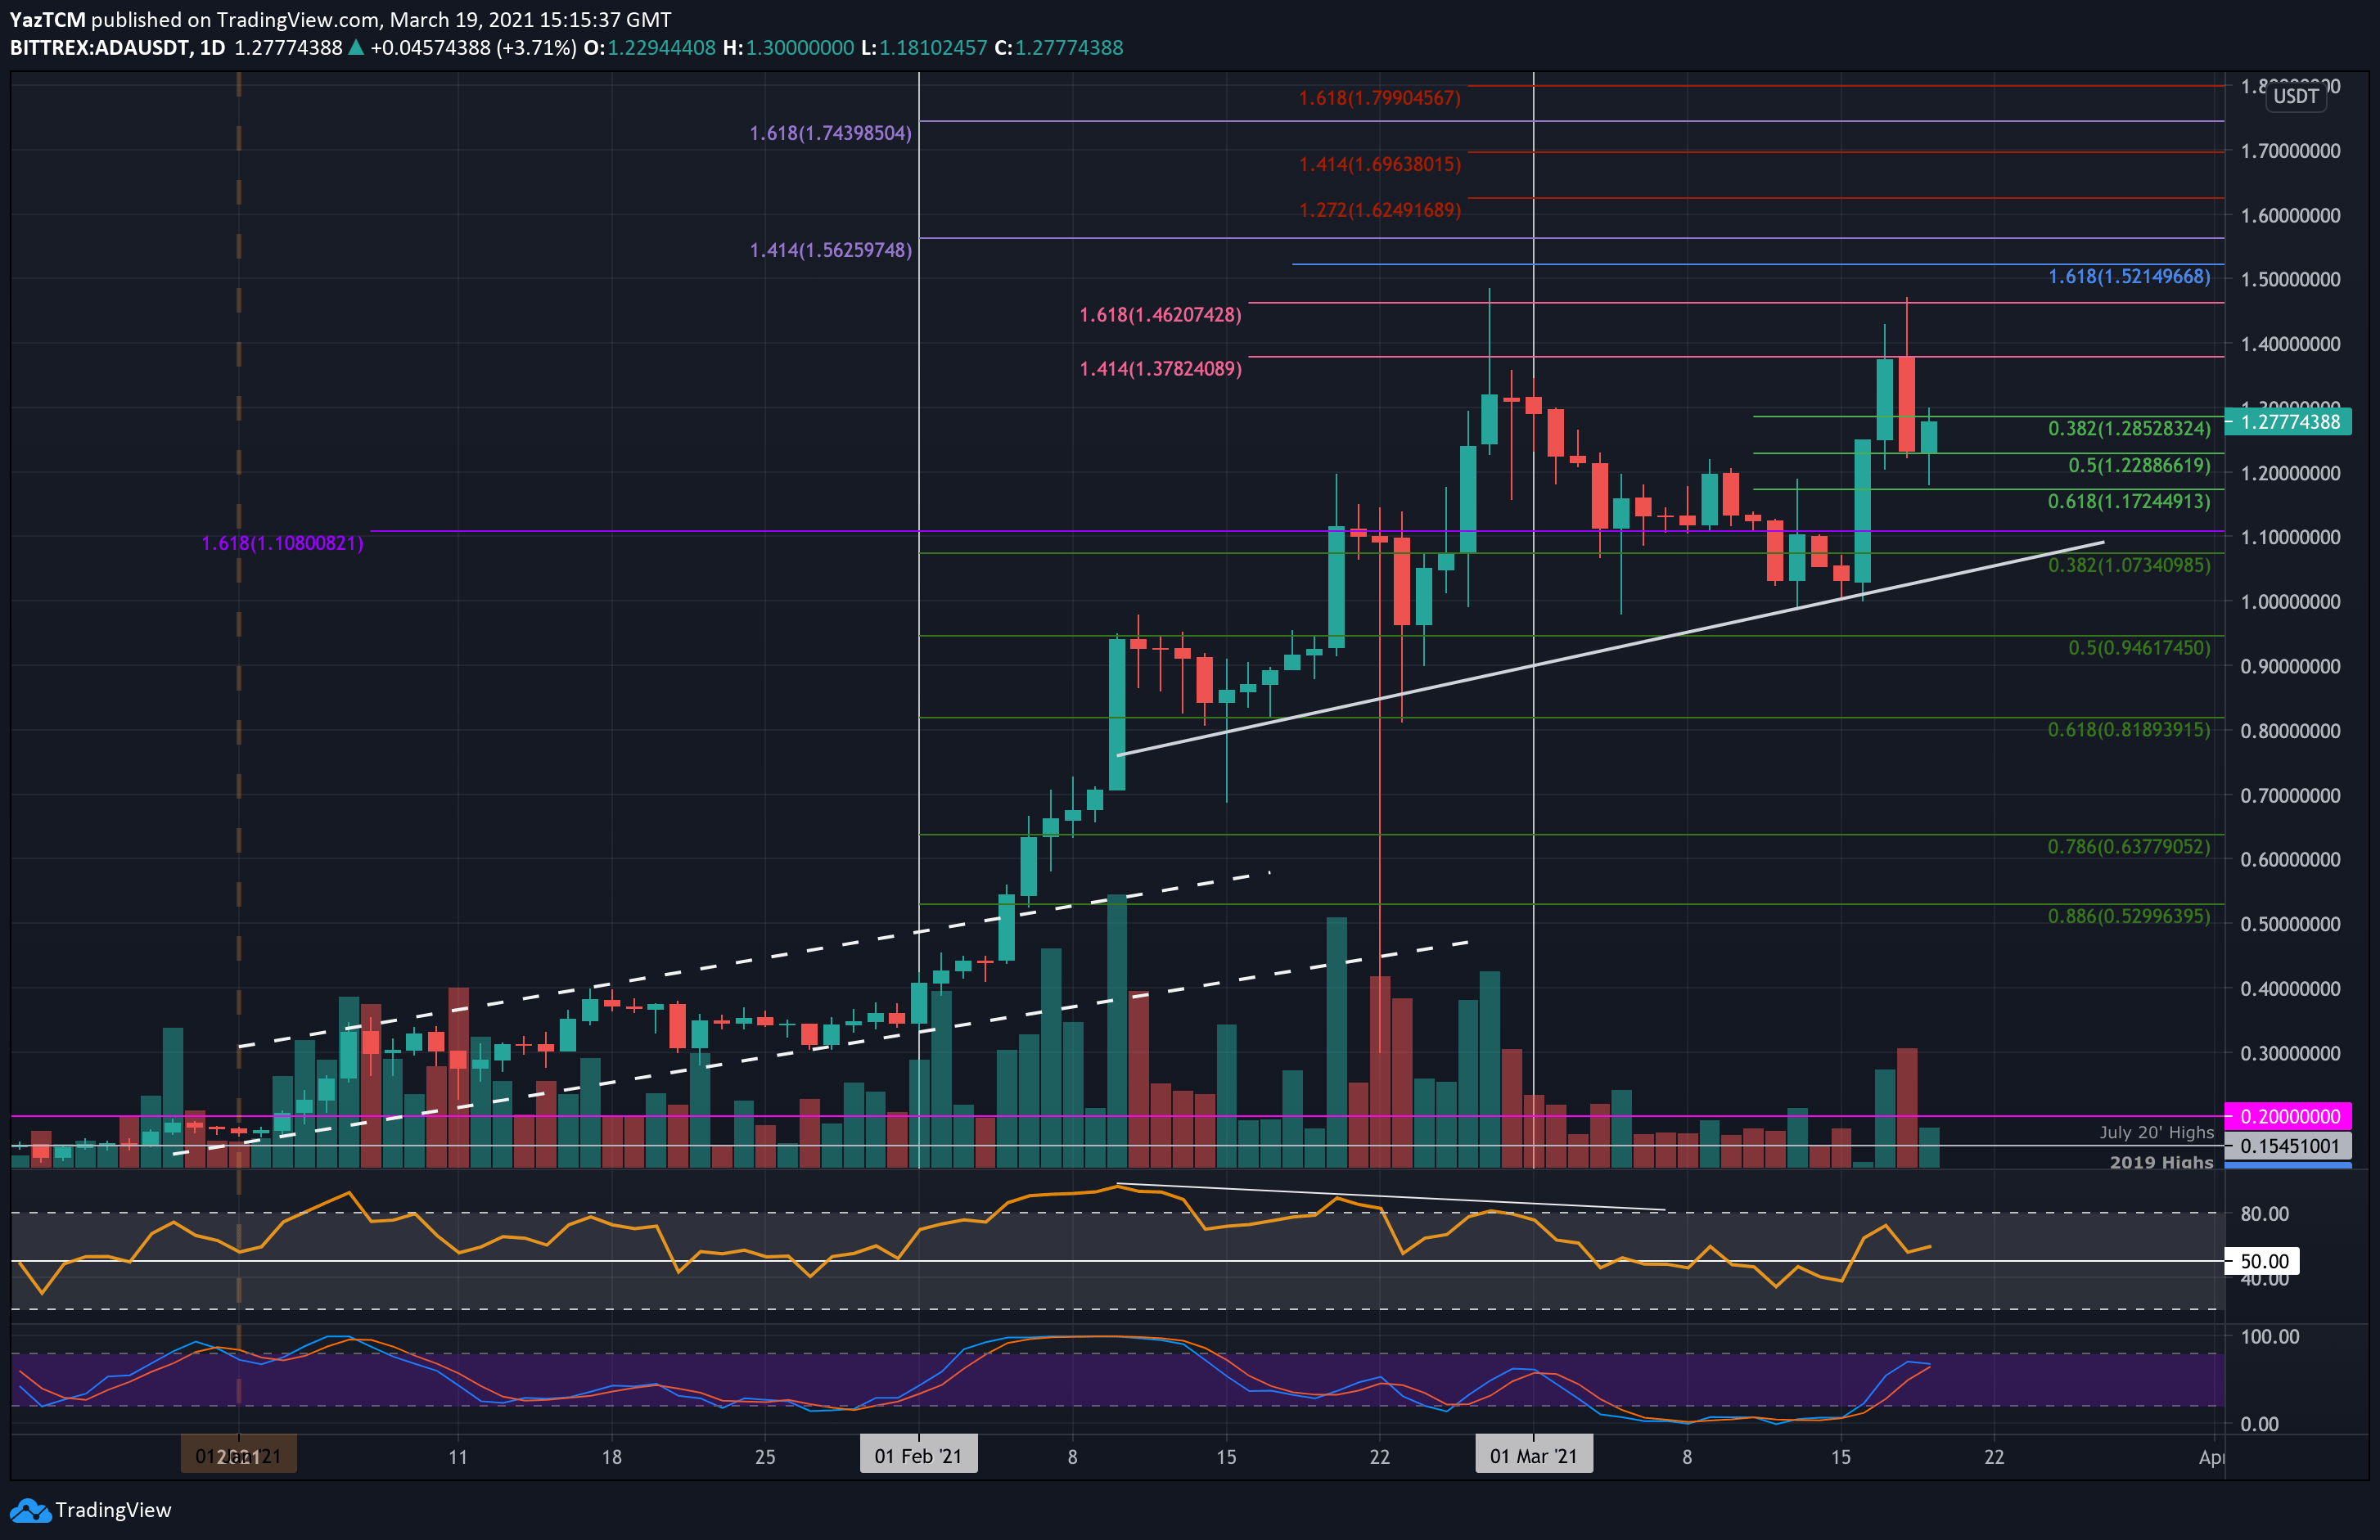
Cardano is up by a strong 14% over the past week as it currently trades at $1.28. The coin was at around $1.05 last Friday as it began the weekend by trading sideways. Most of the gains came on Tuesday when Cardano surged from $1.00 to reach $1.25. It continued higher through Wednesday and Thursday to reach as high as $1.47.
Unfortunately, it could not close a daily candle above resistance at $1.37 (1.414 FIb Extension) and fell from there today to reach the support at $1.22 (.5 Fib). It has since bounced higher slightly as it trades at $1.27.
Looking ahead, the first level of resistance lies at $1.37 (1.414 Fib Extension). This is followed by $1.46 (1.618 Fib Extension), $1.50, and $1.62 (1.272 Fib Extension). Added resistance lies at $1.70, $1.74, and $1.80.
On the other side, the first level of support lies at $1.22 (.5 Fib). This is followed by $1.17 (.618 Fib), $1.10, and $1.00.
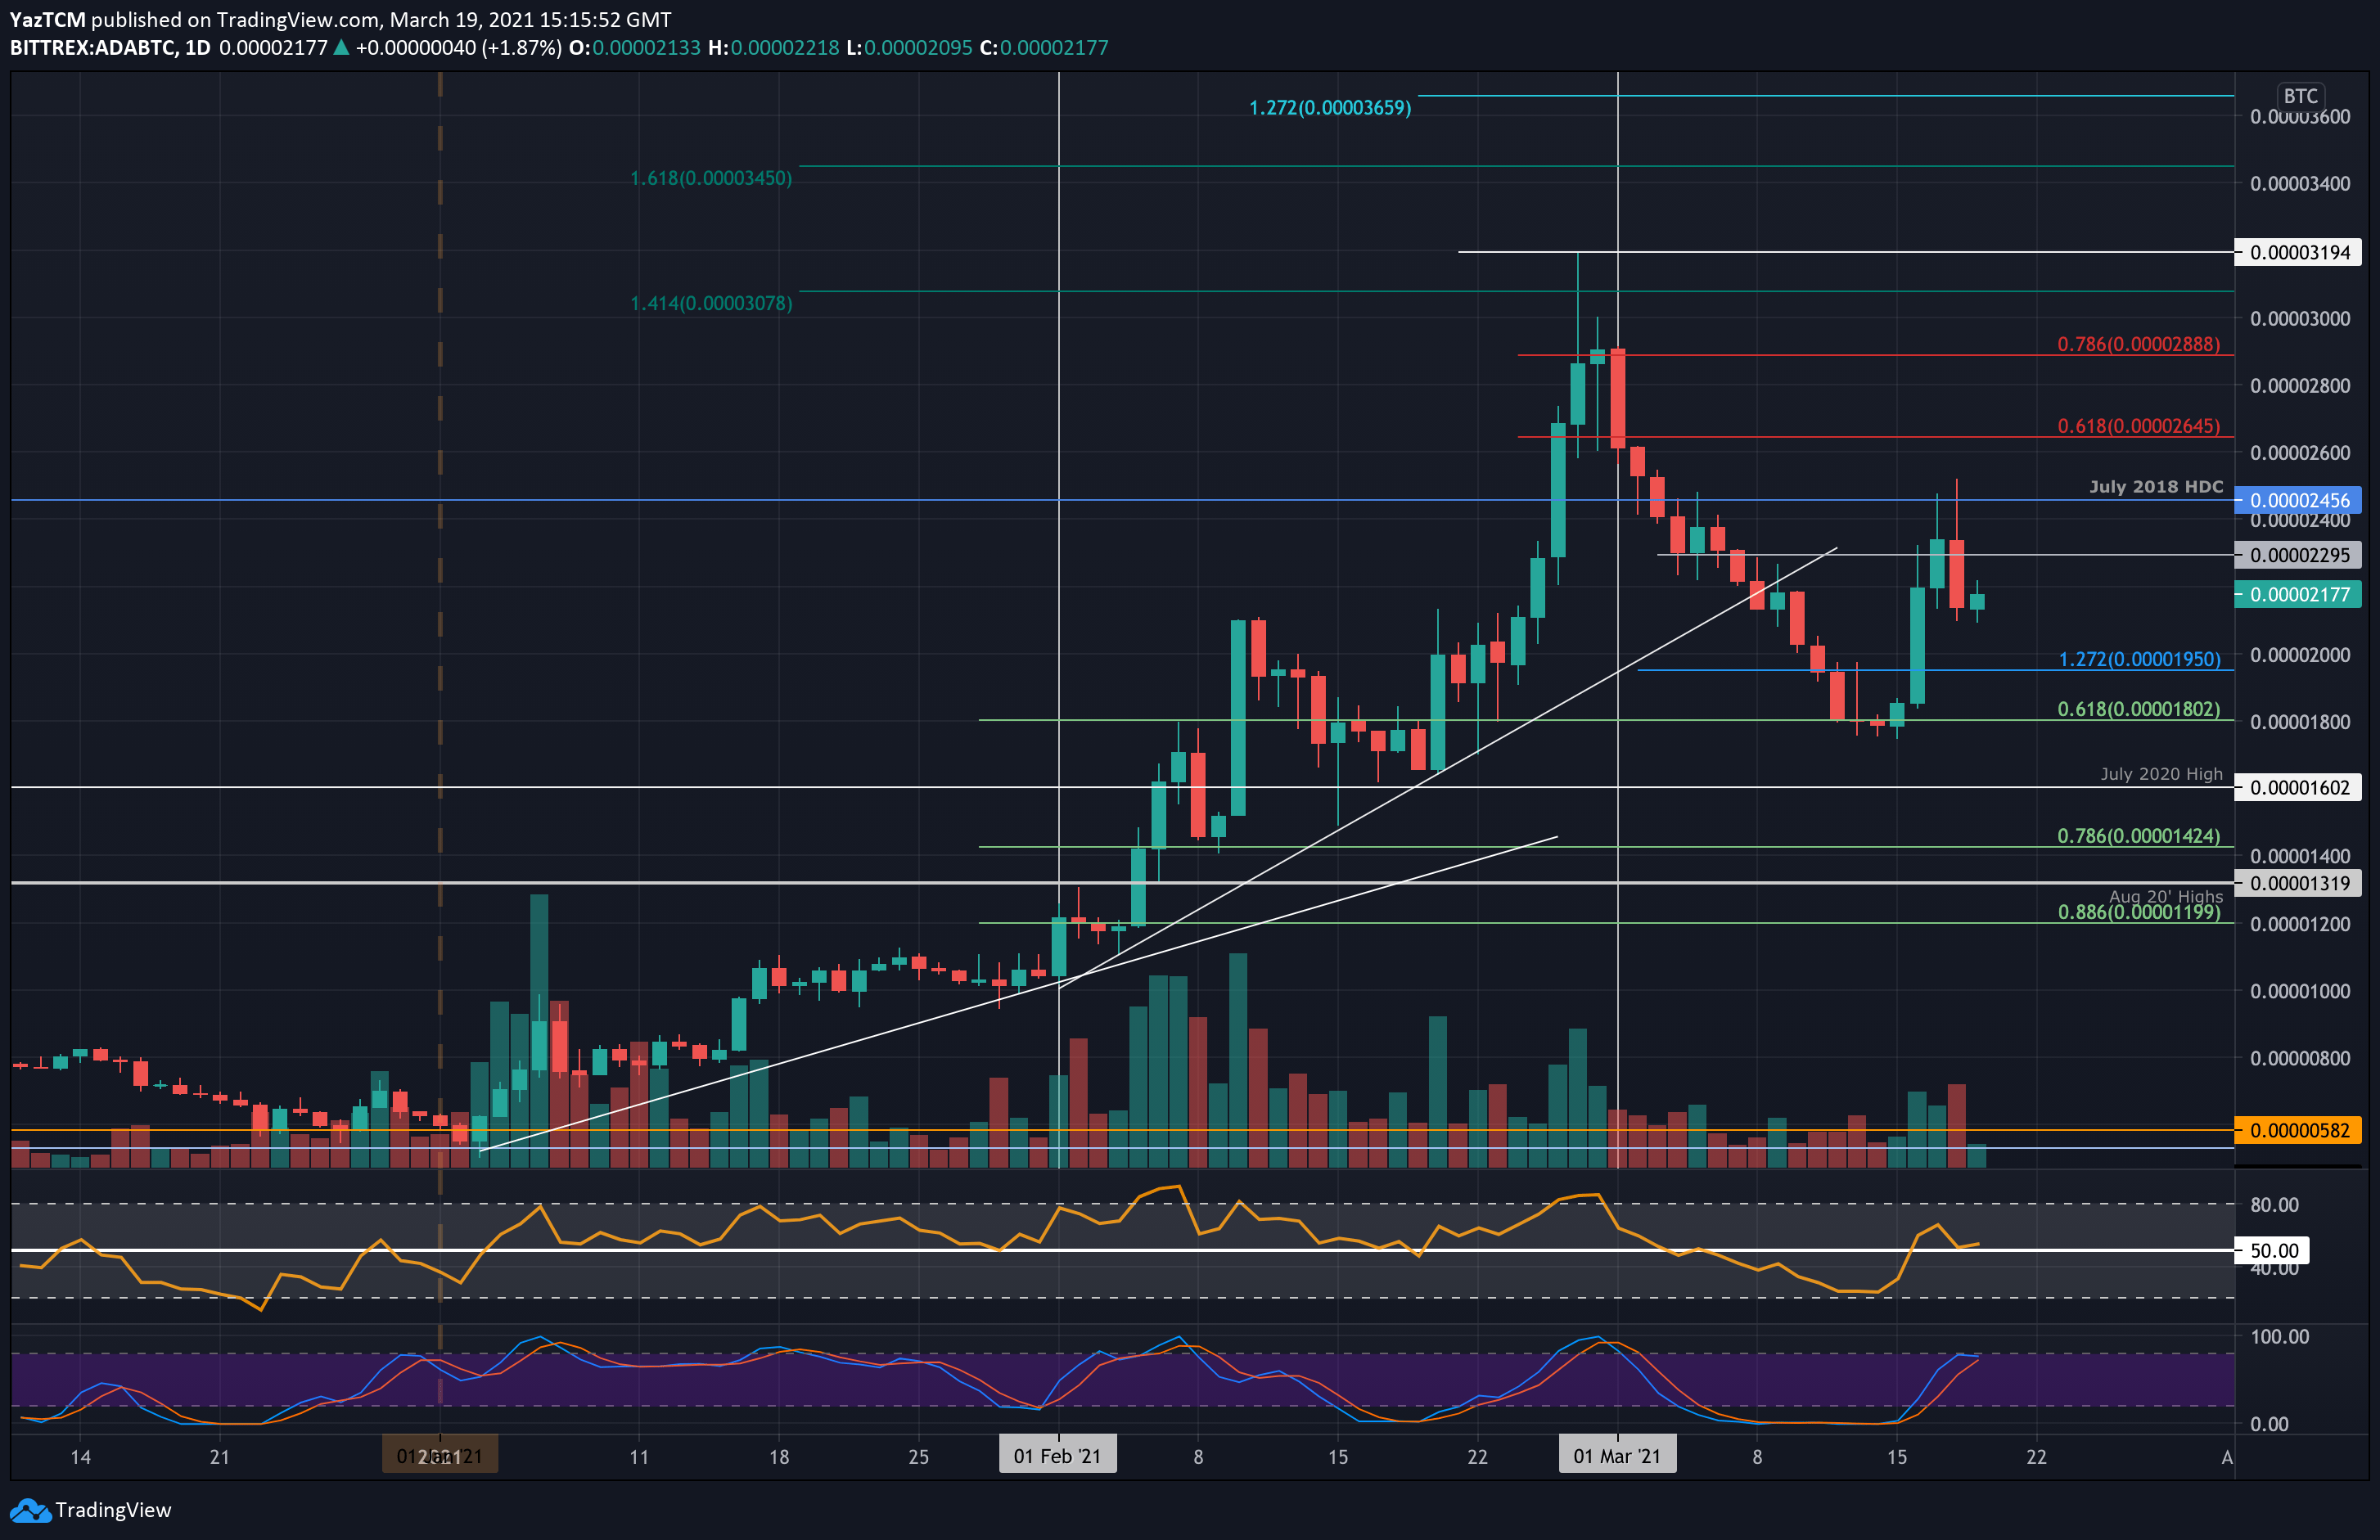
ADA is performing well against Bitcoin also as it bounced from the support at the 1800 SAT level at the start of the week and managed to push as high as 2500 SAT yesterday. It has since dropped lower today as it now trades around 2177 SAT.
Looking ahead, the first level of resistance lies at 2295 SAT. This is followed by 2455 SAT (July 2018 HDC), 2645 SAT (bearish .618 Fib), 2800 SAT, and 2888 SAT (bearish .786 Fib).
On the other side, the first support lies at 2000 SAT. This is followed by 1950 SAT, 1800 SAT, 1600 SAT (July 2020 High), and $425 SAT (.786 Fib).