BitcoinBitcoin is more or less trading at the same level it was last week around the same time. The cryptocurrency had dropped as low as ,000 on Sunday, but it quickly bounded higher to close the daily candle above ,750.On Monday, Bitcoin started to show some promise as it surged higher from ,750 to reach as high as ,600. Over the following three days, the cryptocurrency managed to spike back above the ,000 level. However, it met resistance at ,480 (bearish .618 Fib) and ended up closing the daily candle beneath ,655 (bearish .5 Fib).It has since rolled over from this resistance, spiking as low as ,294 today. It has recovered slightly as it trades at the ,200 (.382 Fib) support.Moving forward, the first level of support beneath ,200 lies at ,000. This is
Topics:
Yaz Sheikh considers the following as important: ADABTC, ADAUSD, Bitcoin (BTC) Price, BTCEUR, BTCGBP, btcusd, btcusdt, Cardano (ADA) Price, DOTBTC, DOTUSD, DOTUSDT, ETH Analysis, ETHBTC, Ethereum (ETH) Price, ethusd, Polkadot (DOT) Price, Price Analysis, Ripple (XRP) Price, XRP Analysis, xrpbtc, xrpusd
This could be interesting, too:
Chayanika Deka writes XRP, SOL, and ADA Inclusion in US Crypto Reserve Pushes Traders on Edge
Chayanika Deka writes Why Arthur Hayes Is Bullish on Bitcoin Under Trump’s Economic Strategy
Mandy Williams writes Why the Bitcoin Market Is Stuck—and the Key Metric That Could Change It: CryptoQuant CEO
Wayne Jones writes Metaplanet Acquires 156 BTC, Bringing Total Holdings to 2,391
Bitcoin
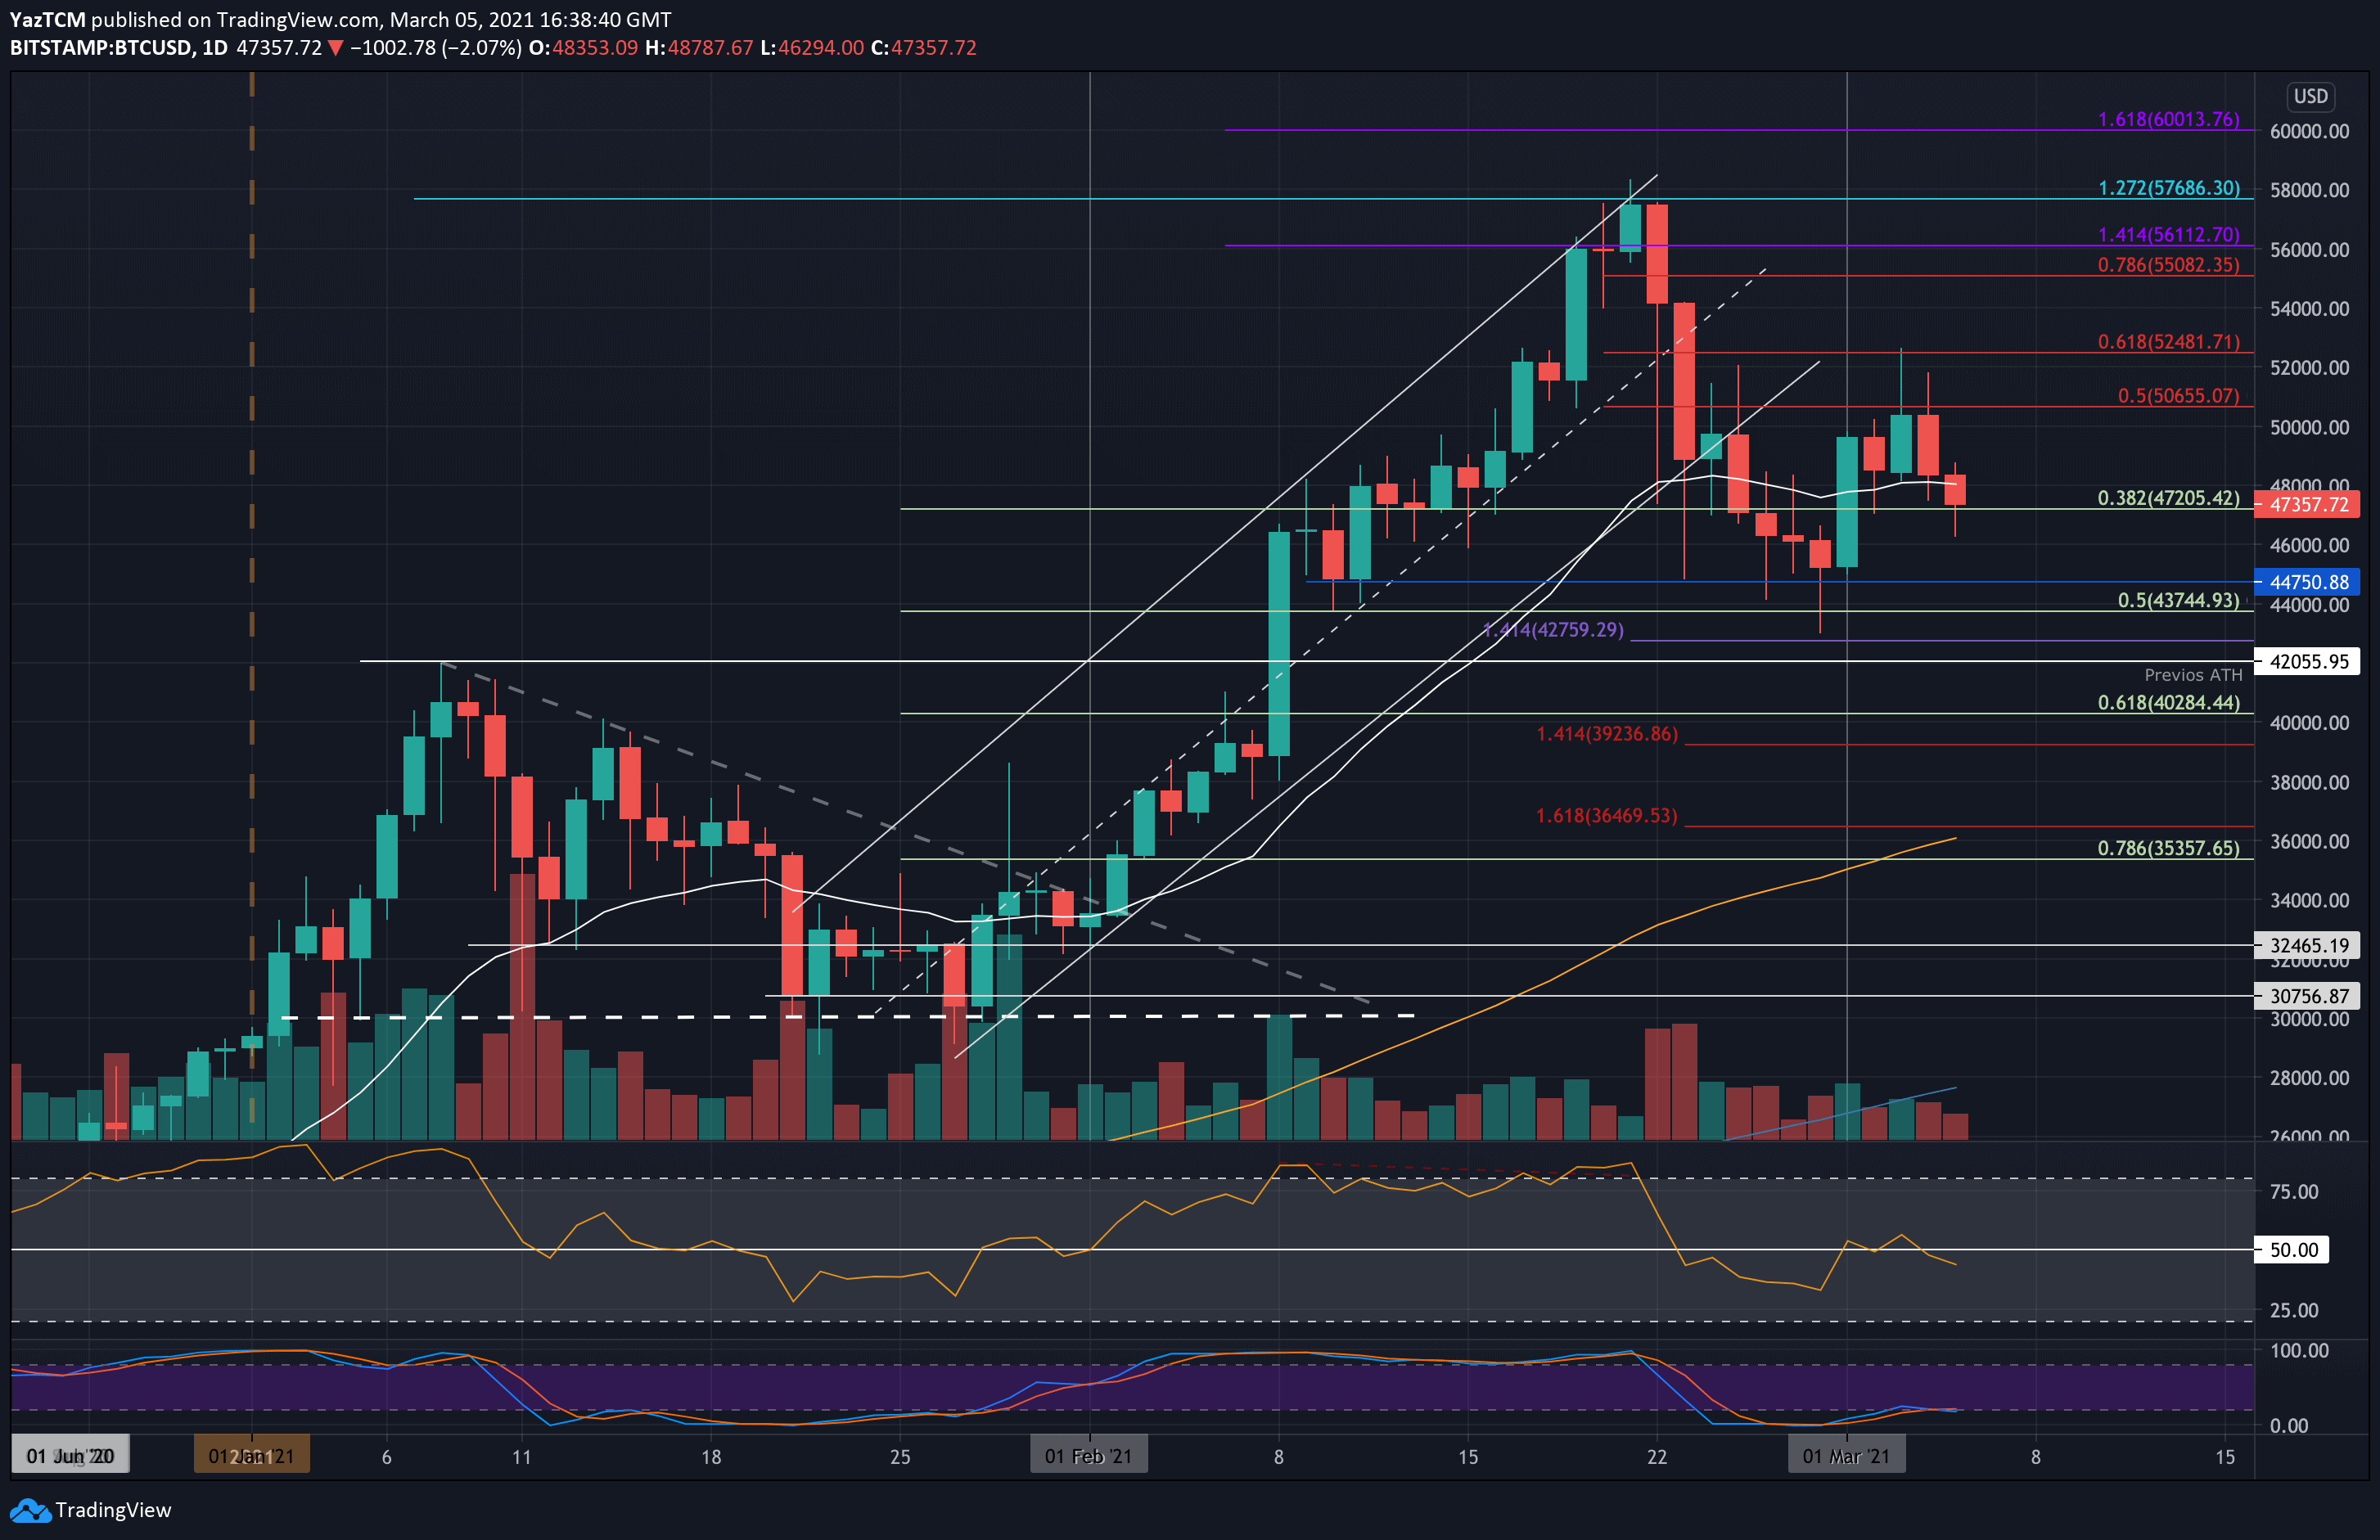
Bitcoin is more or less trading at the same level it was last week around the same time. The cryptocurrency had dropped as low as $43,000 on Sunday, but it quickly bounded higher to close the daily candle above $44,750.
On Monday, Bitcoin started to show some promise as it surged higher from $44,750 to reach as high as $49,600. Over the following three days, the cryptocurrency managed to spike back above the $50,000 level. However, it met resistance at $52,480 (bearish .618 Fib) and ended up closing the daily candle beneath $50,655 (bearish .5 Fib).
It has since rolled over from this resistance, spiking as low as $46,294 today. It has recovered slightly as it trades at the $47,200 (.382 Fib) support.
Moving forward, the first level of support beneath $47,200 lies at $46,000. This is followed by $44,750, $43,745 (.5 Fib), $42,760 (downside 1.414 Fib Extension), and $42,000 (previous ATH).
On the other side, the first level of resistance lies at $50,000. This is closely followed by $50,655 (bearish .5 Fib), $52,480 (bearish .618 Fib), $54,000, and $455,080 (bearish .786 Fib).
Ethereum
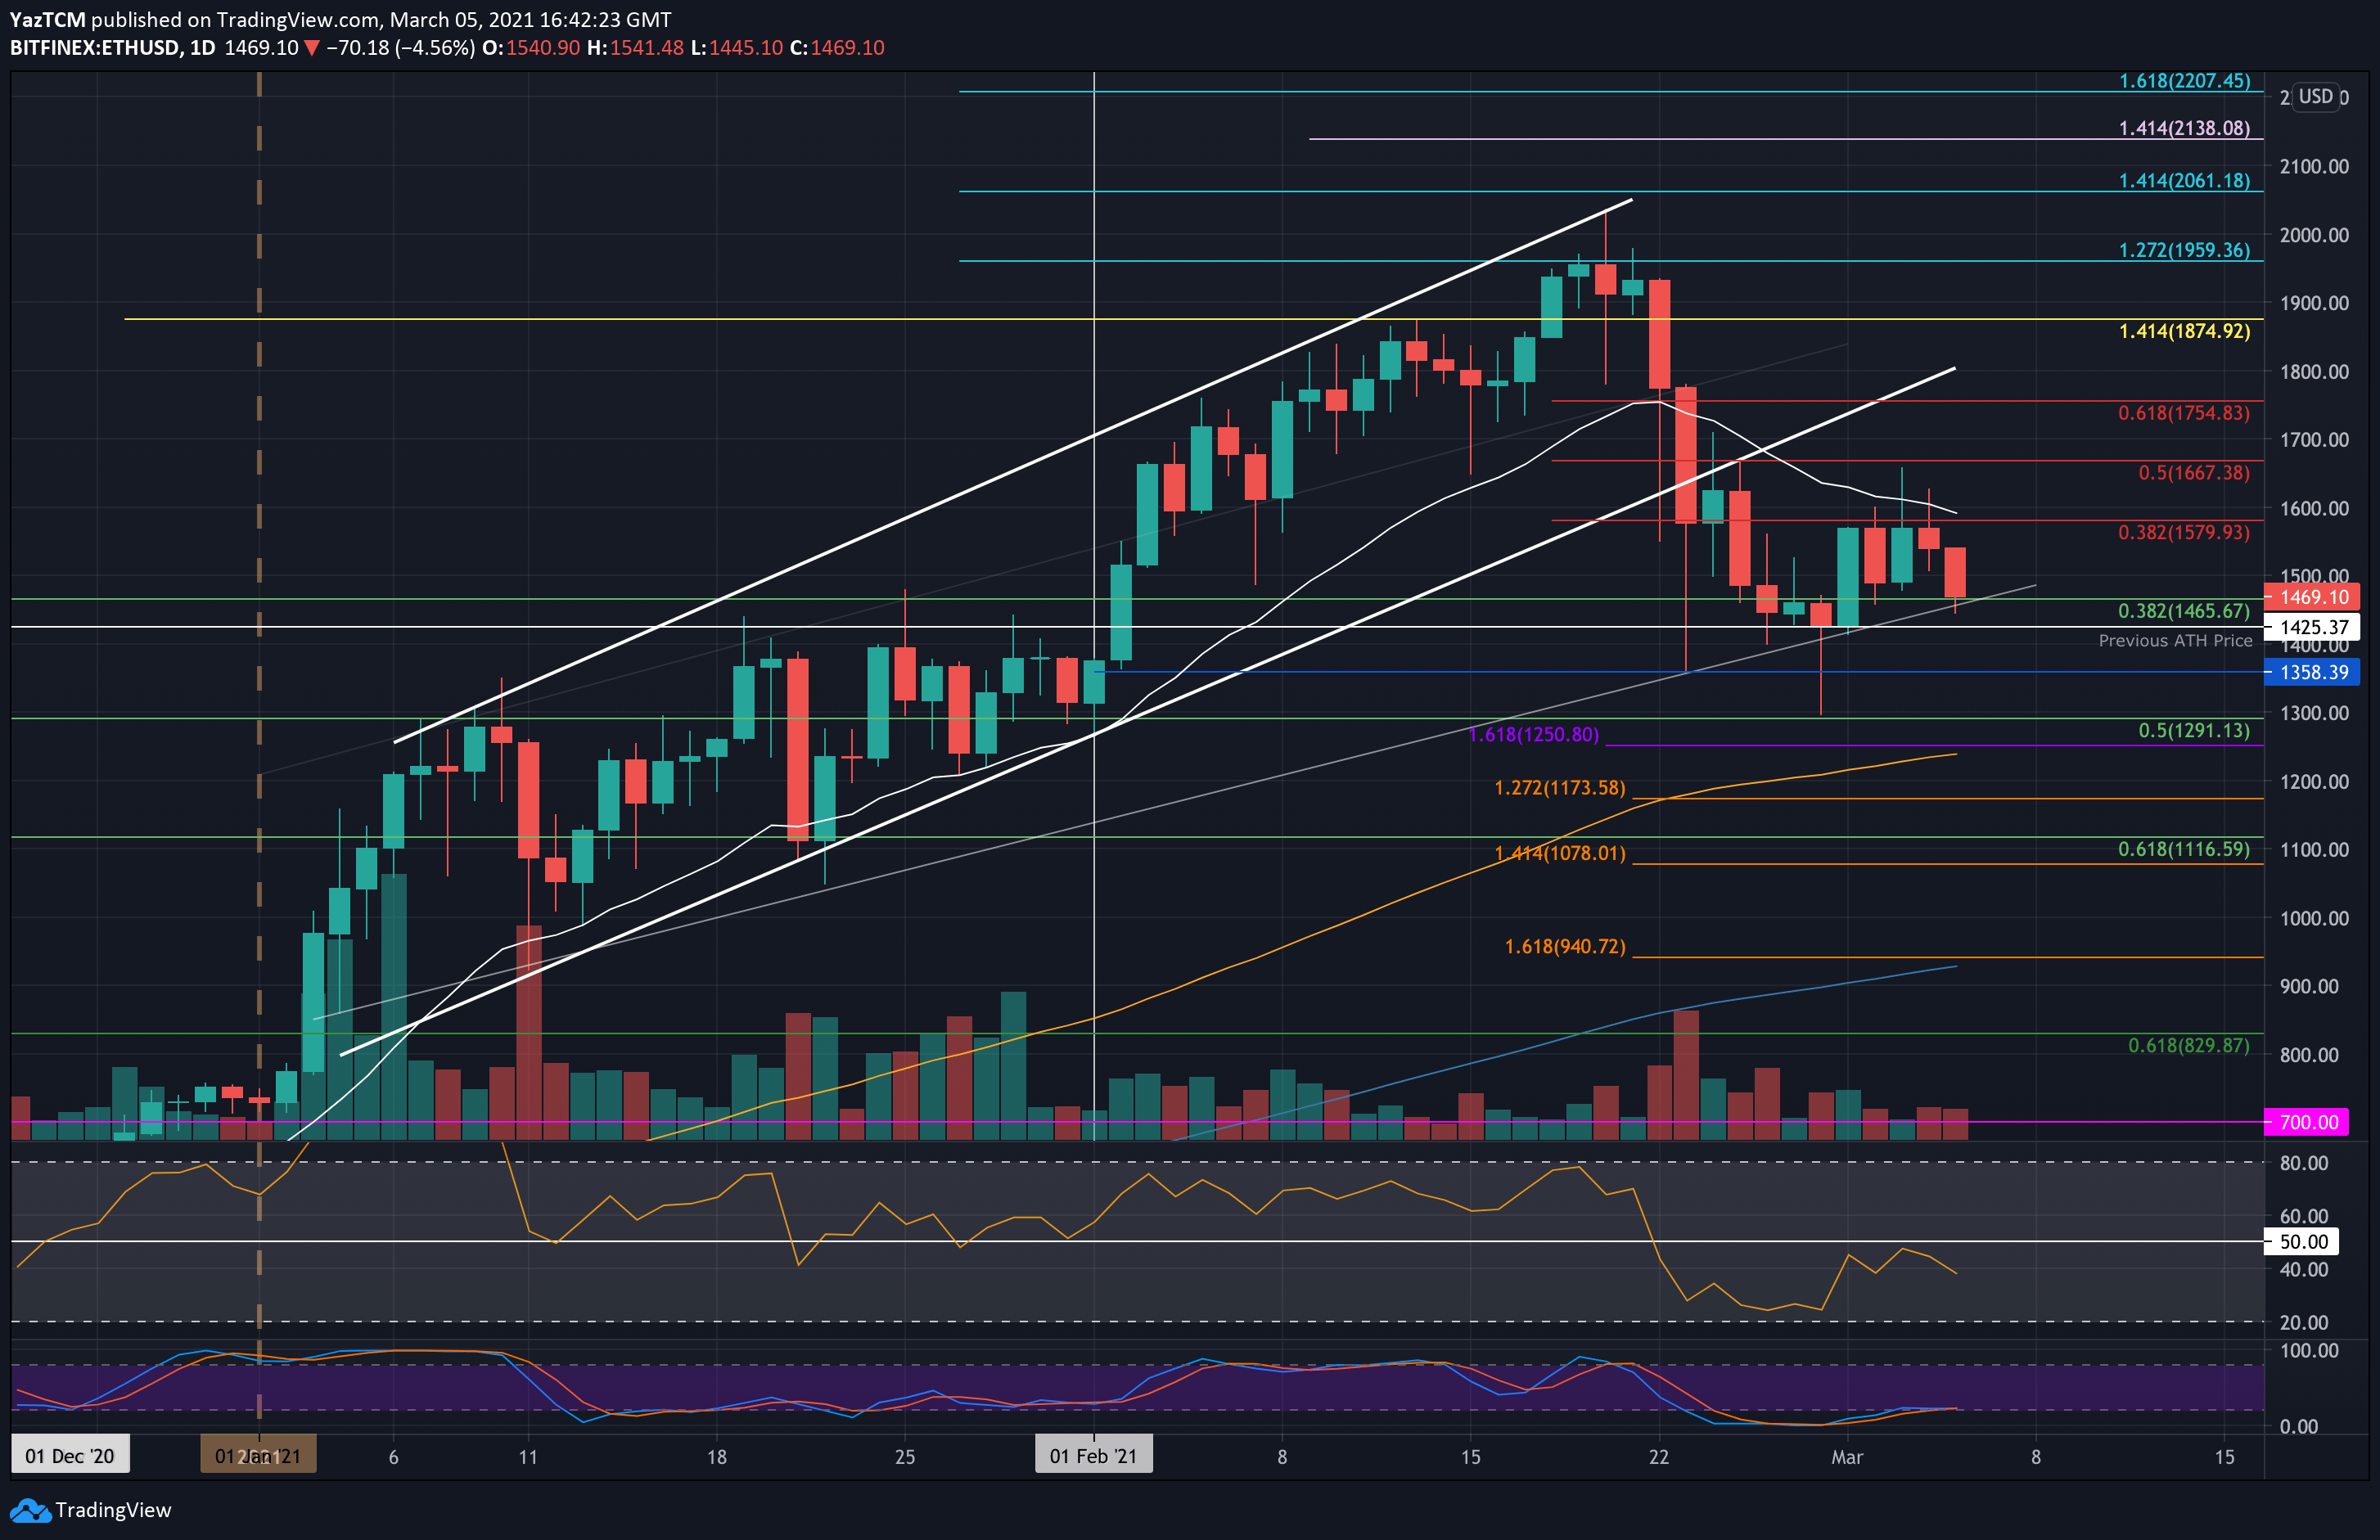
Ethereum is also trading near the same price level it was at last week. The cryptocurrency had managed to find support at $1425 over the weekend, after spiking as low as $1300. It started to rebound from there on Monday but could not close a daily candle above resistance at $1580 (bearish .382 Fib) during the week.
It rolled over from this resistance yesterday and dropped by a total of 8.5% today to reach the current support at $1465 (.382 Fib).
Looking ahead, if the bears push beneath $1465, the first level of support lies at $1425 (previous ATH). This is followed by $1358, $1290 (.5 Fib), $1250 (downside 1.618 Fib Extension & 100-days EMA), and $1200.
On the other side, the first level of strong resistance lies at $1580 (bearish .382 Fib). This is followed by $1600, $1557 (bearish .5 Fib), $1700, and $1755 (bearish .618 Fib).
Etheruem is also struggling against Bitcoin. The cryptocurrency had moved sideways out of a descending price channel this week but struggled to break resistance at 0.0318 BTC (200-day EMA & December 2020 highs). It has since dropped lower as it battles to climb back above 0.031 BTC.
Looking ahead, the first level of resistance lies at 0.0318 BTC (200-day EMA). This is followed by 0.0337 BTC (November 2020 highs & 100-days EMA), 0.035 BTC, and 0.0361 BTC (March 2019 Highs).
On the other side, the first level of support lies at 0.0305 BTC. This is followed by 0.03 BTC, 0.0295 BTC (downside 1.272 Fib Extension), and 0.0284 BTC (Feb 2020 Highs).

Ripple
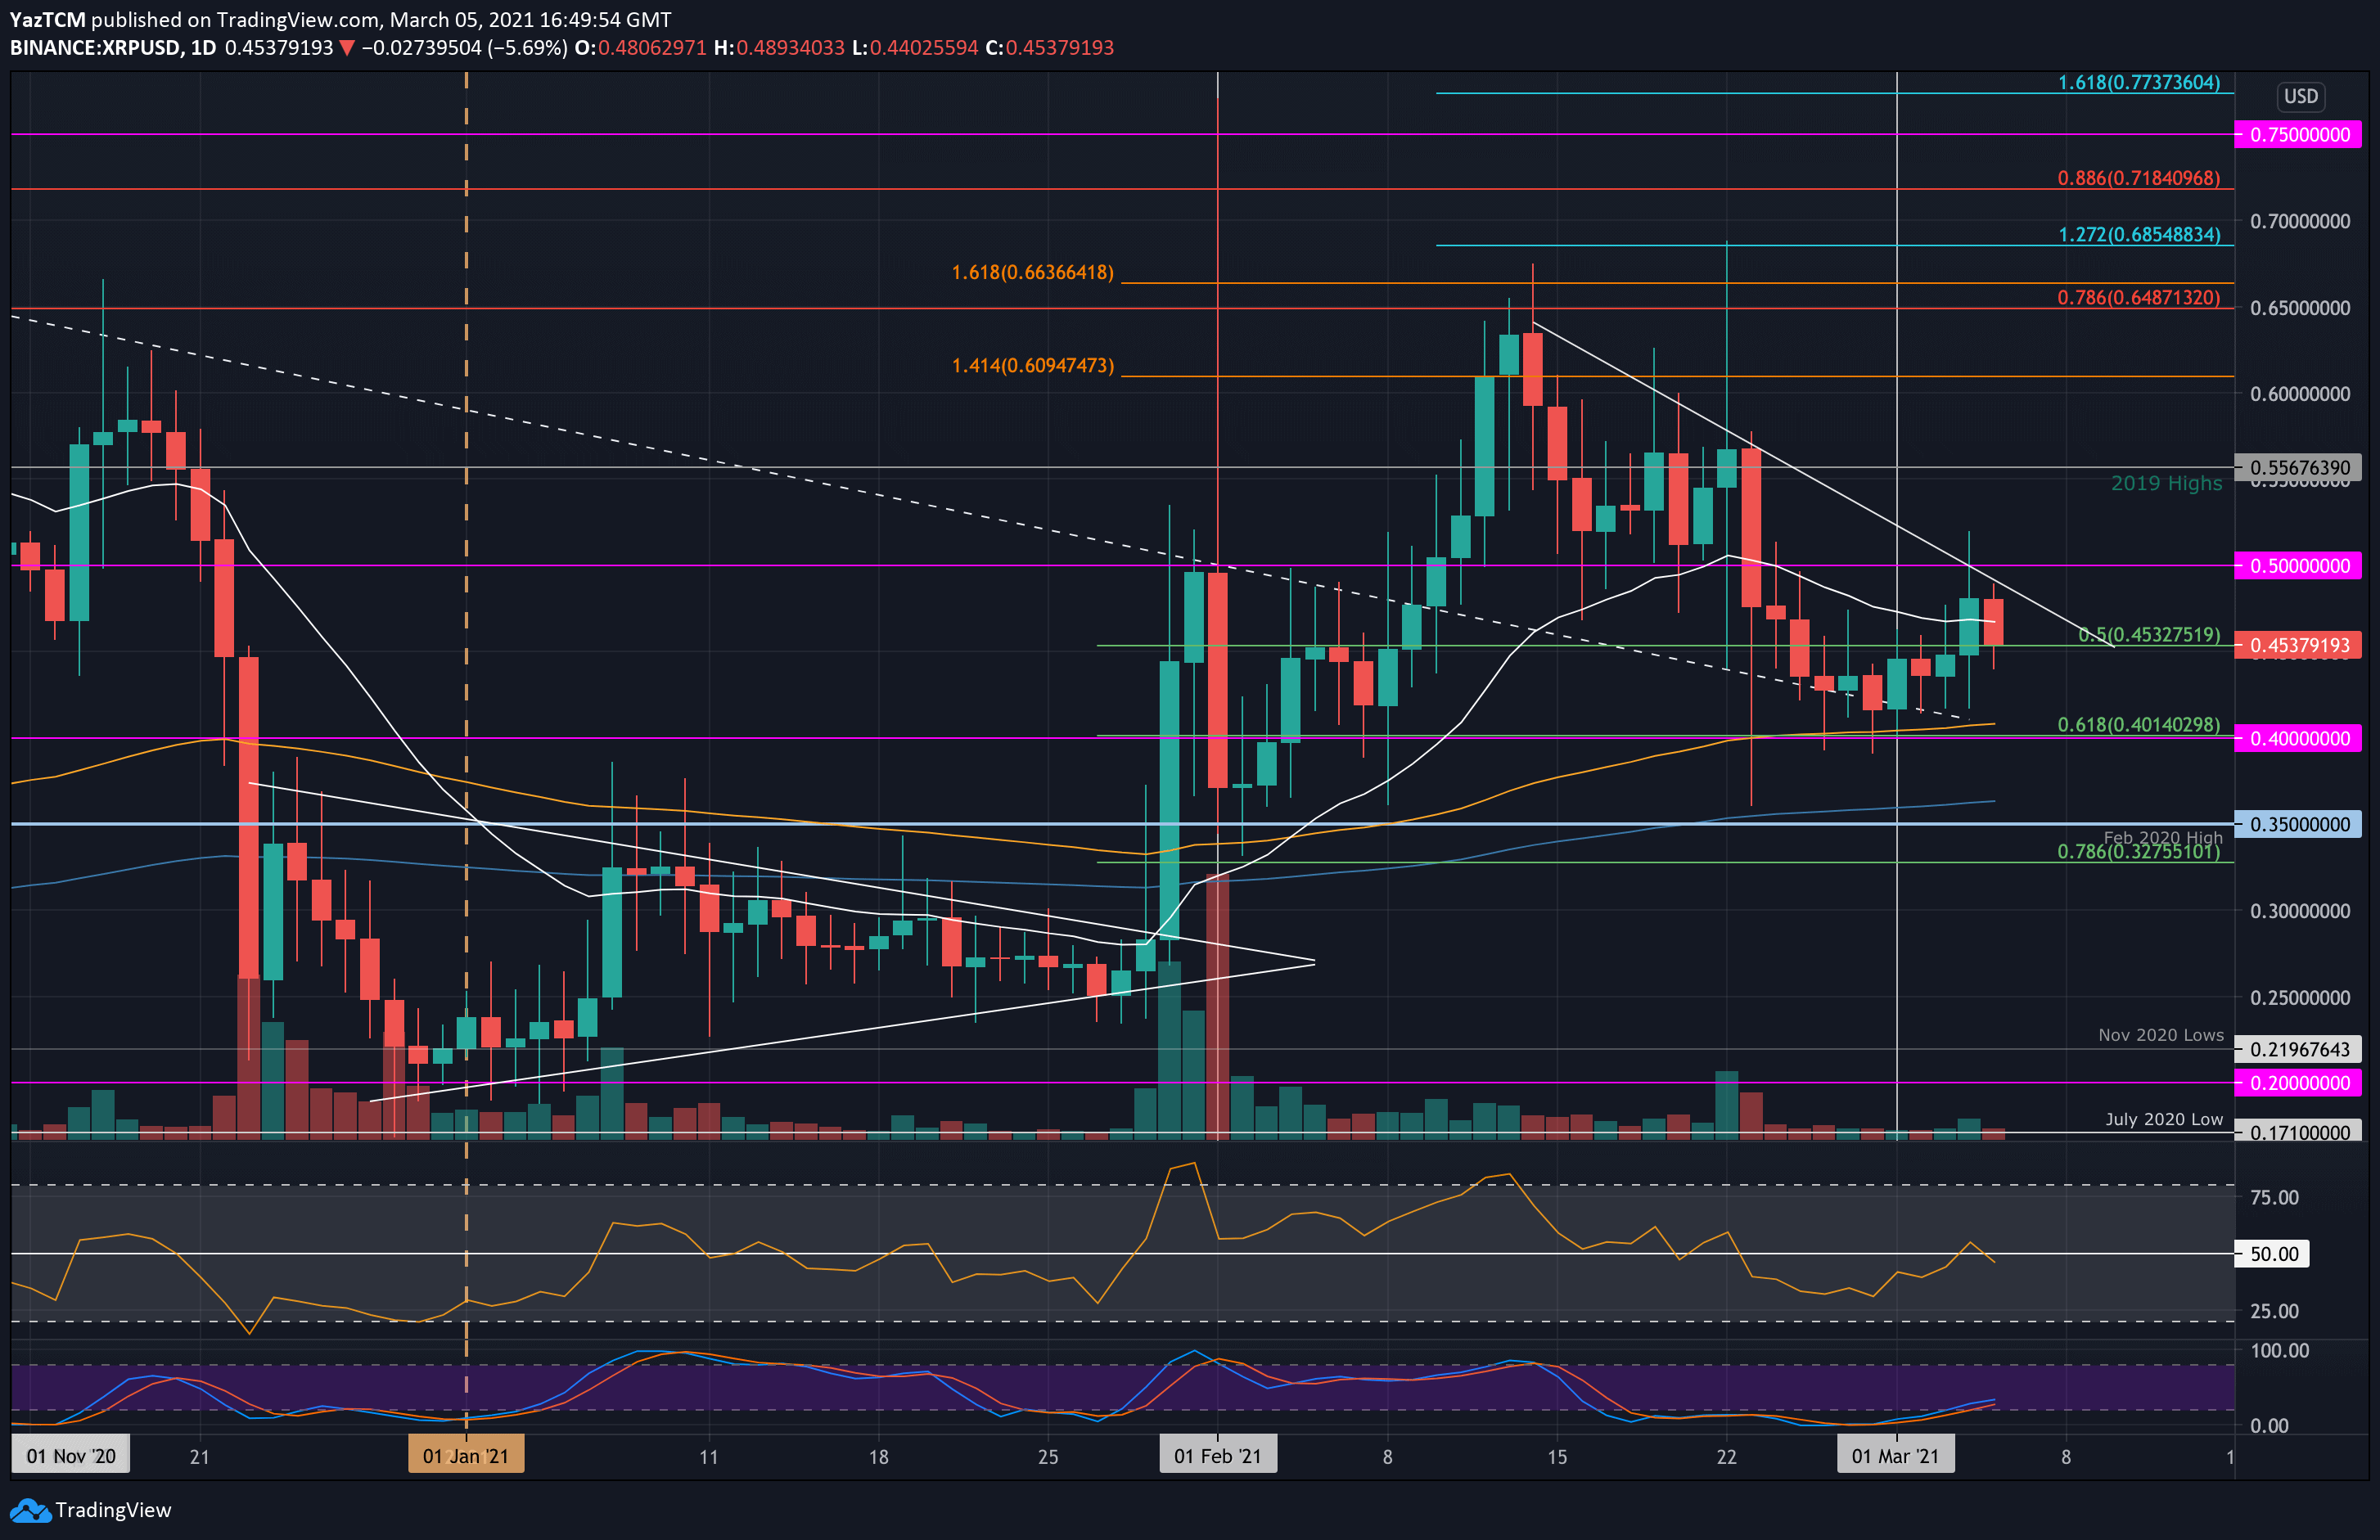
XRP has seen positive growth over the past seven days after it increased by 5.8% over the period. The coin found support at $0.4 at the start of the week as it rebounded from the .618 Fib Retracement here.
From there, it started to climb higher over the past five days until reaching resistance at $0.482 yesterday. It did manage to spike above $0.5 but could not close a daily candle above $0.482. There was a descending trend line that provided resistance at this level. Today, XRP has dropped slightly as it trades at the $0.452 support provided by a .5 Fib.
Moving forward, the first level of resistance lies at the descending trend line. Above this, resistance lies at $0.5, $0.53, $0.556 (2019 Highs), and $0.6.
On the other side, the first support beneath $0.452 lies at $0.42. This is followed by $0.4 (.618 Fib & 100-days EMA), $0.38, and $0.36 (200-days EMA).
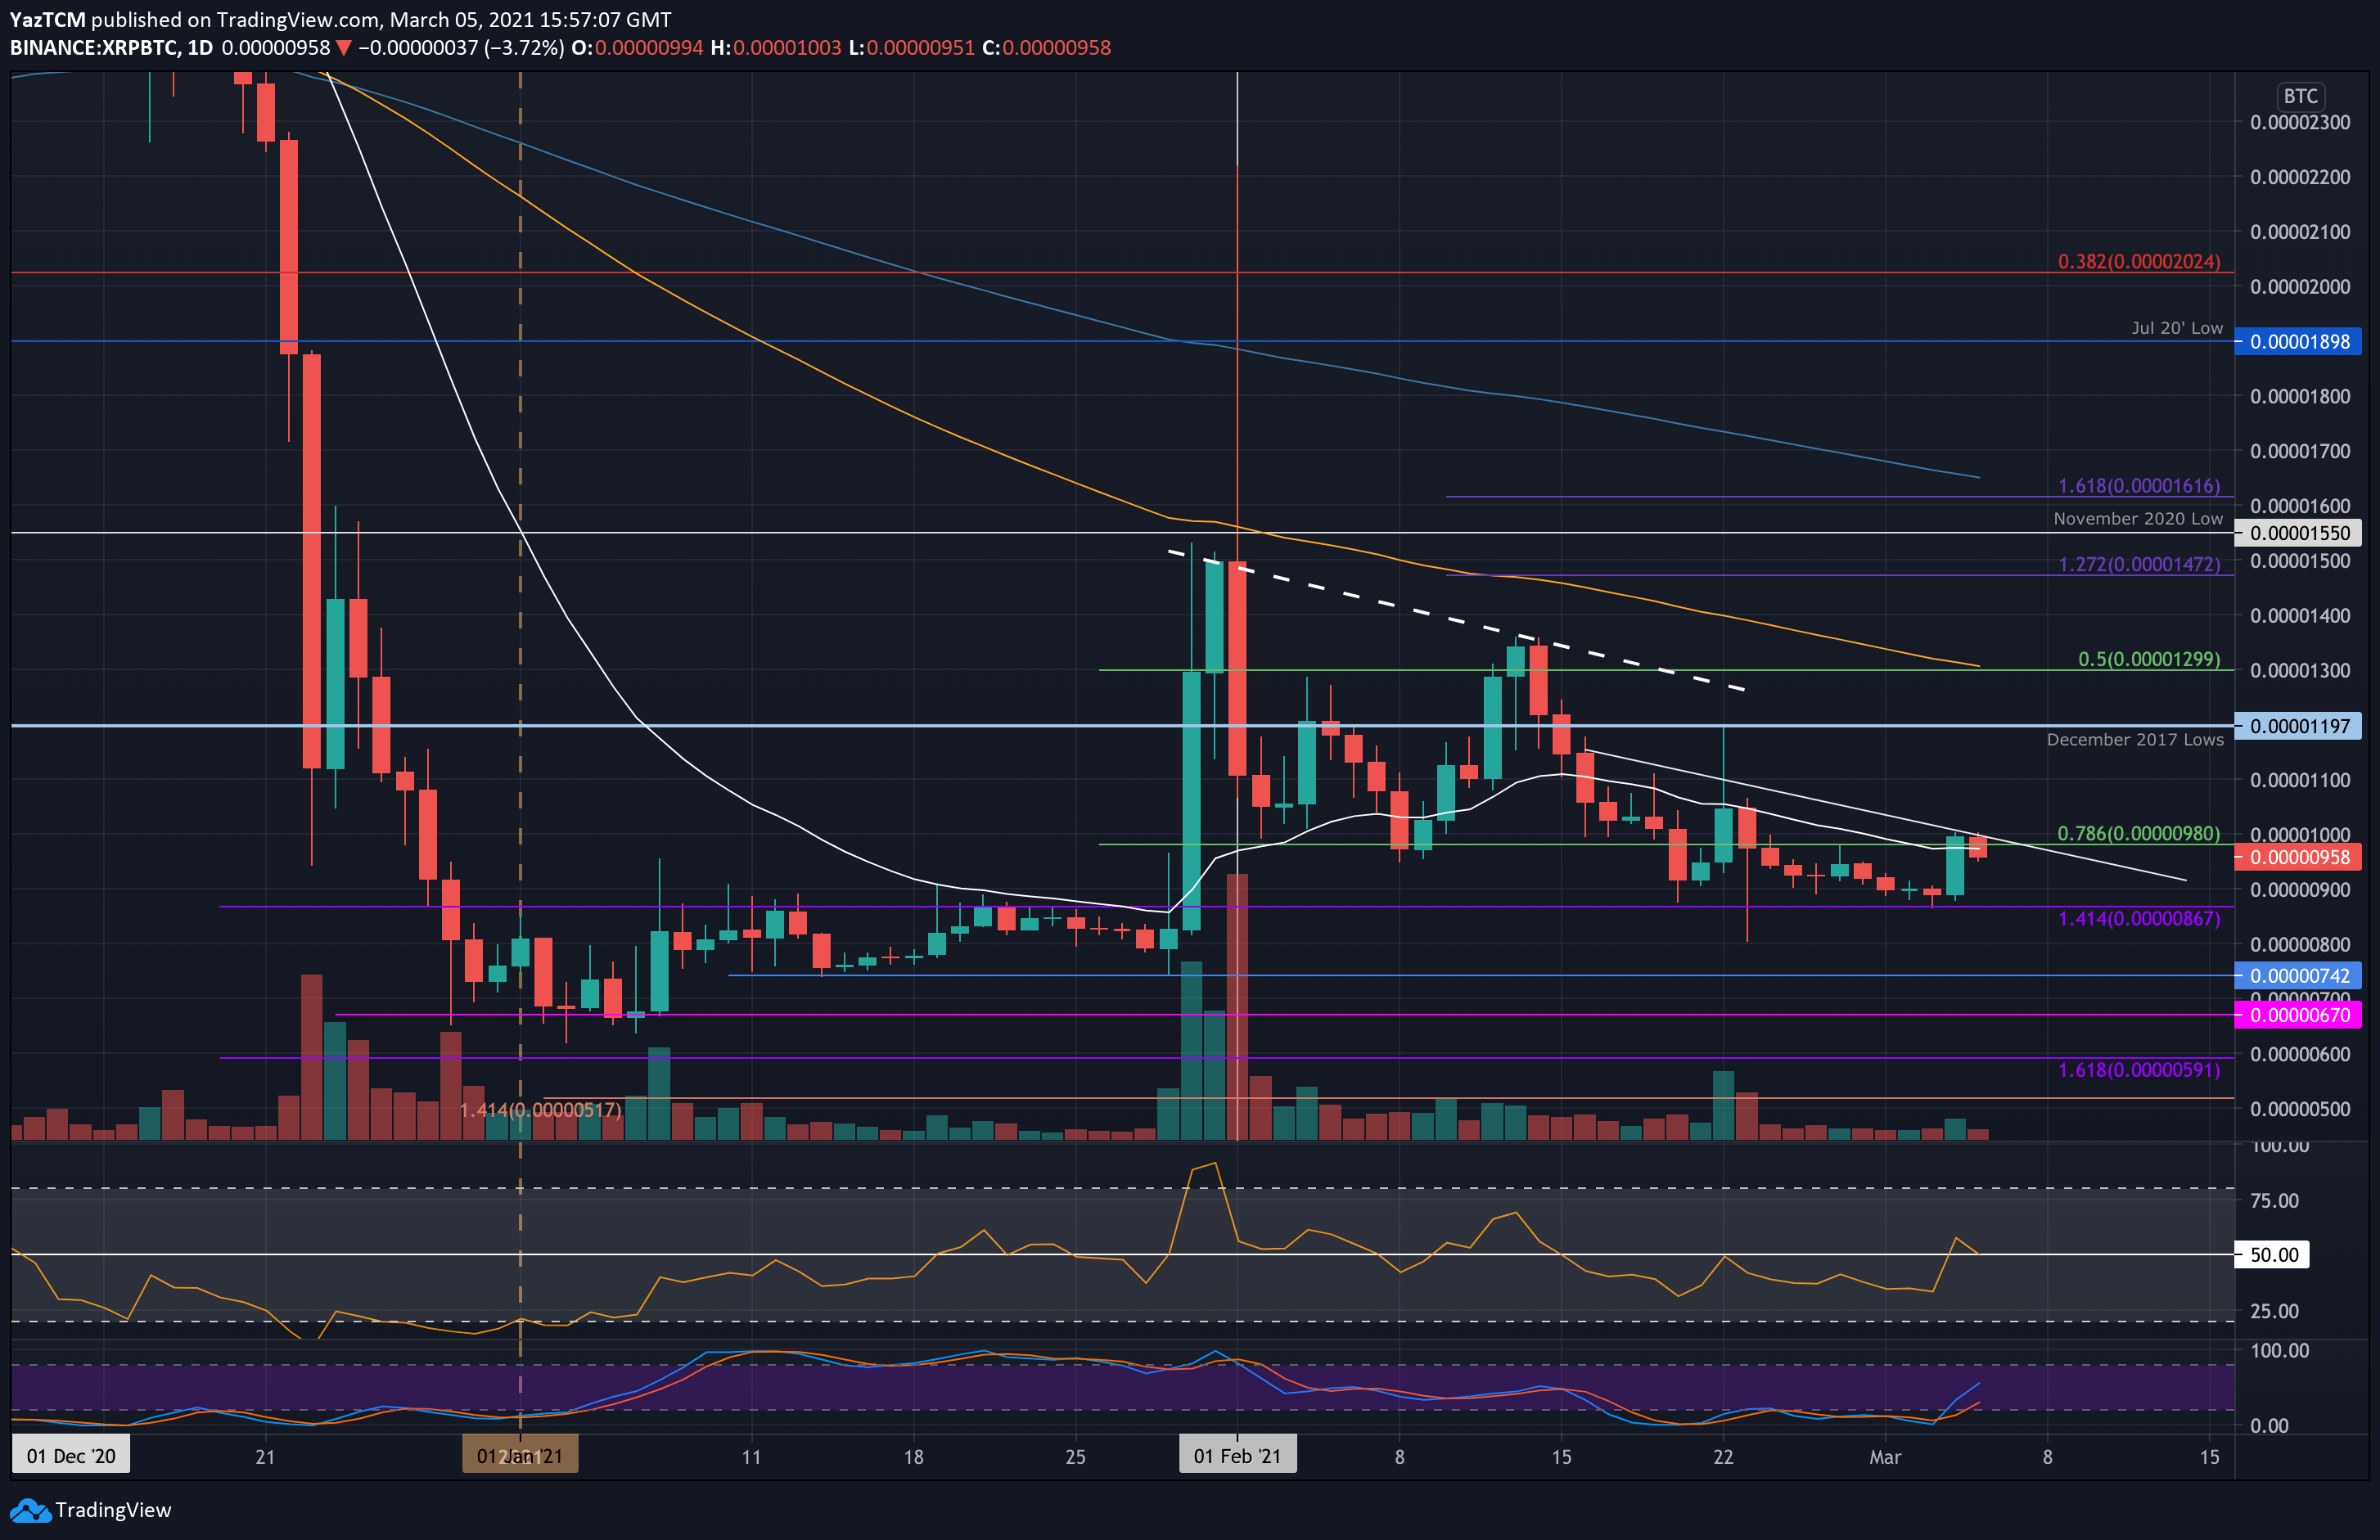
Against Bitcoin, XRP was trading lower throughout most of the week as it dropped from 980 SAT to reach as low as 867 SAT (upper January range). Yesterday, the bulls forced a rebound as XRP surged higher toward 1000 SAT.
It could not break the resistance here and has since dropped slightly to 958 SAT.
Looking ahead, the first level of support lies at 900 SAT. This is followed by 867 SAT, 800 SAT, 742 SAT, and 670 SAT (January lower range).
On the other side, the first level of strong resistance lies at 1000 SAT. This is followed by 1100 SAT, 1200 SAT (Decemmber 2017 lows), and 1300 SAT (100-days EMA).
Cardano
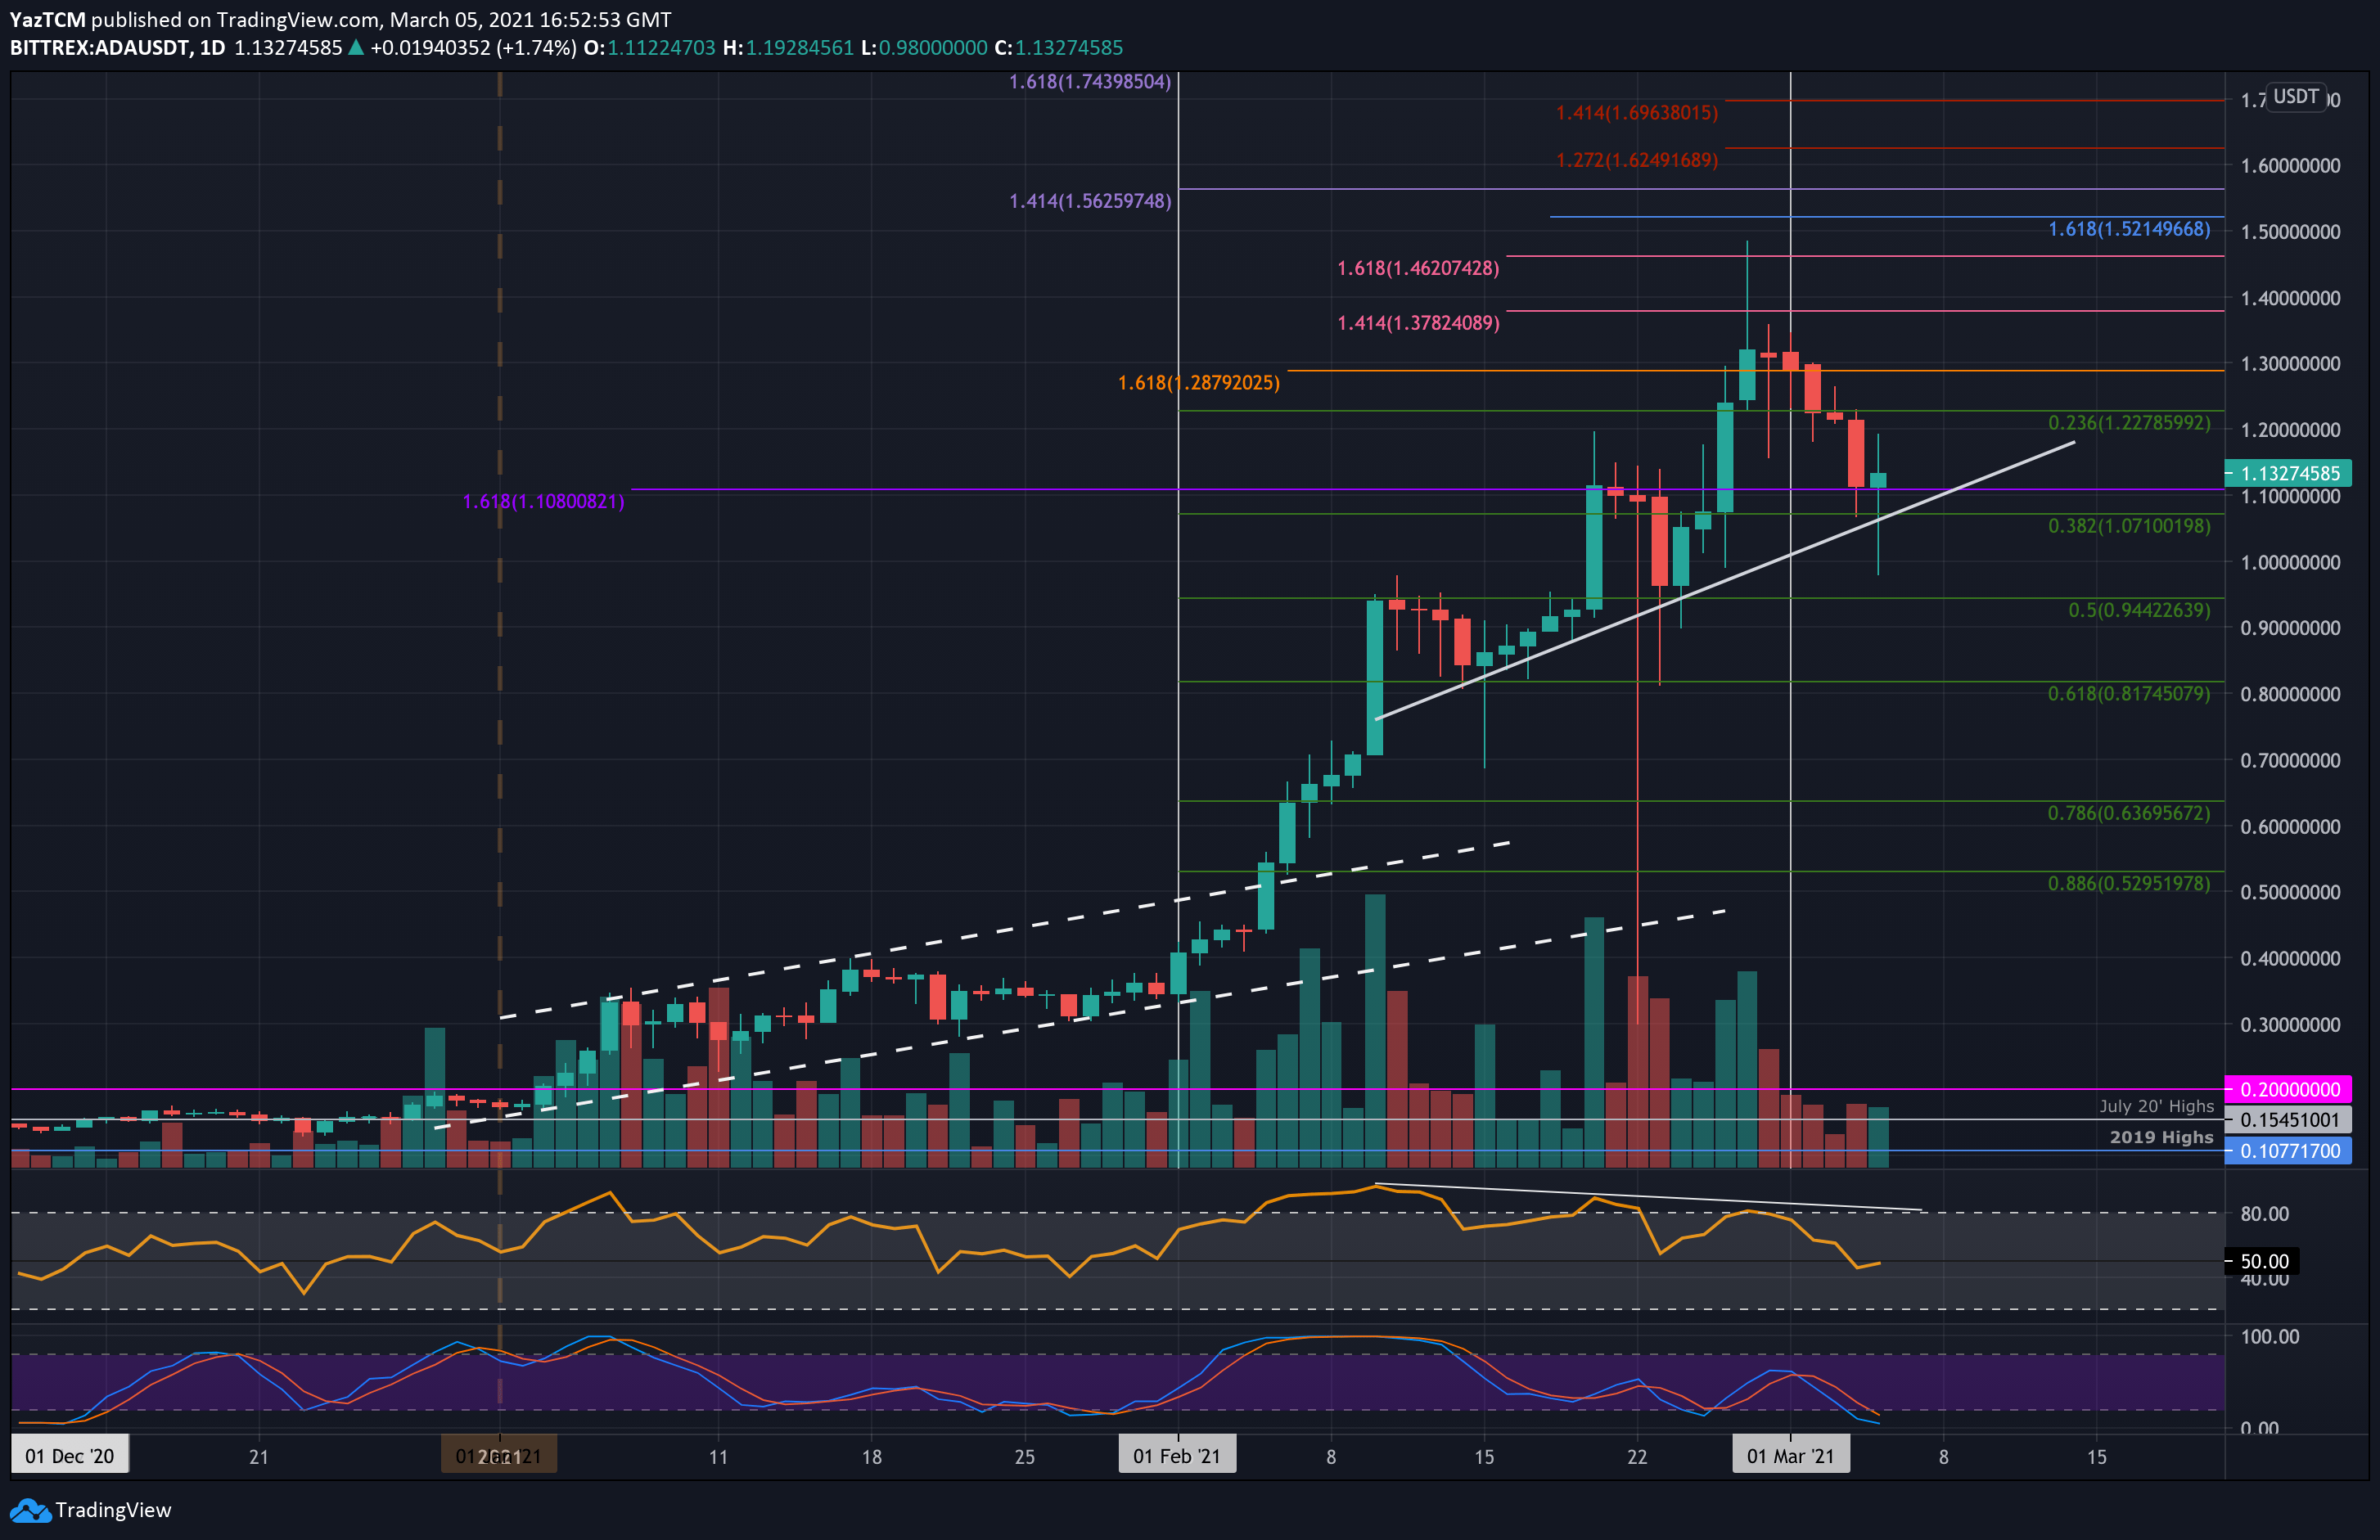
Cardano is also up by a total of 6% this week as it currently trades at the $1.13 level. The cryptocurrency had pushed higher from $1.07 toward the end of last week to set a new ATH price at $1.48 over the weekend.
It started to head lower from there throughout the week as it broke beneath support at $1.22 (.236 Fib) to find lower support at $1.10 yesterday. Today, ADA briefly slipped beneath the $1.00 level, but the bulls quickly regrouped to bring the price back above $1.10. It is being supported by a short-term ascending trend line.
Moving forward, the first level of resistance lies at $1.20. This is followed by $1.32, $1.38 (1414 Fib Extension), $1.40, and $1.48 (ATH price). Above the ATH, added resistance lies at $1.52, $1.56, $1.62, and $1.69.
On the other side, the first level of strong support lies at $1.10. This is followed by $1.07 (.382 Fib & rising trend line), $1.00, and $0.95 (.5 Fib).
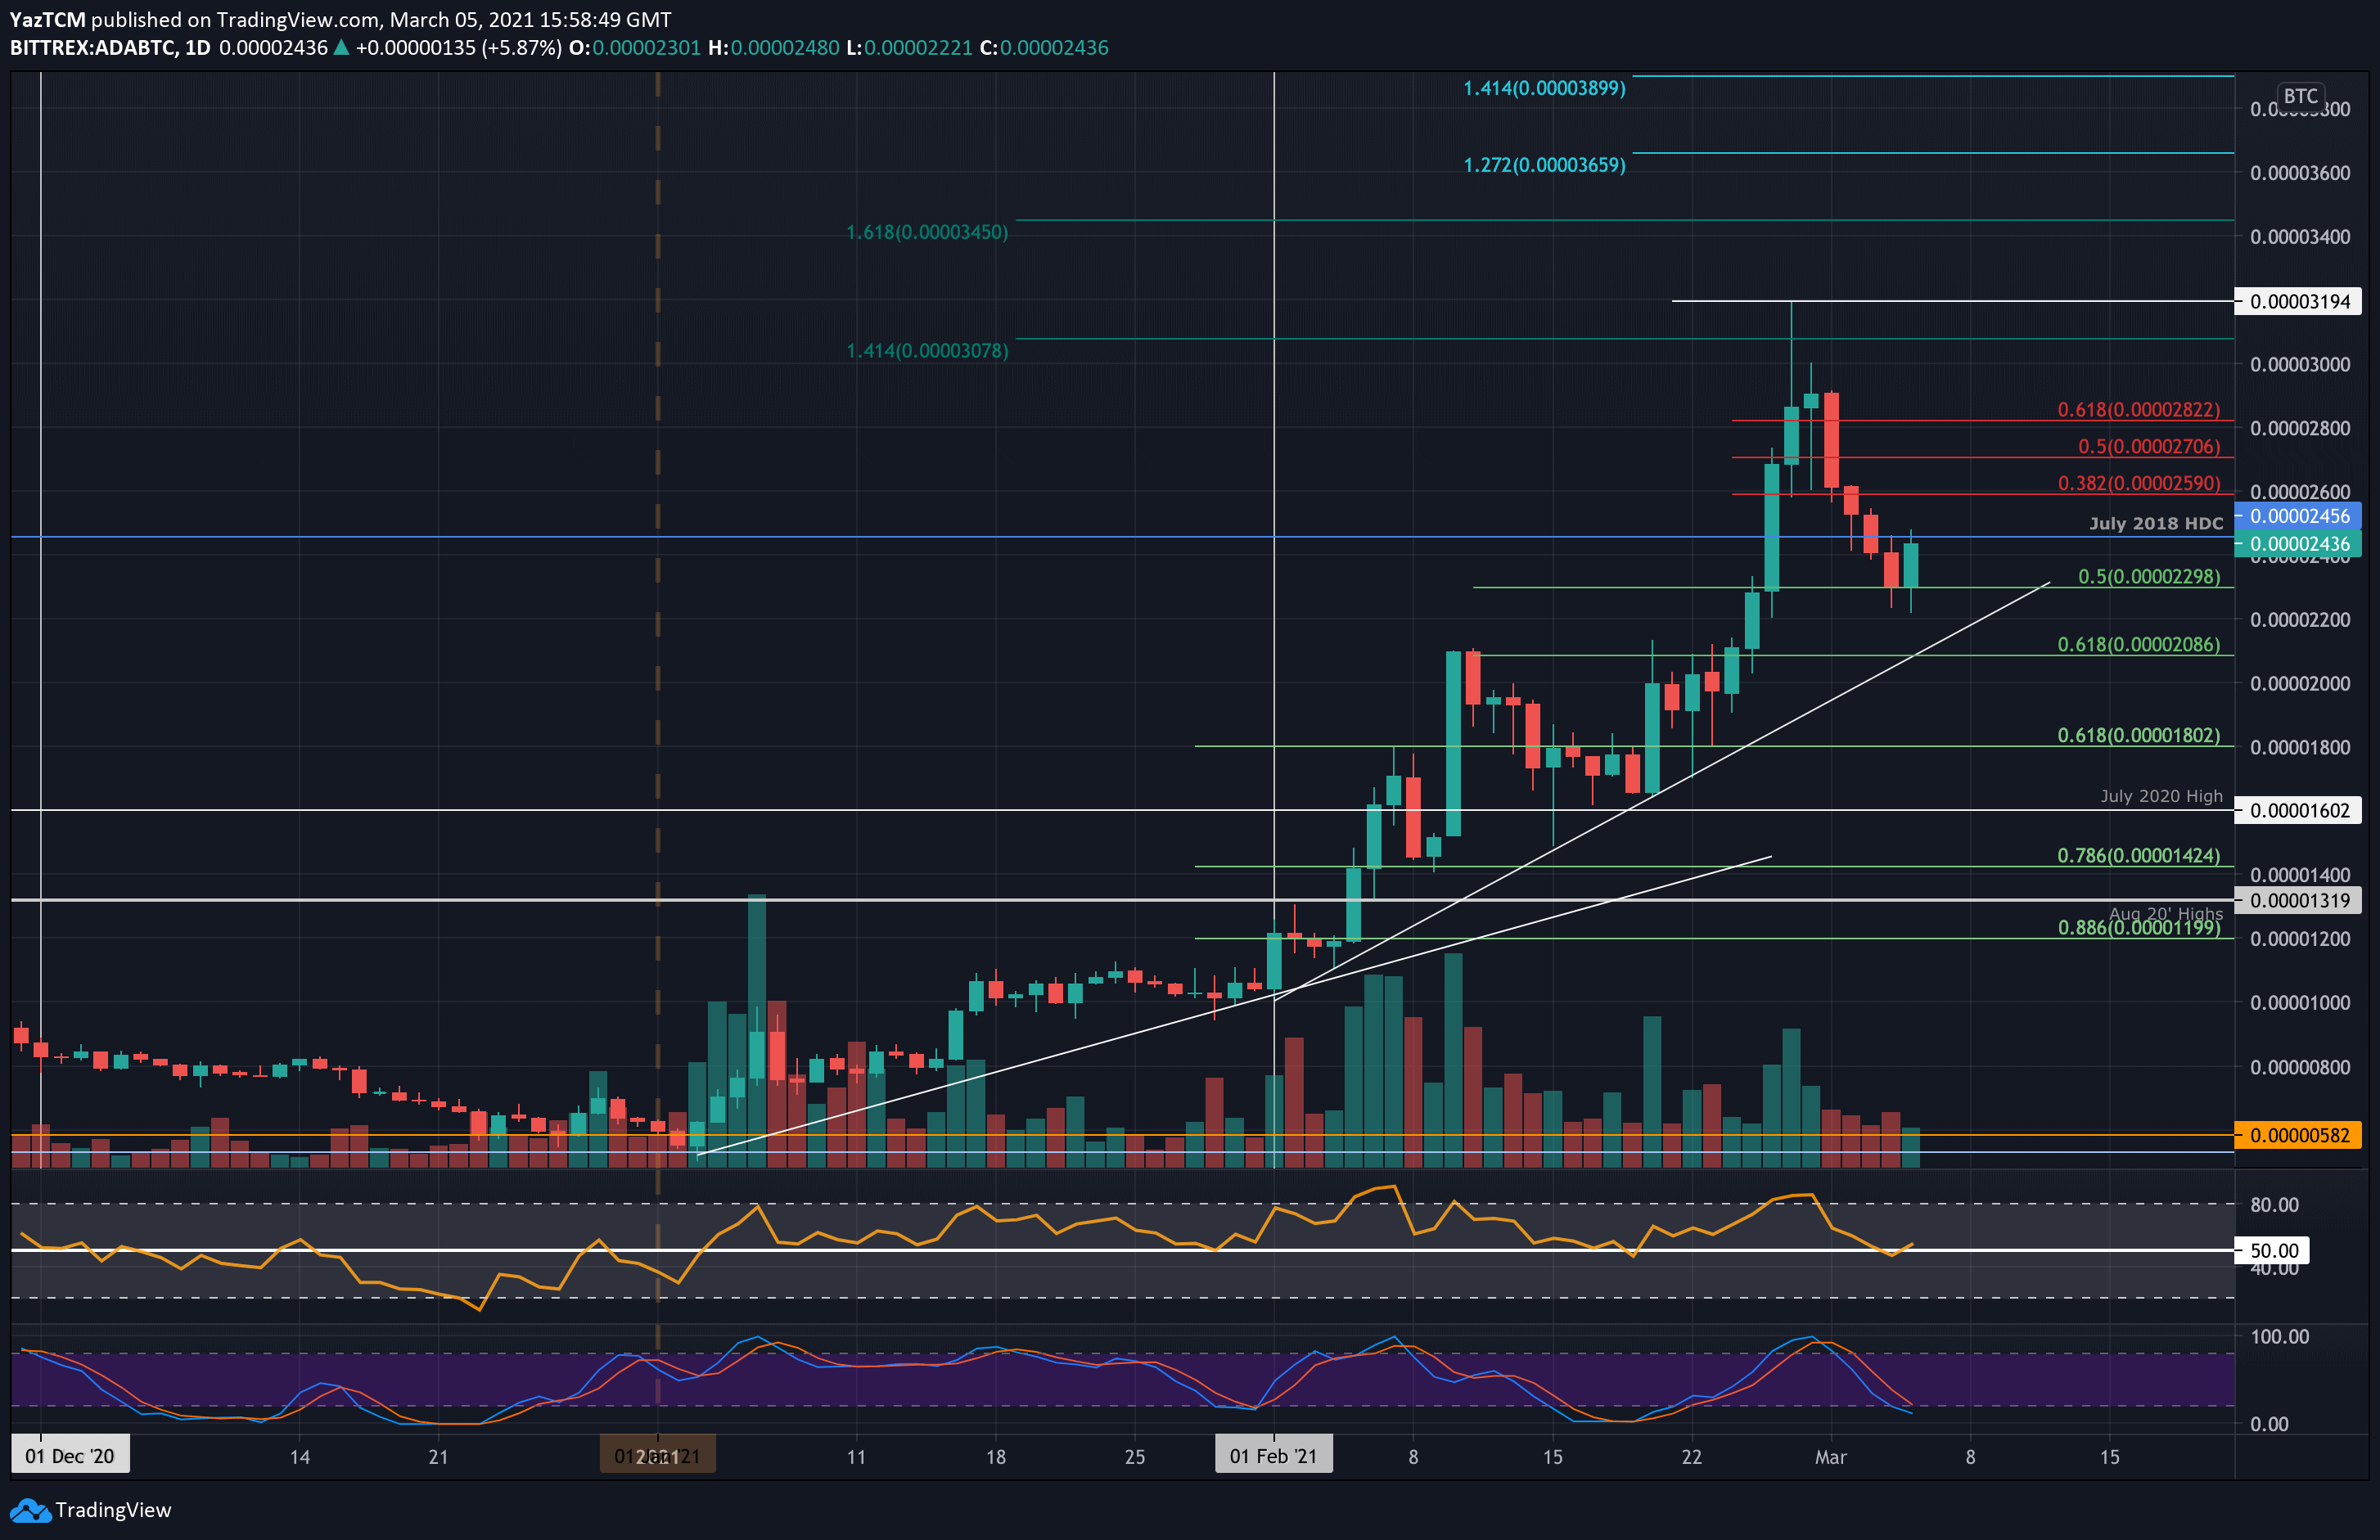
Against Bitcoin, ADA had pushed into fresh 2021 highs at 3194 SAT over the weekend. Over the course of this week, ADA has slowly been grinding lower until support was found at 2298 SAT (.5 Fib) yesterday.
The bulls rebounded from 2298 SAT today as they pushed higher into resistance at 2456 SAT (July 18’ High-Day Closing Price).
Looking ahead, if the buyers break 2456 SAT, the first level of resistance lies at 2590 SAT (bearish .382 Fib). This is followed by 2700 SAT (bearish .5 Fib), 2822 SAT (bearish .618 Fib), and 3000 SAT.
On the other side, the first level of support lies at 2298 SAT (.5 Fib). This is followed by 2200 sAT, 2086 SAT (.618 Fib), 2000 SAT, and 1800 SAT.
Polkadot
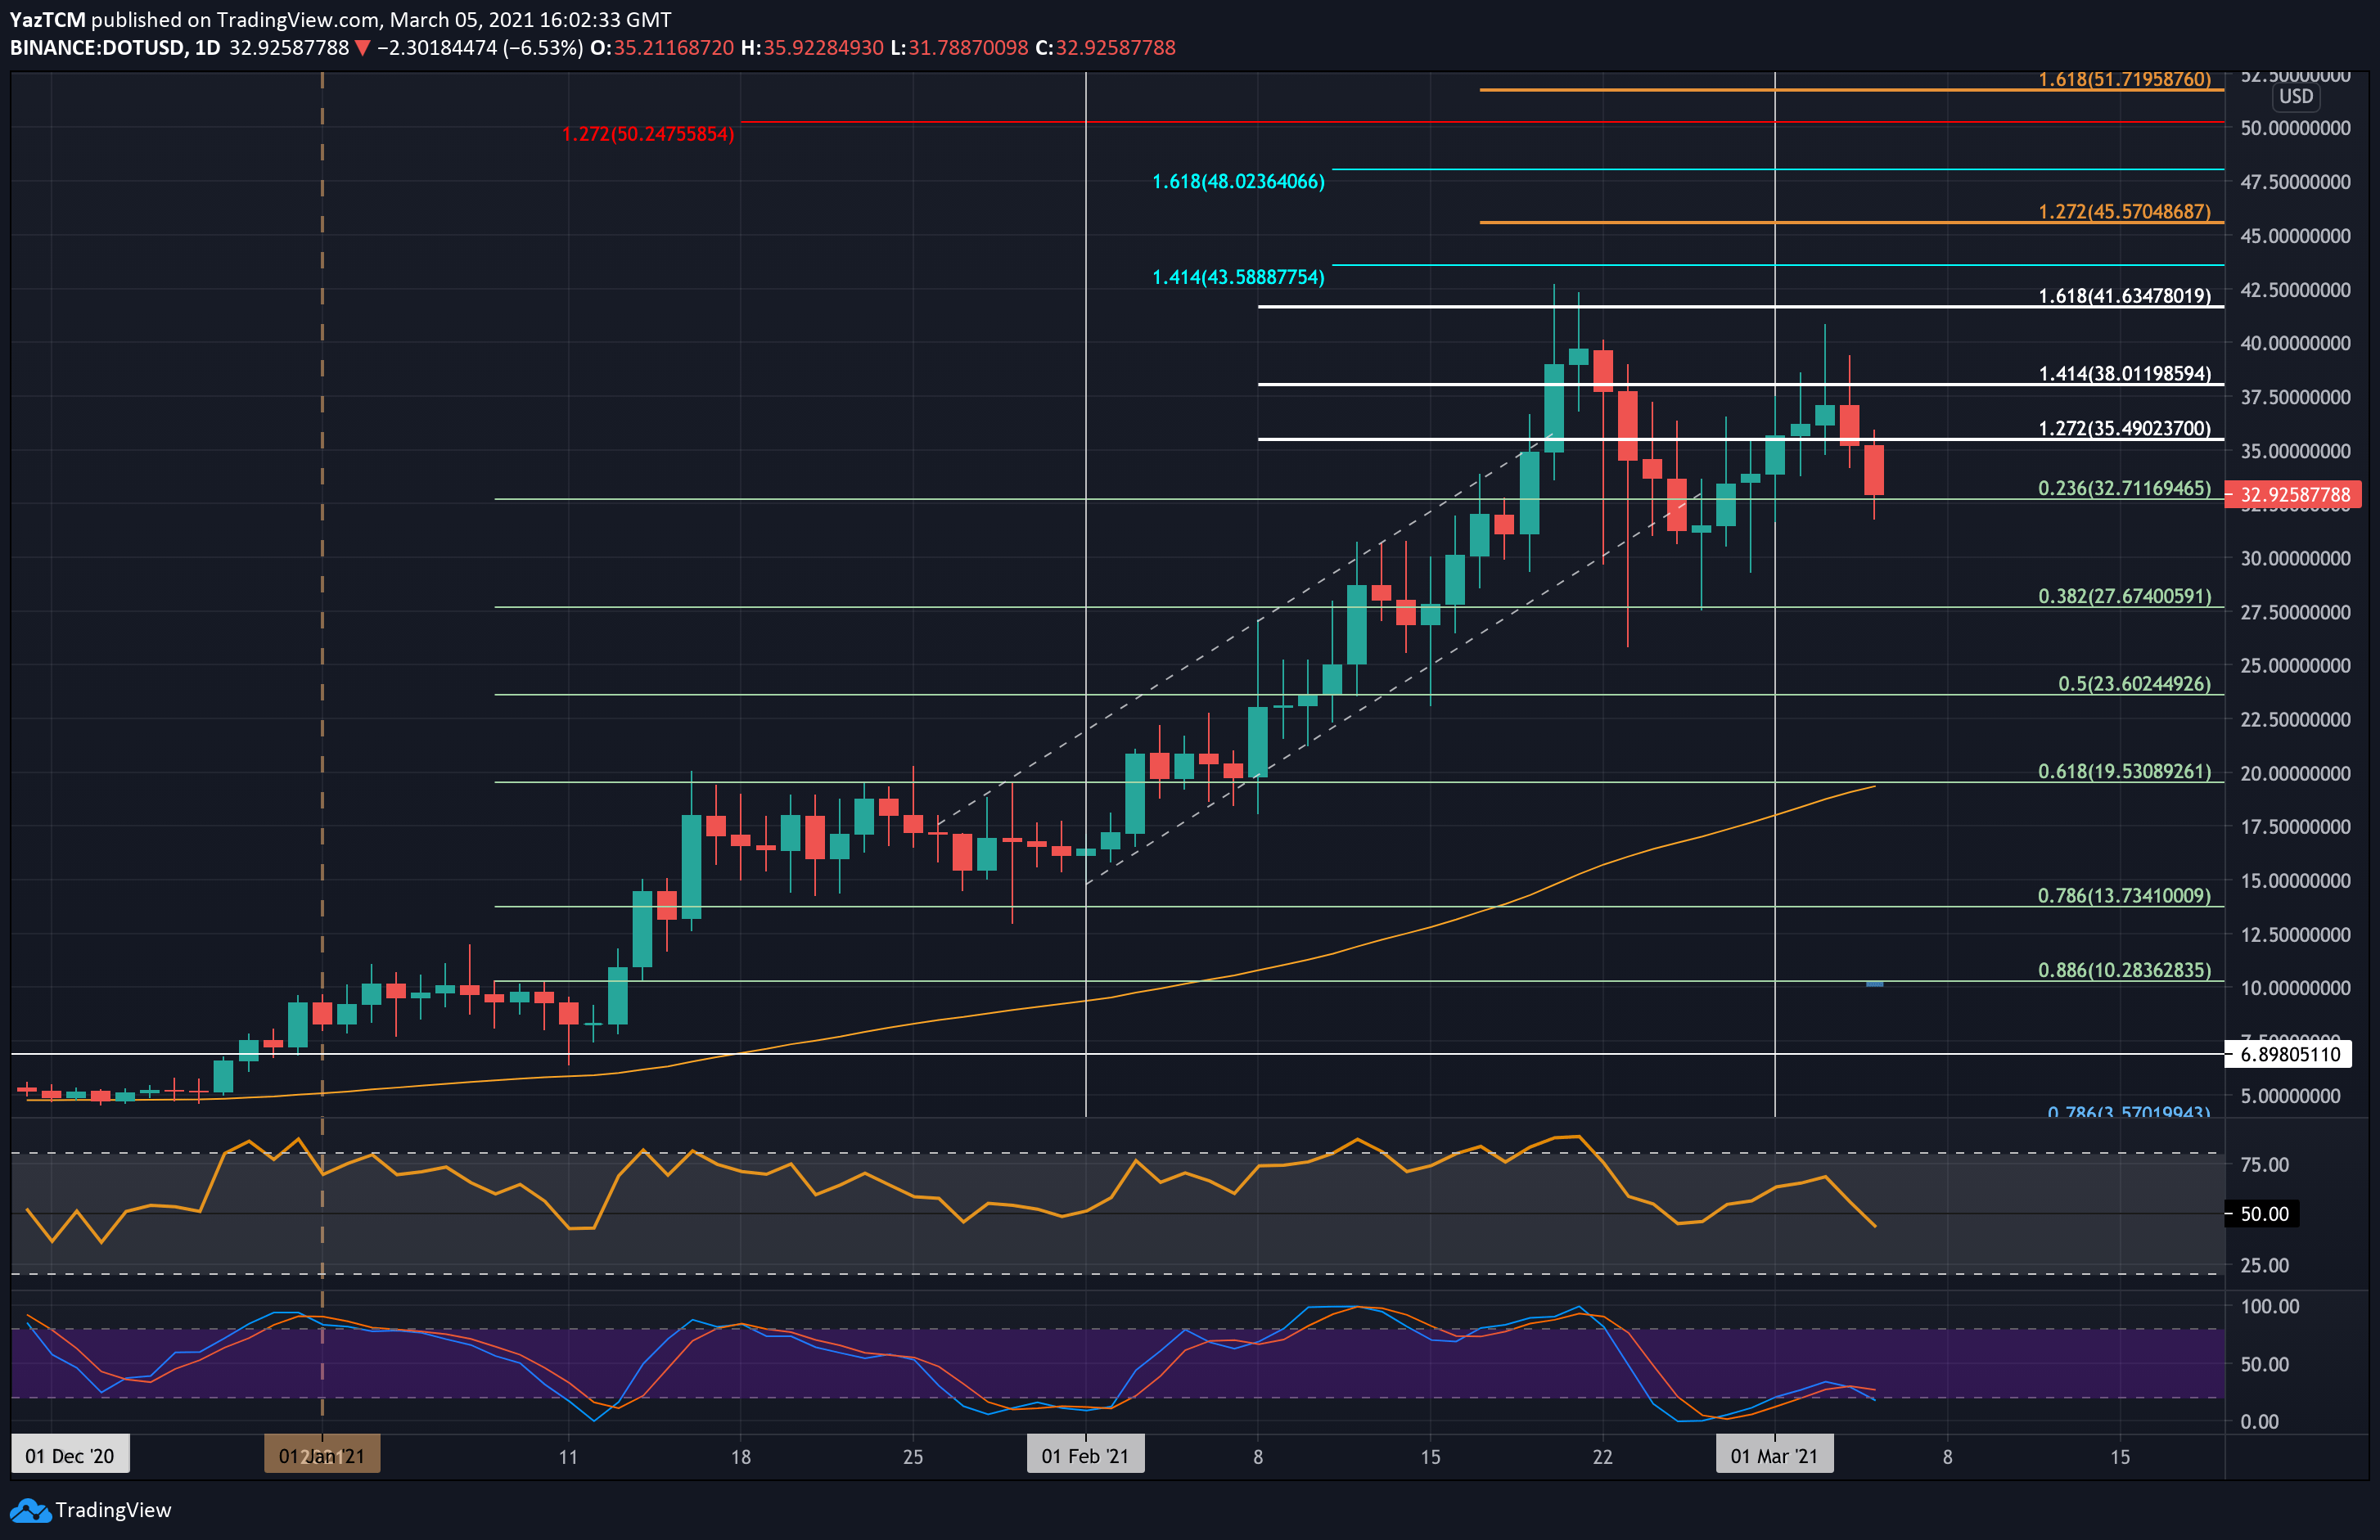
Polkadot is up by a small 3.8% over the week as it currently sits at the $32.71 (.382 Fib) support. The cryptocurrency had bounced higher from $31 over the weekend as it started to grind upward. It managed to spike above $40 on Wednesday but could not close a daily candle above $37.50.
From there, DOT has dropped lower over the past two days as it falls into the support at $32.71 (.236 Fib Retracement).
Moving forward, if the bears push beneath $32.71, the first level of support lies at $31. This is followed by $30, $27.67 (.382 Fib), $25, and $23.60 (.5 Fib).
On the other side, the first resistance lies at $35.50 (1.272 Fib Extension). Above this, resistance lies at $38 (1.414 Fib Extension), $40, and $42.50 (ATH price).
DOT is also seeing a similar pattern against Bitcoin. The coin had rebounded from a rising trend line over the weekend and managed to push higher throughout the week to reach an ATH at 77,550 SAT on Wednesday.
Unfortunately, it could not close a daily candle above 75,000 SAT and ended up rolling over to drop into the current support at 68,900 SAT, provided by the ascending trend line.
Looking ahead, if the bears push beneath the trend line, the first level of strong support lies at 64,000 SAT (.236 Fib). This is followed by 59,670 SAT (previous ATH), 55,845 SAT (.382 Fib), and 49,230 SAT (.5 Fib & 100-days EMA).
On the other side, the first level of strong resistance lies at 75,000 SAT. This is followed by the ATH price at 77,550 SAT, 80,000 SAT, 81,555 SAT (1.618 Fib Extension), and 85,467 SAT (1.414 Fib Extension – orange).
