ETH/USD – Ethereum Continues Higher After 00 ReboundKey Support Levels: 75, 30, 00.Key Resistance Levels: 90, 25. 39.Last Thursday, Ethereum took a steep price fall when it dropped from 90 to hit the support at 00, provided by a .382 Fib Retracement level.On Friday, it dipped further, hitting a low of 50. However, it quickly reversed and started to rebound higher from there. Yesterday, it was struggling to break resistance at 76 (bearish .886 Fib Retracement) but managed to find support at 30 (.236 Fib).Today, the 5% price hike allowed ETH to penetrate above 76 to reach as high as 50 to meet resistance at a 1.272 Fib Extension.ETH/USD Daily Chart. Source: TradingViewETH-USD Short Term Price PredictionLooking ahead, the first level of resistance
Topics:
Yaz Sheikh considers the following as important: ETH Analysis, ETHBTC, Ethereum (ETH) Price, ethusd
This could be interesting, too:
Mandy Williams writes Ethereum Derivatives Metrics Signal Modest Downside Tail Risk Ahead: Nansen
Jordan Lyanchev writes Weekly Bitcoin, Ethereum ETF Recap: Light at the End of the Tunnel for BTC
CryptoVizArt writes Will Weak Momentum Drive ETH to .5K? (Ethereum Price Analysis)
Jordan Lyanchev writes Bybit Hack Fallout: Arthur Hayes, Samson Mow Push for Ethereum Rollback
ETH/USD – Ethereum Continues Higher After $1100 Rebound
Key Support Levels: $1275, $1230, $1100.
Key Resistance Levels: $1390, $1425. $1439.
Last Thursday, Ethereum took a steep price fall when it dropped from $1390 to hit the support at $1100, provided by a .382 Fib Retracement level.
On Friday, it dipped further, hitting a low of $1050. However, it quickly reversed and started to rebound higher from there. Yesterday, it was struggling to break resistance at $1276 (bearish .886 Fib Retracement) but managed to find support at $1230 (.236 Fib).
Today, the 5% price hike allowed ETH to penetrate above $1276 to reach as high as $1350 to meet resistance at a 1.272 Fib Extension.
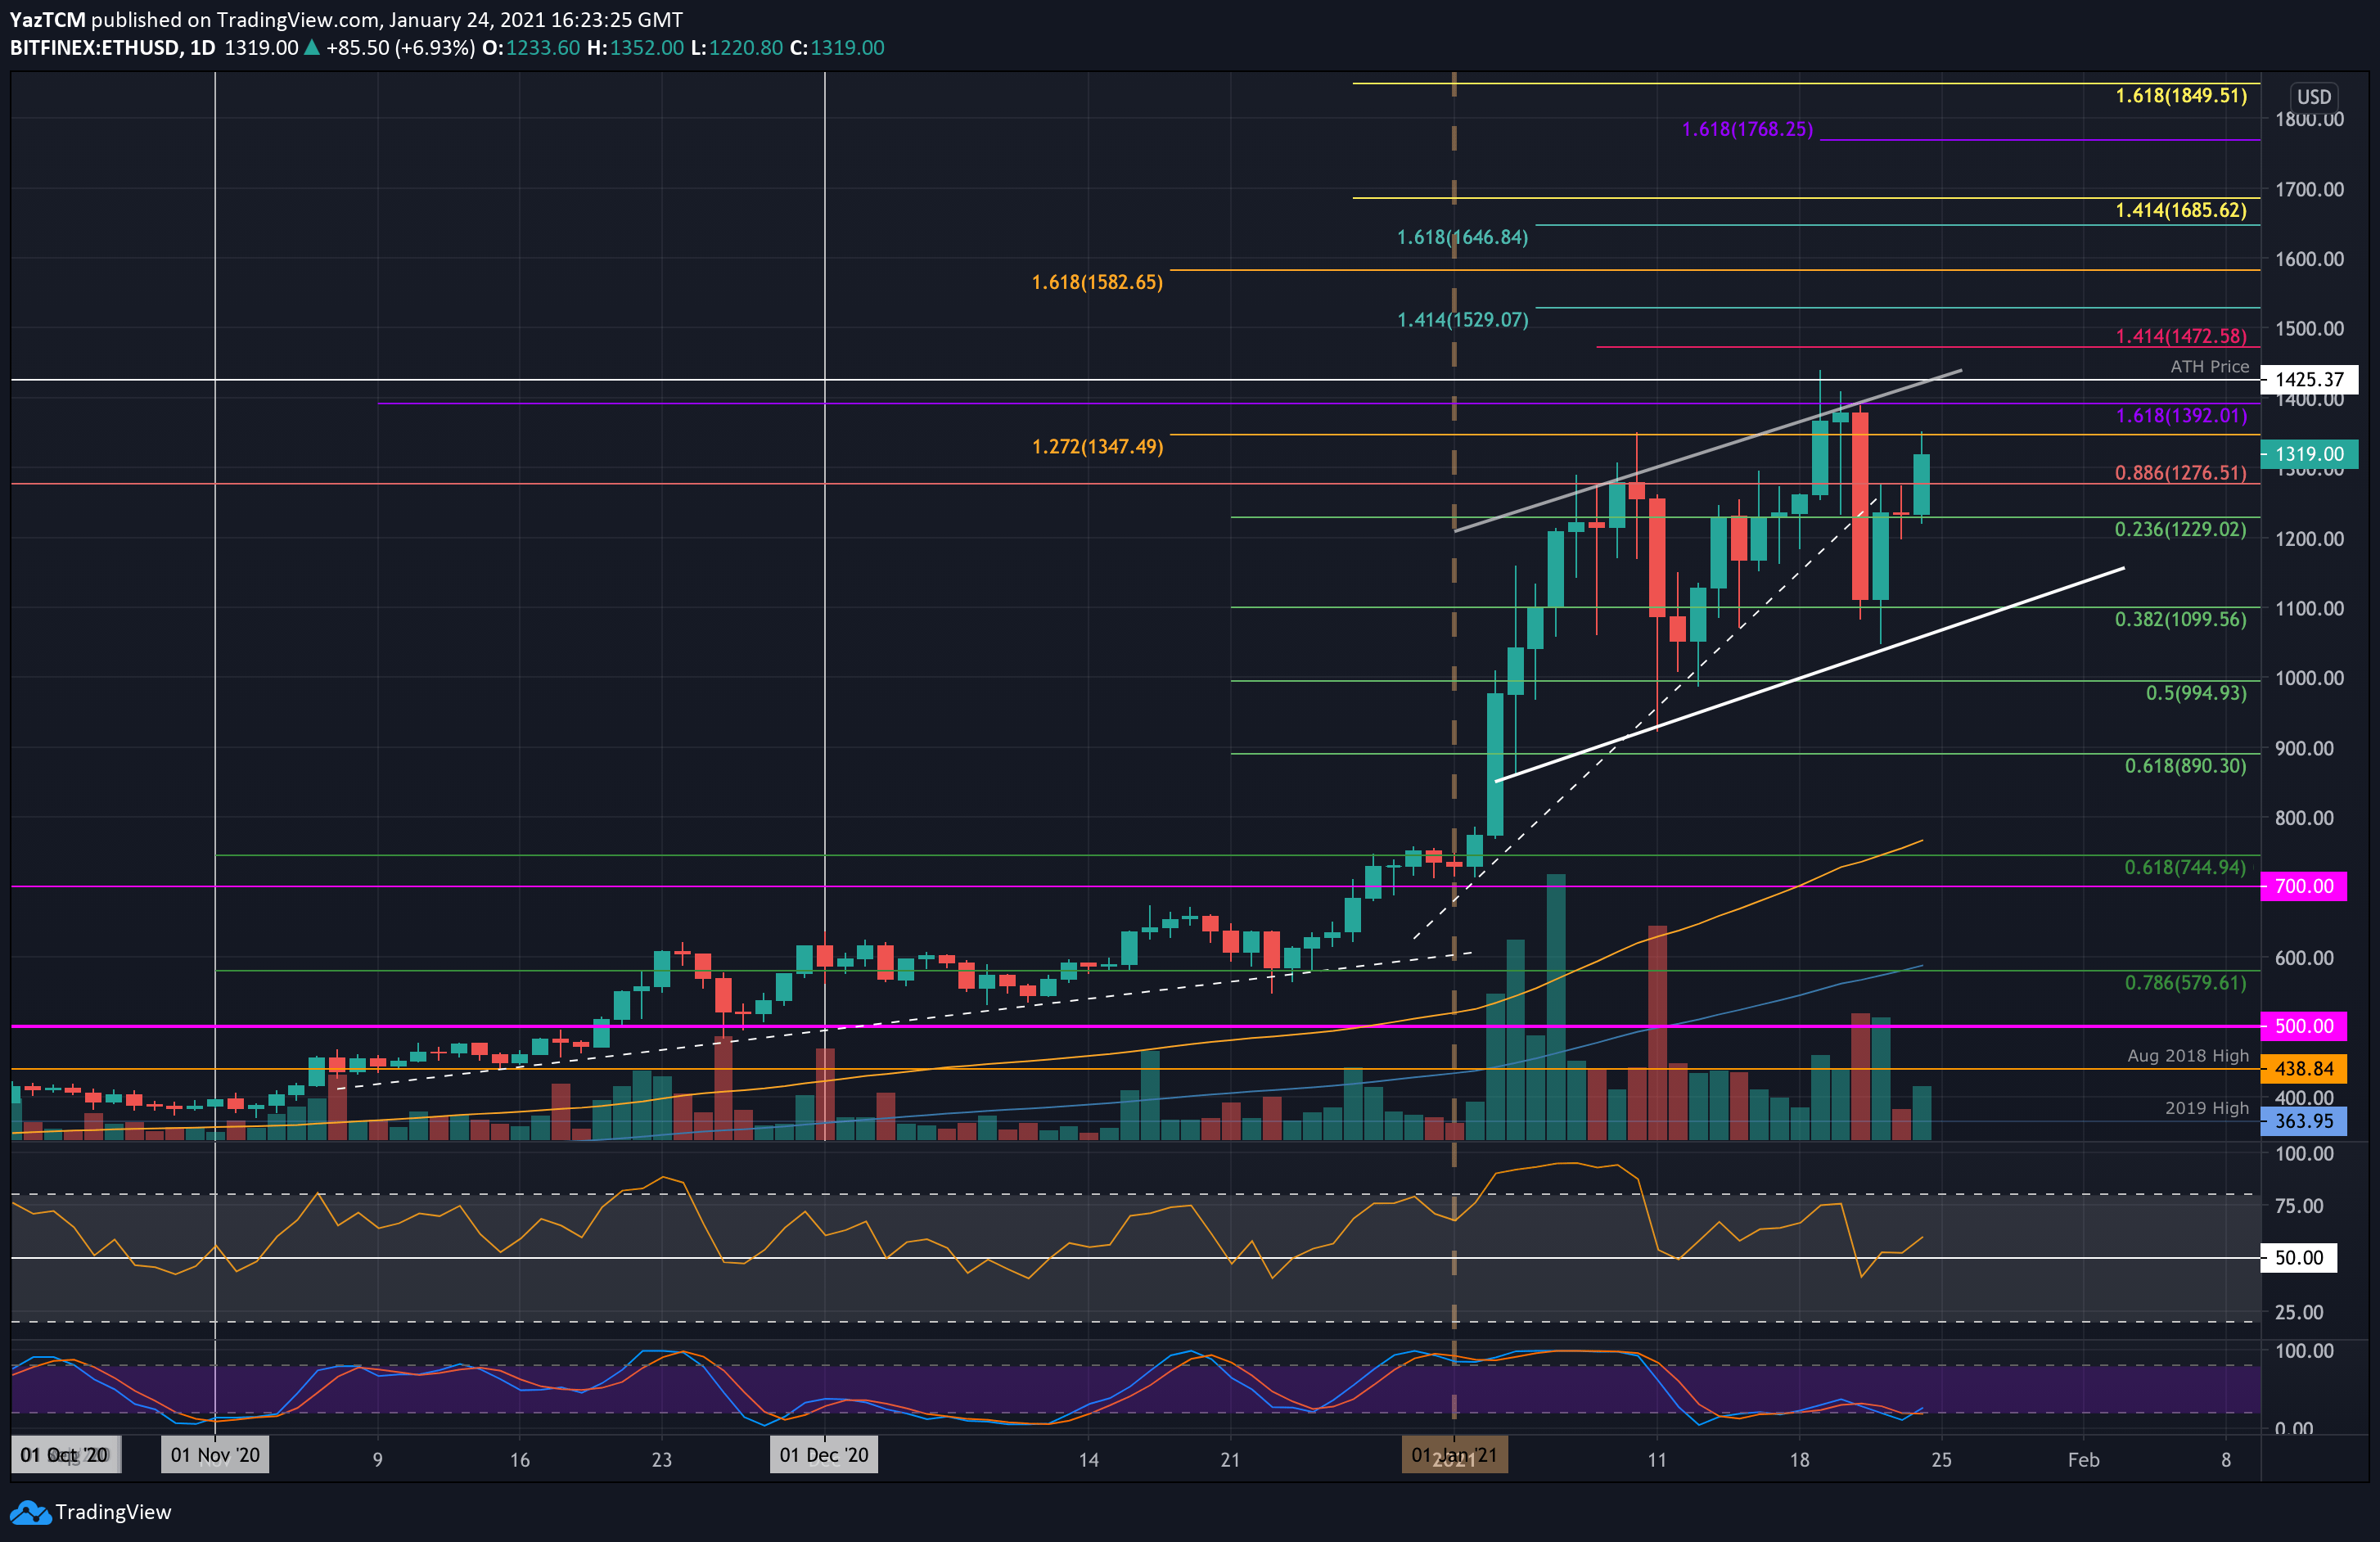
ETH-USD Short Term Price Prediction
Looking ahead, the first level of resistance lies at $1390. This is followed by resistance at $1400, $1425 (previous ATH price), and $1439 (new ATH).
Added resistance lies at $1472 (short term 1.414 Fib Extension), $1500, and $1530 (1.414 Fib Extension).
On the other side, the first level of support lies at $1275. This is followed by $1230 (.236 Fib), $1100 $.382 Fib Retracement), and $1000.
The RSI has rebounded back above the midline to indicate the bulls are back in charge of the market momentum. Additionally, the Stochastic RSI is primed for a bullish crossover signal that should allow ETH to continue upward.
ETH/BTC – Bulls Break 0.04 BTC to Reach 2019 Highs
Key Support Levels: 0.0405 BTC, 0.0396 BTC, 0.0388 BTC.
Key Resistance Levels: 0.0424 BTC, 0.043 BTC, 0.0435 BTC.
Against Bitcoin, Ethereum had found support at the 0.0361 BTC level provided by the March 2019 highs on Friday. From there, it rebounded and started to push higher again.
Today, ETH continued to surge past the 2021 resistance at 0.039 BTC as it broke the 2020 highs at 0.0405 BTC to reach the 2019 highs of 0.0416 BTC.

ETH-BTC Short Term Price Prediction
Looking ahead, the first level of resistance lies at 0.0424 BTC (1.272 Fib Extension). This is followed by 0.043 BTC, 0.0435 BTC (1.414 Fib Extension), and 0.045 BTC (1.618 Fib Extension).
On the other side, the first level of support lies at 0.0405 BTC (2020 Highs). This is followed by 0.0396 BTC (Feb 2019 Highs), 0.0388 BTC (.236 Fib), and 0.0376 BTC.
The RSI here is approaching overbought conditions but still has room to continue before becoming extremely overbought.