ETH/USD – Ether Forms Symmetrical Triangle Key Support Levels: 50, 85, 90.Key Resistance Levels: 50, 40, 00. Since surging from 00 at the end of July to meet resistance at 50 in the first half of August, Ethereum has been consolidating inside a symmetrical triangle pattern. It has made over four attempts to break the 50 resistance, provided by a bearish .618 Fib, and failed on each attempt. Recently, ETH has been using the 20-day MA as support as it battles to remain above it as it consolidates in the triangle. ETH/USD Daily Chart. Source: TradingView.ETH-USD Short Term Price Prediction Looking ahead, the first support lies at 50 (lower angle of the triangle). This is followed by support at 85 (.236 Fib), 90, 40 (.382 Fib), and 45
Topics:
Yaz Sheikh considers the following as important: ETH Analysis, ETHBTC, Ethereum (ETH) Price, ethusd
This could be interesting, too:
Mandy Williams writes Ethereum Derivatives Metrics Signal Modest Downside Tail Risk Ahead: Nansen
Jordan Lyanchev writes Weekly Bitcoin, Ethereum ETF Recap: Light at the End of the Tunnel for BTC
CryptoVizArt writes Will Weak Momentum Drive ETH to .5K? (Ethereum Price Analysis)
Jordan Lyanchev writes Bybit Hack Fallout: Arthur Hayes, Samson Mow Push for Ethereum Rollback
ETH/USD – Ether Forms Symmetrical Triangle
Key Support Levels: $3150, $2985, $2890.
Key Resistance Levels: $3350, $3540, $3700.
Since surging from $1800 at the end of July to meet resistance at $3350 in the first half of August, Ethereum has been consolidating inside a symmetrical triangle pattern. It has made over four attempts to break the $3350 resistance, provided by a bearish .618 Fib, and failed on each attempt.
Recently, ETH has been using the 20-day MA as support as it battles to remain above it as it consolidates in the triangle.
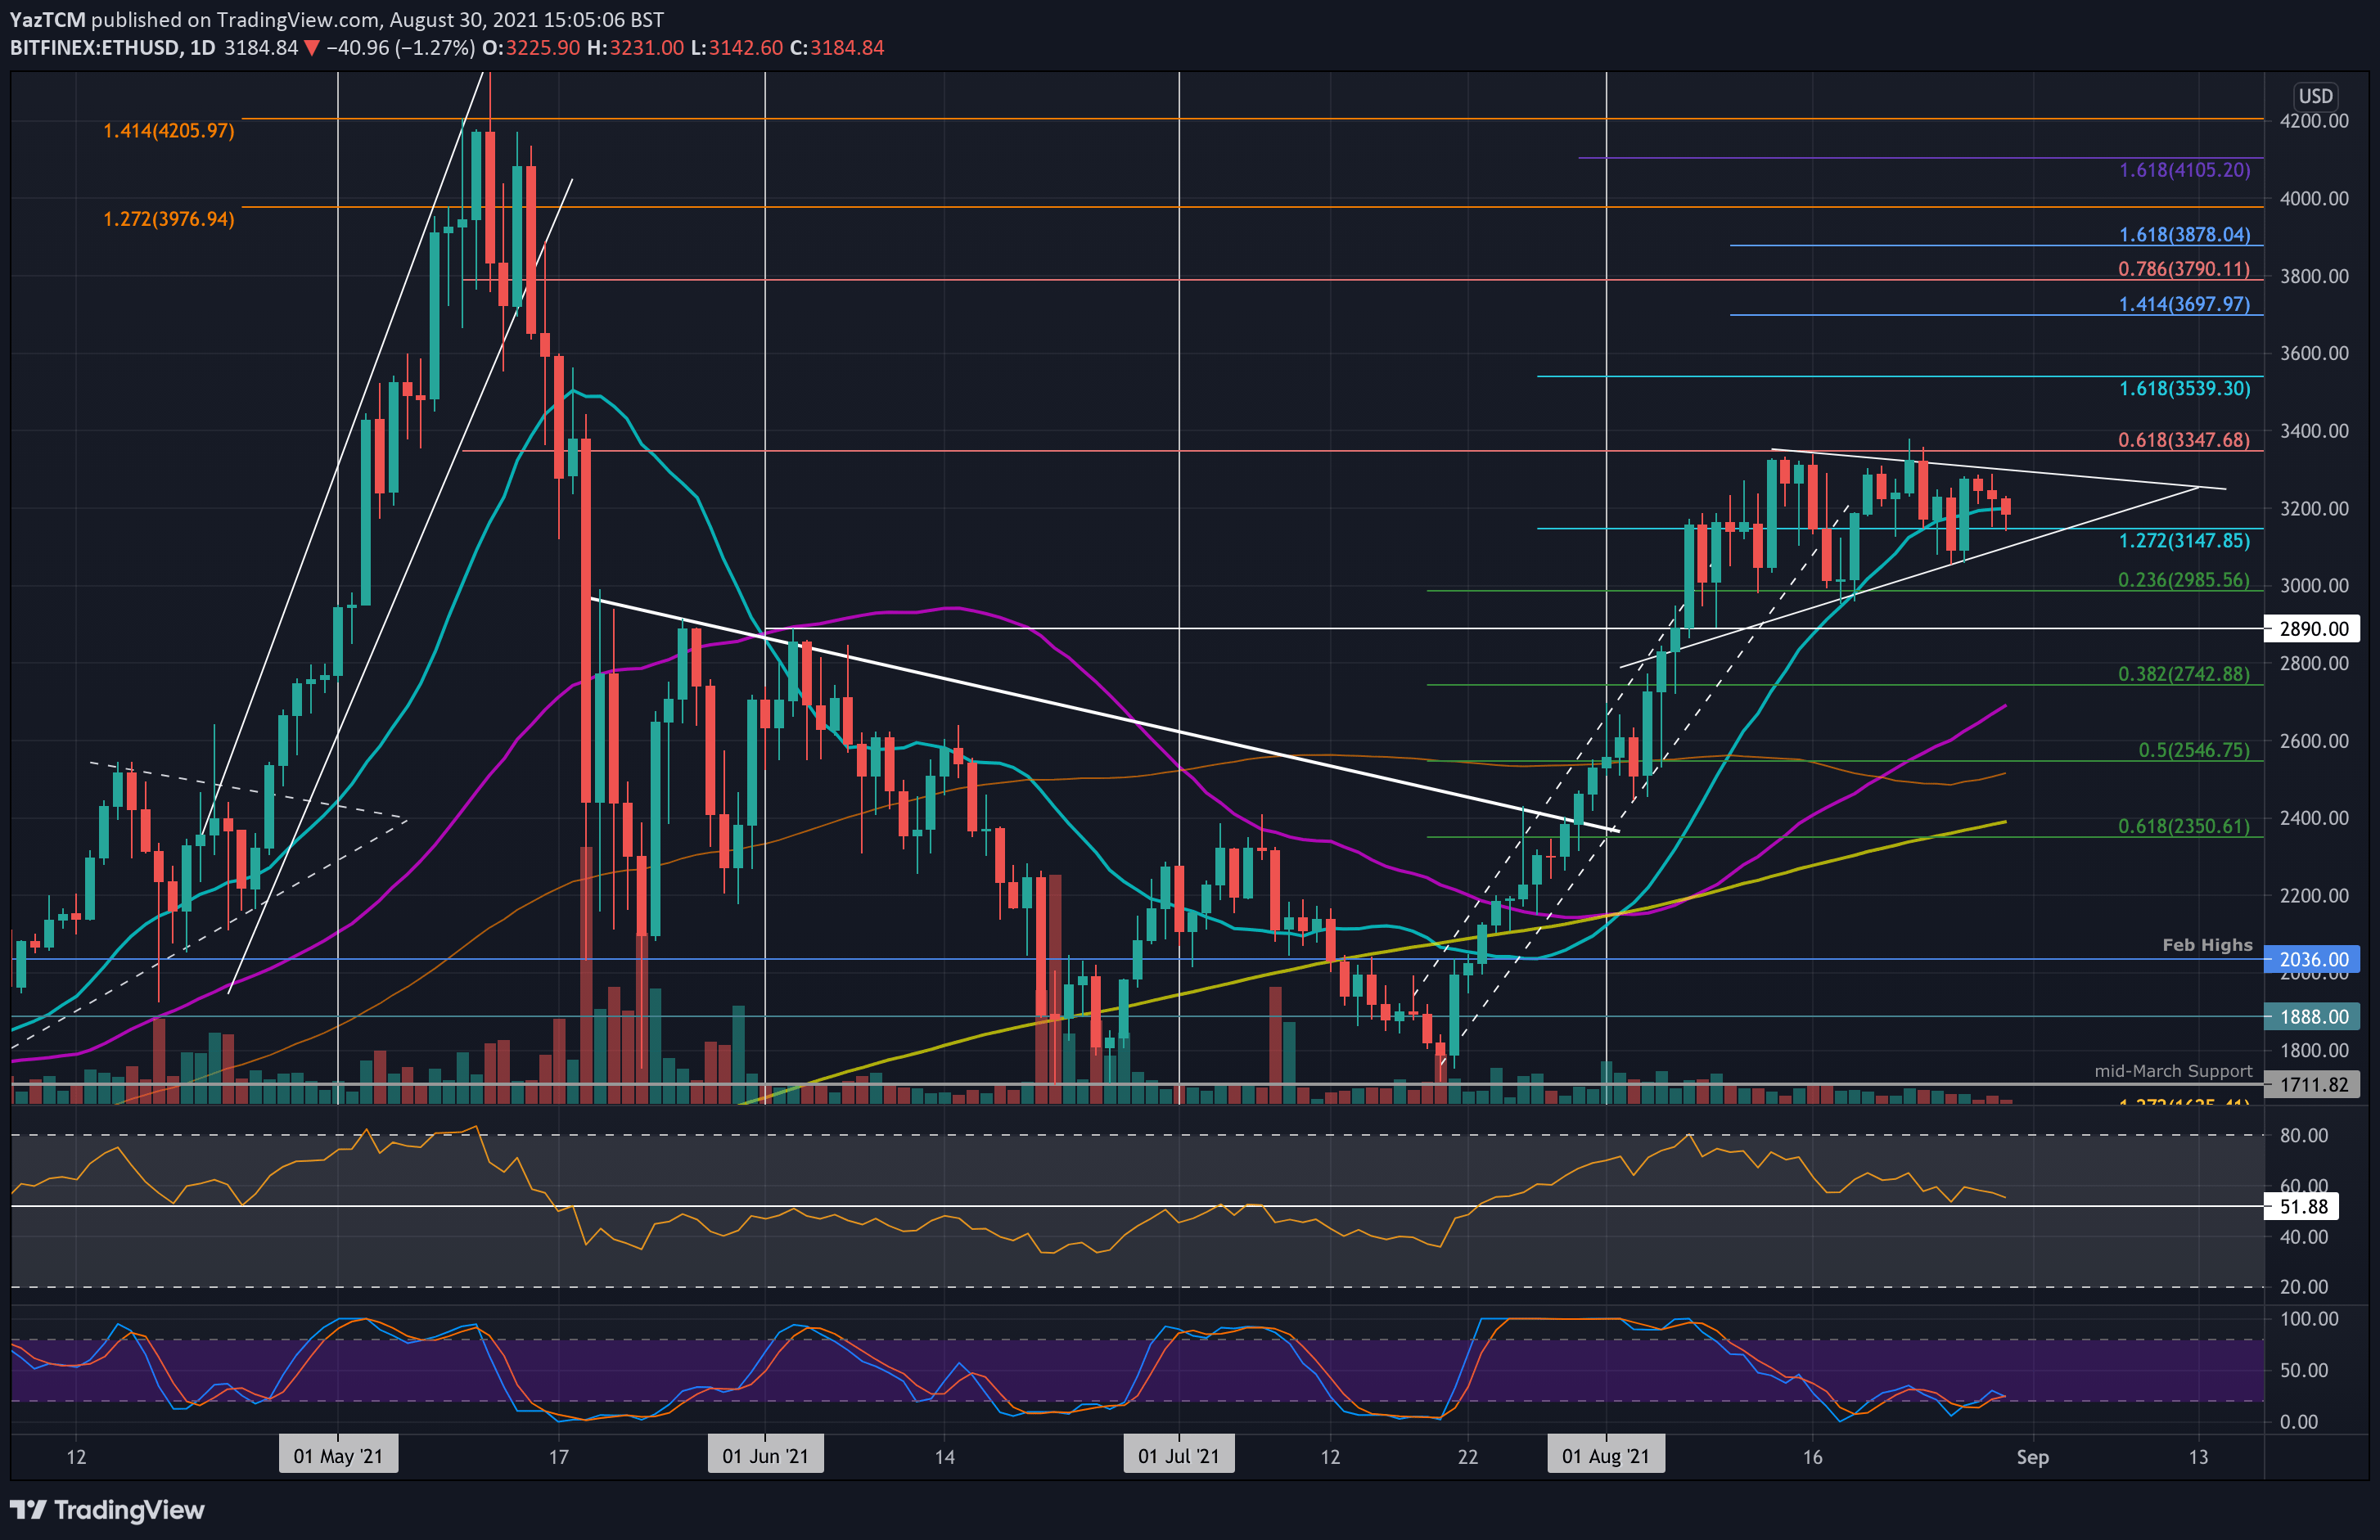
ETH-USD Short Term Price Prediction
Looking ahead, the first support lies at $3150 (lower angle of the triangle). This is followed by support at $2985 (.236 Fib), $2890, $2740 (.382 Fib), and $2545 (.5 Fib).
On the other side, the first resistance lies at the upper angle of the triangle. This is closely followed by the resistance at $3350 (bearish .618 Fib). Above this, added resistance lies at $3540 (1.618 Fib Extension) and $3700.
The RSI is making lower lows and is showing hints of bearish divergence, indicating a retracement could be imminent.
ETH/BTC – ETH Attempts To Break Descending Price Channel
Key Support Levels: 0.066 BTC, 0.0651 BTC, 0.0632 BTC.
Key Resistance Levels: 0.0673 BTC, 0.0691 BTC, 0.07 BTC.
ETH has been trading inside a descending price channel since failing to break the resistance at 0.07 BTC toward the middle of August. The coin found solid support at the 100-day MA and the 0.05 Fib at 0.065 BTC last week and has since rebounded.
Over the past five days, ETH managed to hold above 0.066 BTC and is now attempting to break the upper angle of the price channel today.
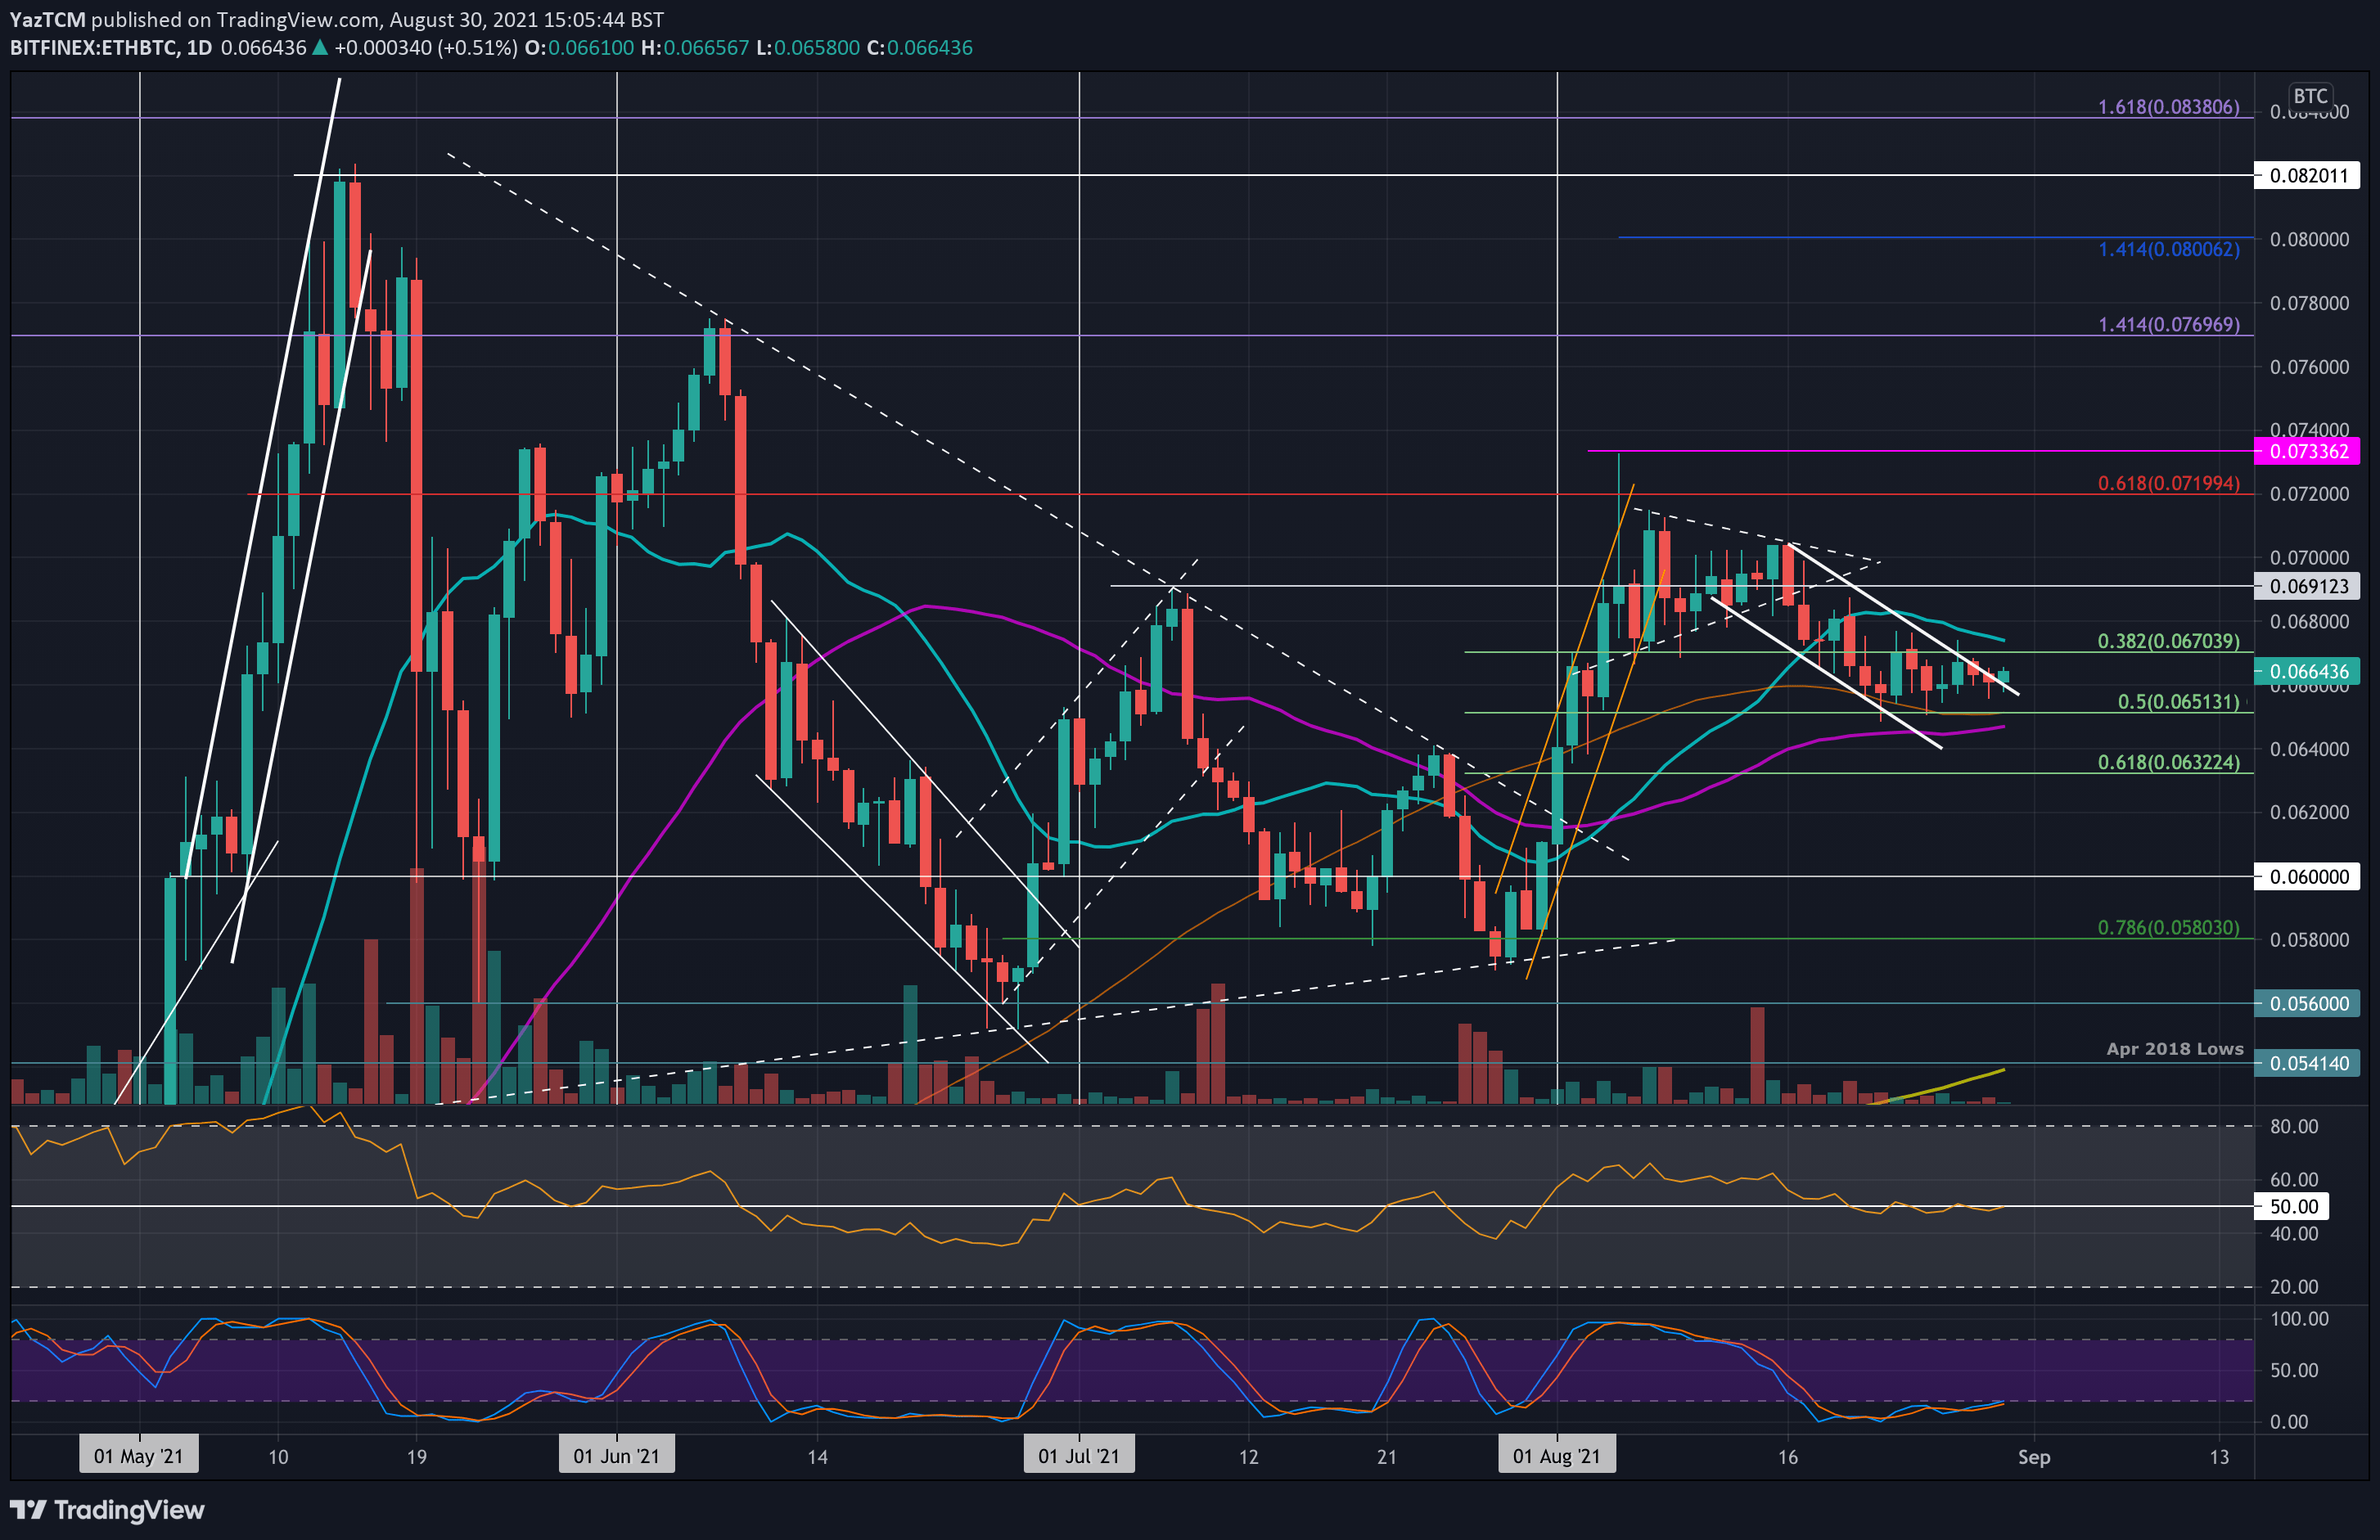
ETH-BTC Short Term Price Prediction
Moving forward, the first resistance lies at 0.0673 BTC (20-day MA). This is followed by 0.0691 BTC, 0.07 BTC, 0.072 BTC (bearish .618 Fib), and 0.0733 BTC (August high).
On the other side, the first support lies at 0.066 BTC. This is followed by 0.0651 BTC (.5 Fib & 100-day MA), 0.0632 BTC (.618 Fib), and 0.062 BTC.
The RSI is now trading along the midline, indicating that there is indecision within the market. To continue higher above the price channel, the RSI must rise beyond the midline to indicate increased bullish momentum.