Bitcoin (BTC) Bitcoin is up a small 1% this week after getting rejected trying to breach above the ,000 mark on Monday. The current high since May now lies at ,500. Unfortunately, BTC was unable to sustain this level and ended up closing the daily candle beneath K. Following the rejection, BTC headed sharply lower: Yesterday it fell back beneath ,800, recording its weekly low amid .3k, however, the bitcoin price managed to close the day on top of the crucial 20-day MA (~.9k) – the first bullish sign for a possible reversal. Today, BTC bounced from the support at the lower angle of the wedge and is attempting to push higher as of writing these lines. The cryptocurrency is now trading inside an ascending wedge formation, whereas the 3-month high resistance
Topics:
Yaz Sheikh considers the following as important: ADABTC, ADAUSD, Bitcoin (BTC) Price, BTC Analysis, BTCEUR, BTCGBP, btcusd, btcusdt, Cardano (ADA) Price, ETH Analysis, ETHBTC, Ethereum (ETH) Price, ethusd, Price Analysis, Ripple (XRP) Price, Solana (SOL) Price, SOLBTC, SOLUSD, XRP Analysis, xrpbtc, xrpusd
This could be interesting, too:
Chayanika Deka writes XRP, SOL, and ADA Inclusion in US Crypto Reserve Pushes Traders on Edge
Chayanika Deka writes Why Arthur Hayes Is Bullish on Bitcoin Under Trump’s Economic Strategy
Mandy Williams writes Why the Bitcoin Market Is Stuck—and the Key Metric That Could Change It: CryptoQuant CEO
Wayne Jones writes Metaplanet Acquires 156 BTC, Bringing Total Holdings to 2,391
Bitcoin (BTC)
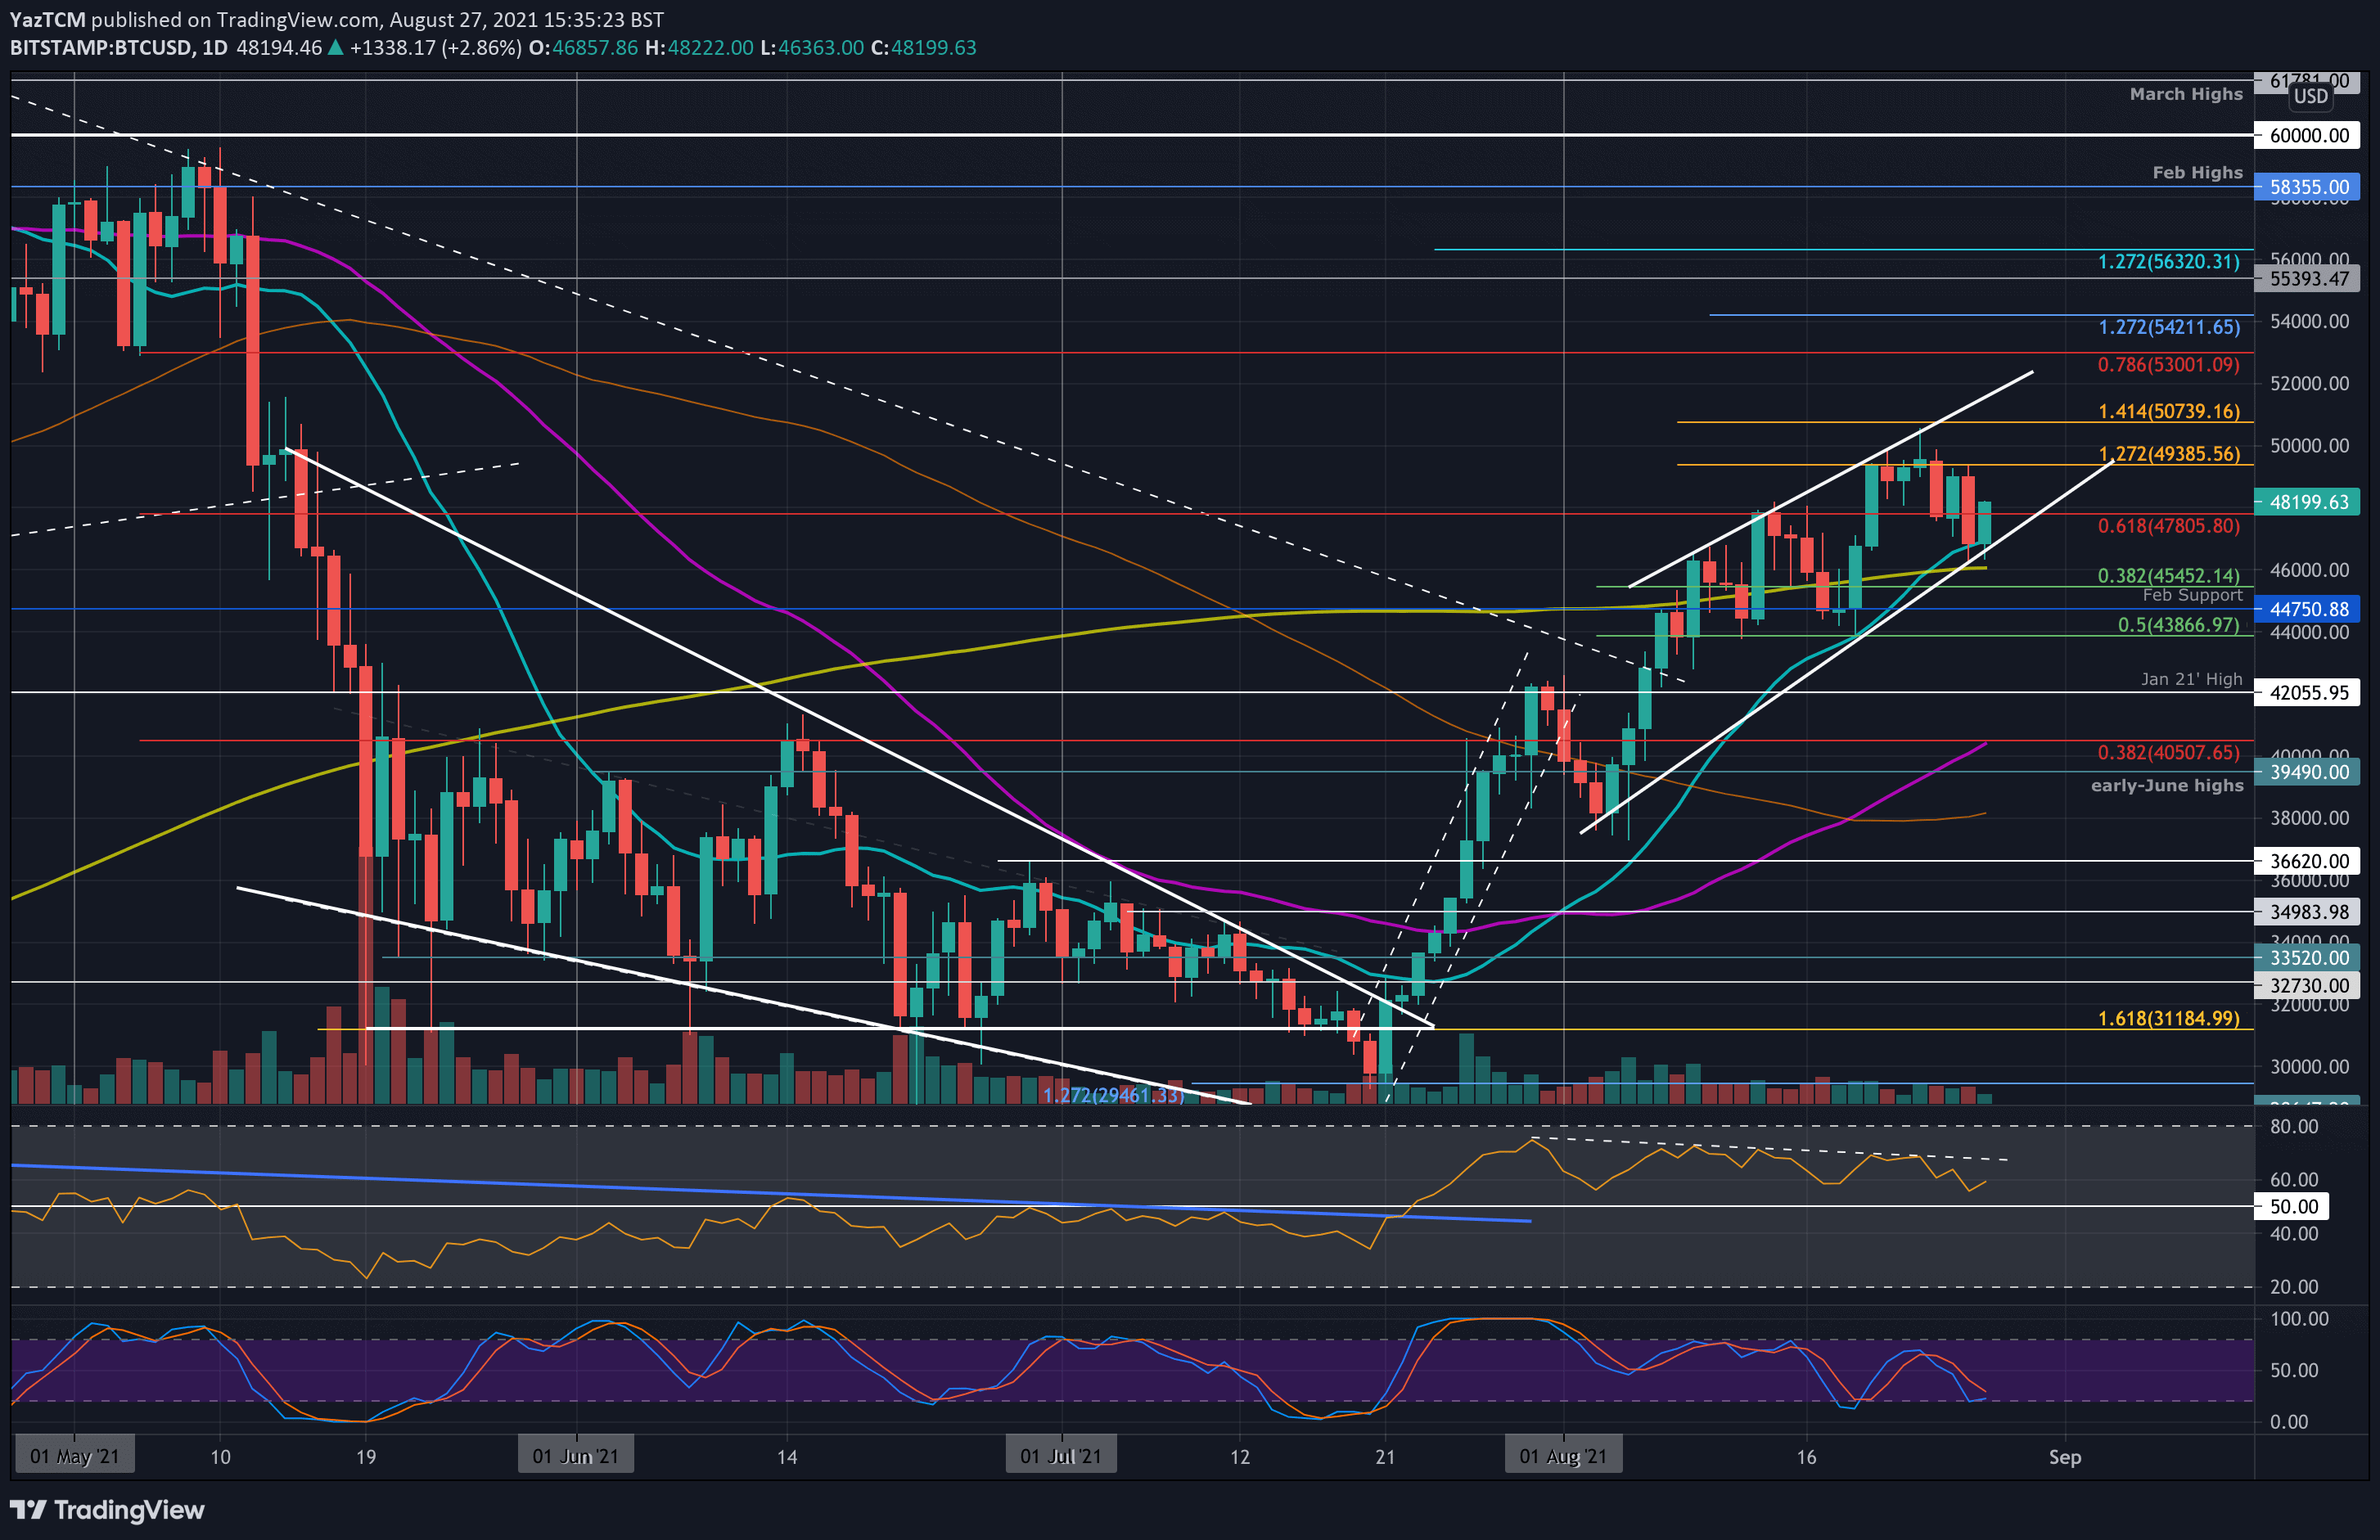
Bitcoin is up a small 1% this week after getting rejected trying to breach above the $50,000 mark on Monday. The current high since May now lies at $50,500. Unfortunately, BTC was unable to sustain this level and ended up closing the daily candle beneath $50K.
Following the rejection, BTC headed sharply lower: Yesterday it fell back beneath $47,800, recording its weekly low amid $46.3k, however, the bitcoin price managed to close the day on top of the crucial 20-day MA (~$46.9k) – the first bullish sign for a possible reversal.
Today, BTC bounced from the support at the lower angle of the wedge and is attempting to push higher as of writing these lines. The cryptocurrency is now trading inside an ascending wedge formation, whereas the 3-month high resistance at $50,500 was provided by the upper angle of the wedge.
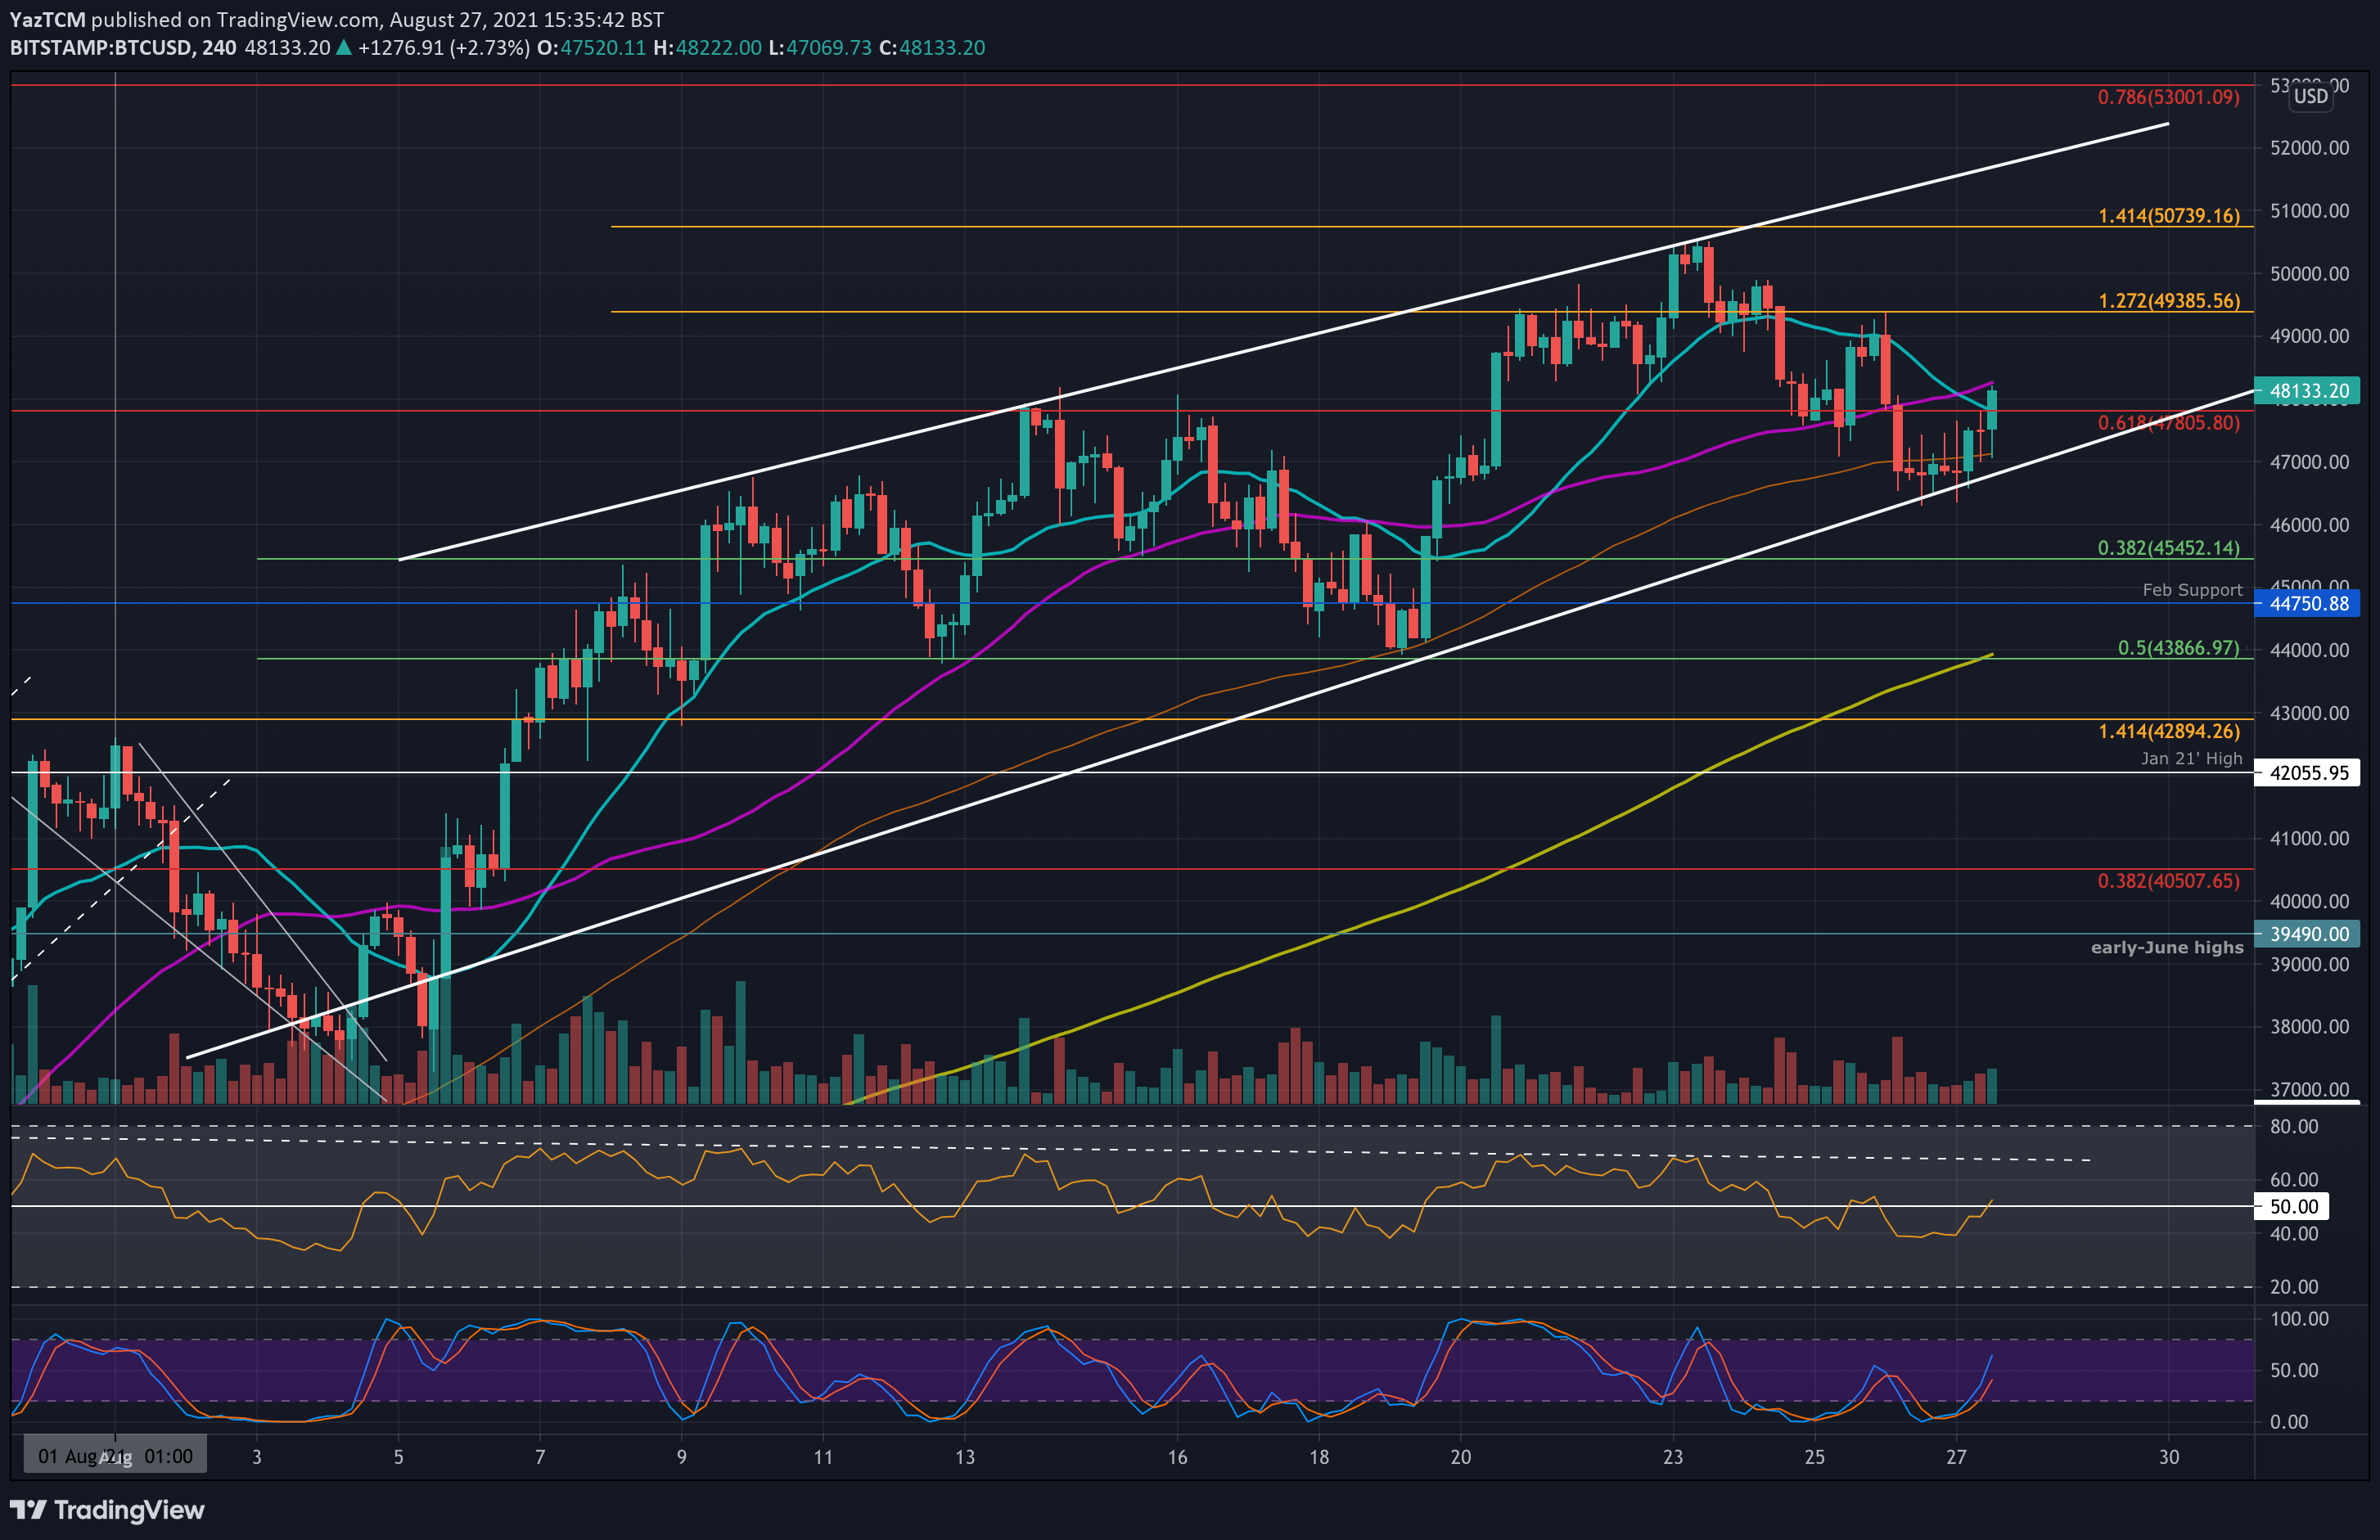
The 4-hour chart gives a clearer perspective of how the wedge pattern is currently being played out.
Looking ahead, the first critical level lies around $47,800 (bearish .618 Fib). This is followed by $49,400 (1.272 Fib Extension), $50,000, $50,740 (1.414 Fib Extension & upper angle of the wedge), and $52,000. Further resistance lies at $53,000 (bearish .786 Fib), and $54,210 (1.272 Fib Extension).
On the other side, the first support lies at the lower angle of the wedge. This is followed by $46,000 (200-day ma and this week’s low), $45,450 (.382 Fib), $44,750 (Feb 2021 support), and $43,870 (.5 Fib).
Ethereum (ETH)
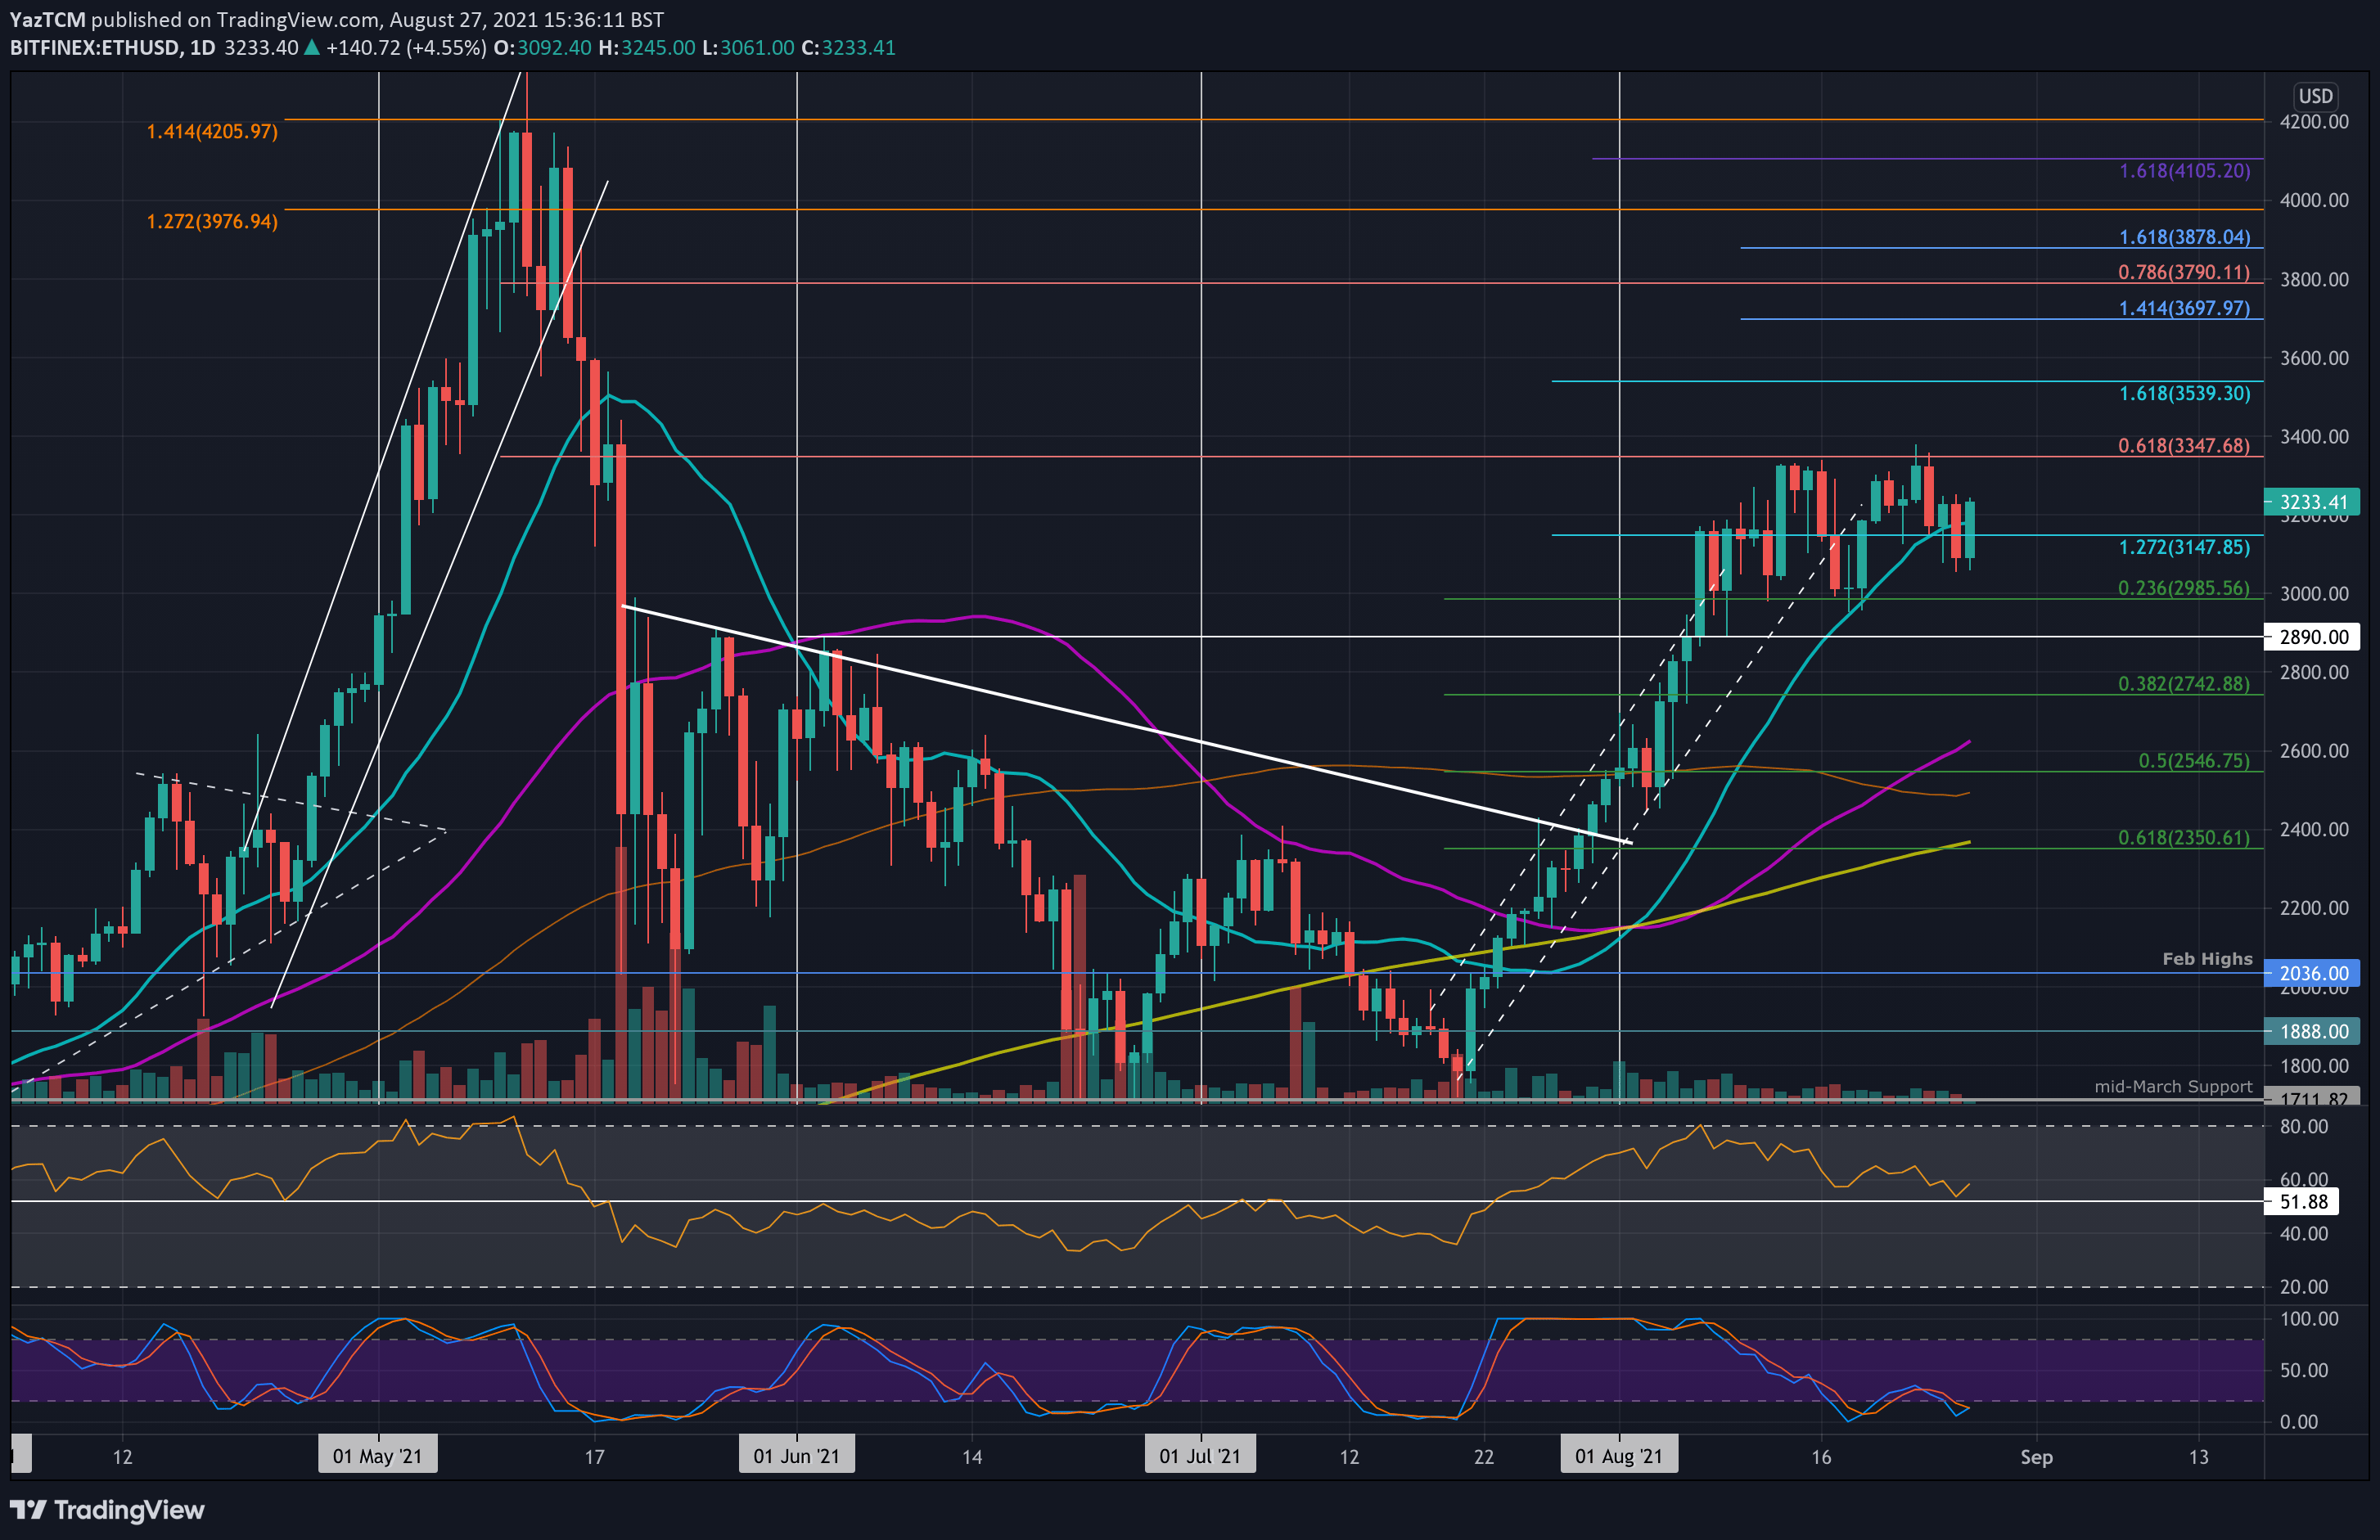
Ethereum saw a sluggish week, but after all, ETH is up 1% on the weekly – just as BTC. The second-largest coin bounced from support at $3,000 last Thursday and pushed higher at the start of this week to meet the resistance at $3350 (bearish .618 Fib).
ETH could not overcome this resistance and started to decline after BTC got rejected by the $50k mark. Initially, Ether was holding the support at the 20-day MA at $3180 but eventually dropped beneath this key level yesterday to reach a closing price of $3056.
Together with the sentiment, ETH has since bounced from this support and is now trading above $3200.
Looking ahead, the first major resistance lies at $3350 (bearish .618 Fib). This is followed by $3540 (1.618 Fib Extension), $3600, $3700 (1.414 Fib Extnesion – blue), $3790 (Bearish .786 Fib), and $3880 (1.618 Fib Extension – blue).
On the other side, the first support lies at $3180 (20-day MA). This is followed by $3060, $3000 (.236 Fib), $2890, and $2740 (.382 Fib).
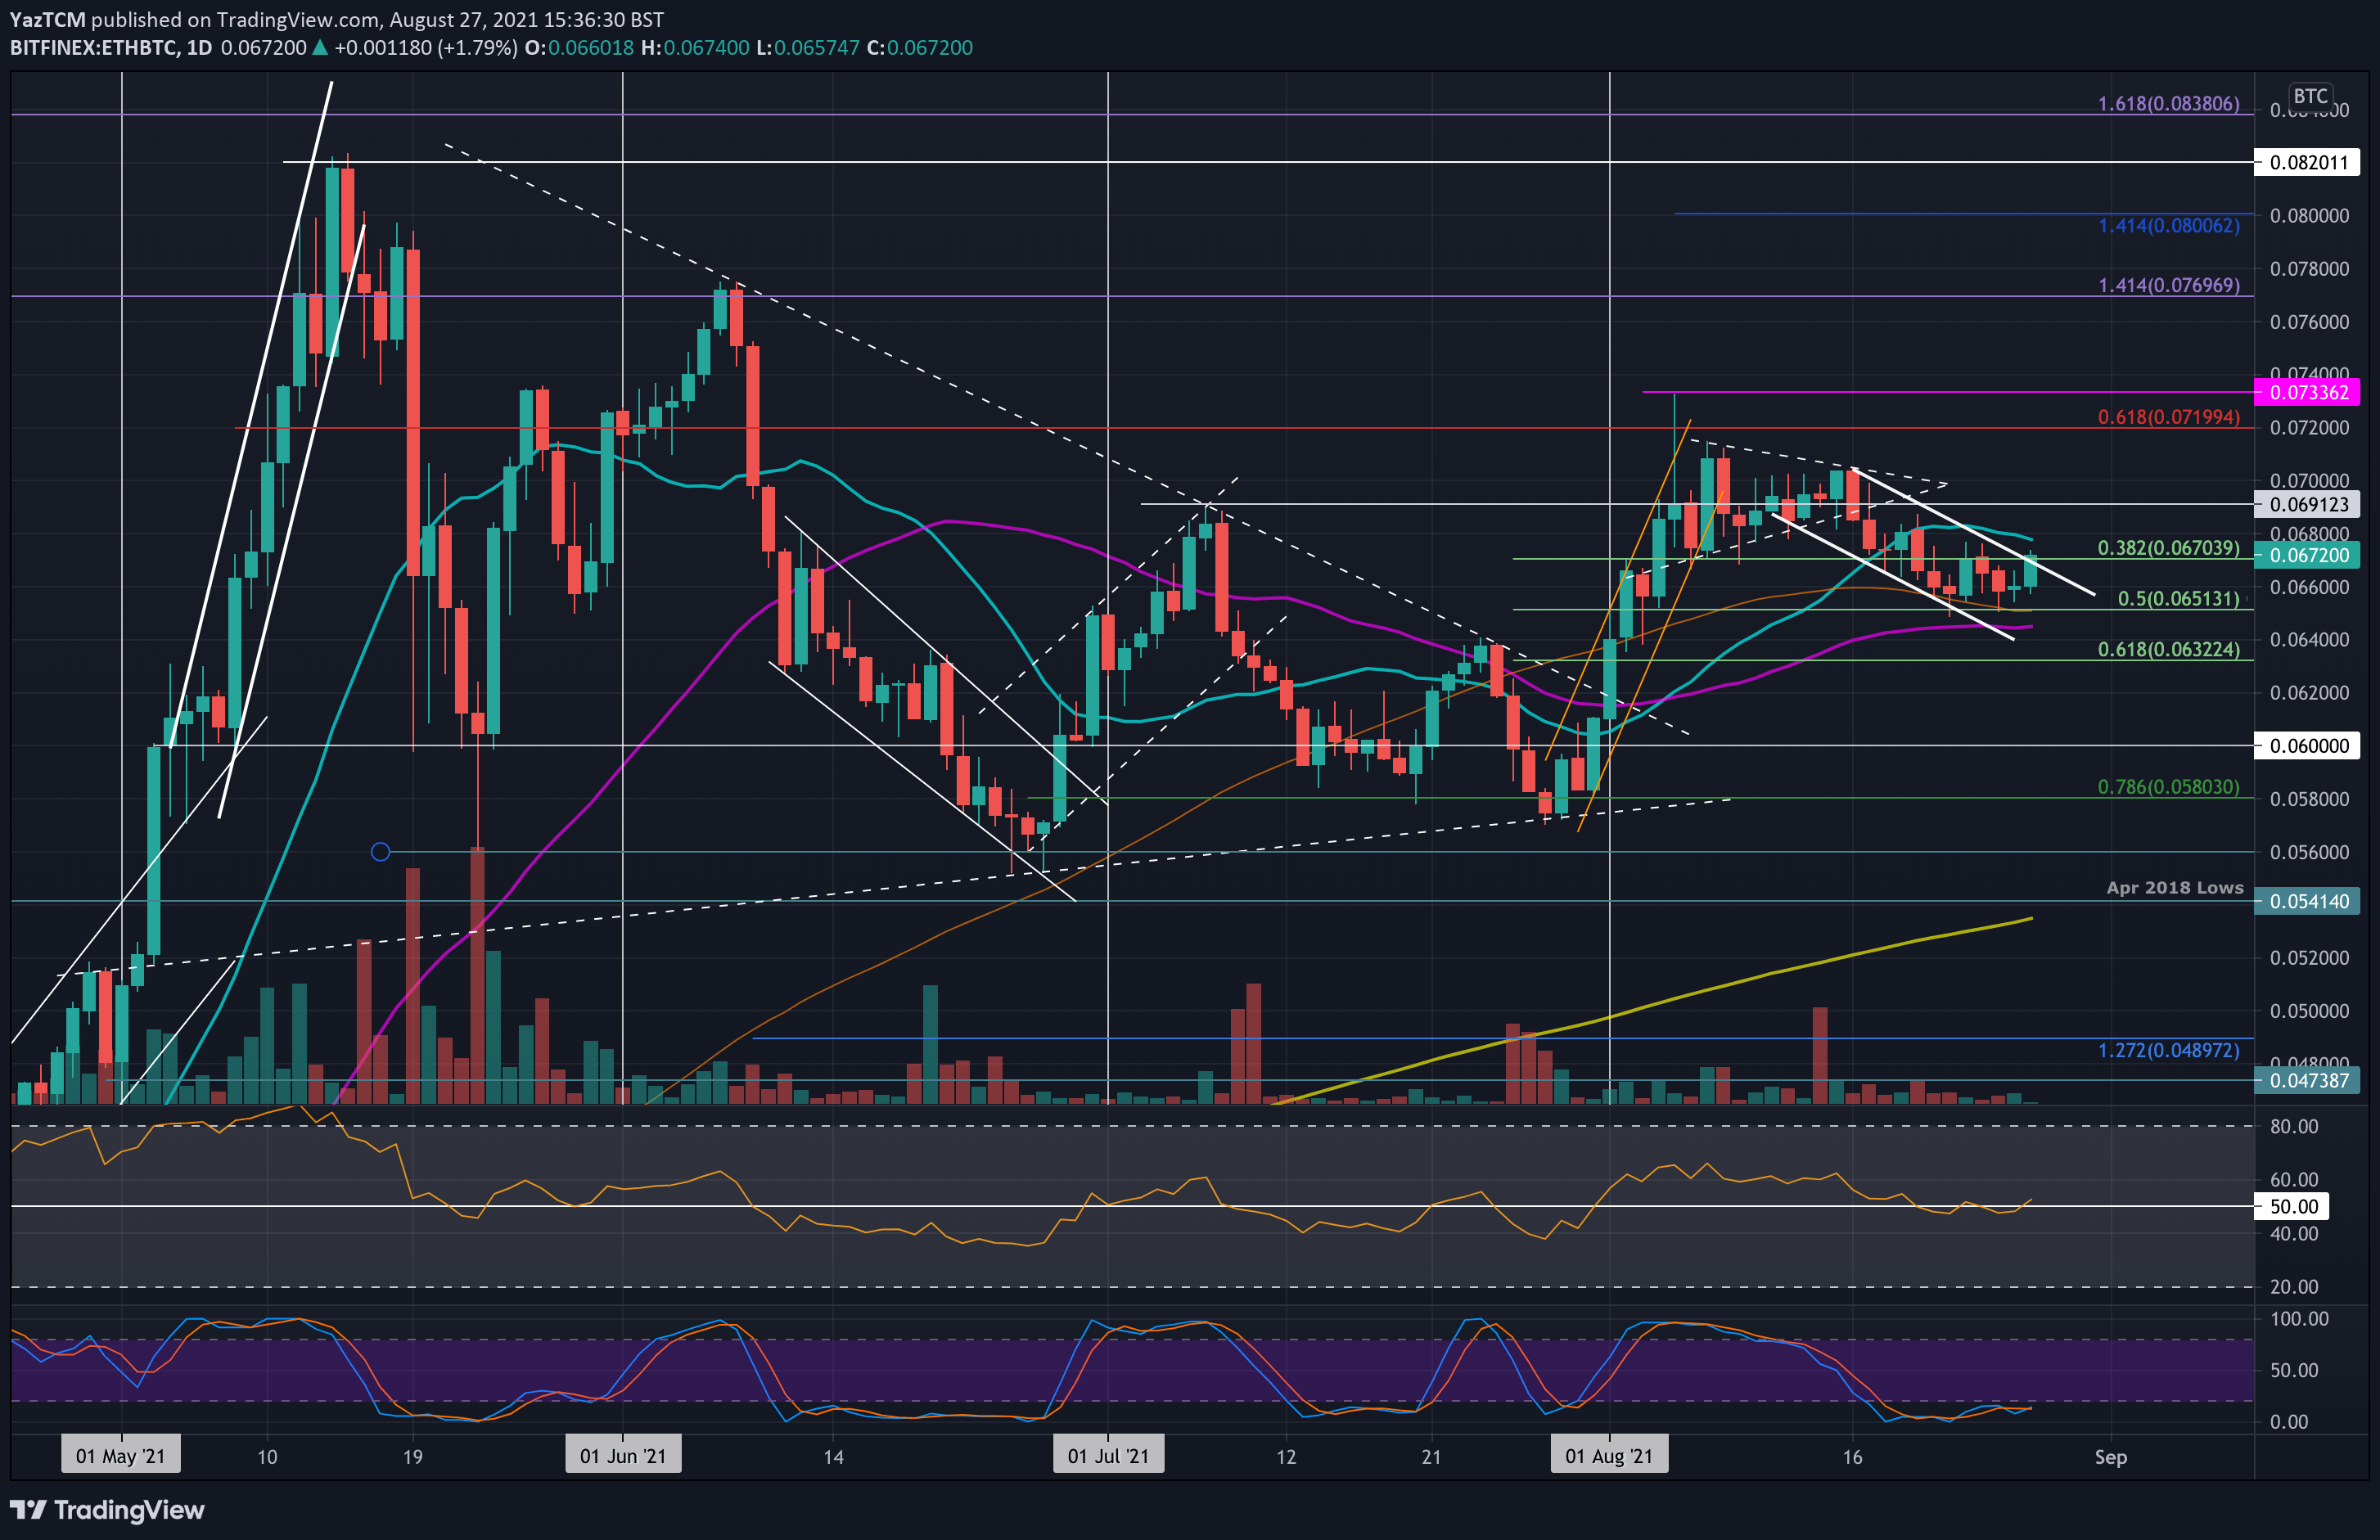
Against Bitcoin, ETH/BTC is trading inside a descending price channel. The price channel was formed when ETH fell beneath a symmetrical triangle pattern earlier in the month, and immediately caused ETH to drop as low as 0.0651 BTC (.5 Fib & 100-day MA) during the past week.
Today, ETH rebounded from support at 0.066 BTC and is now attempting to close above the price channel, as recovery continues.
Looking ahead, the first resistance lies at 0.068 BTC (20-day MA). This is followed by 0.0691 BTC (July high), 0.072 BTC (bearish .618 Fib), and 0.0736 BTC. Added resistance lies at 0.077 BTC (1.414 Fib Extension).
On the other side, the first support lies at 0.066 BTC. This is followed by 0.0651 BTC (.5 Fib & 100-day MA), 0.064 BTC, 0.0632 BTC (.618 Fib), and 0.062 BTC.
Ripple (XRP)
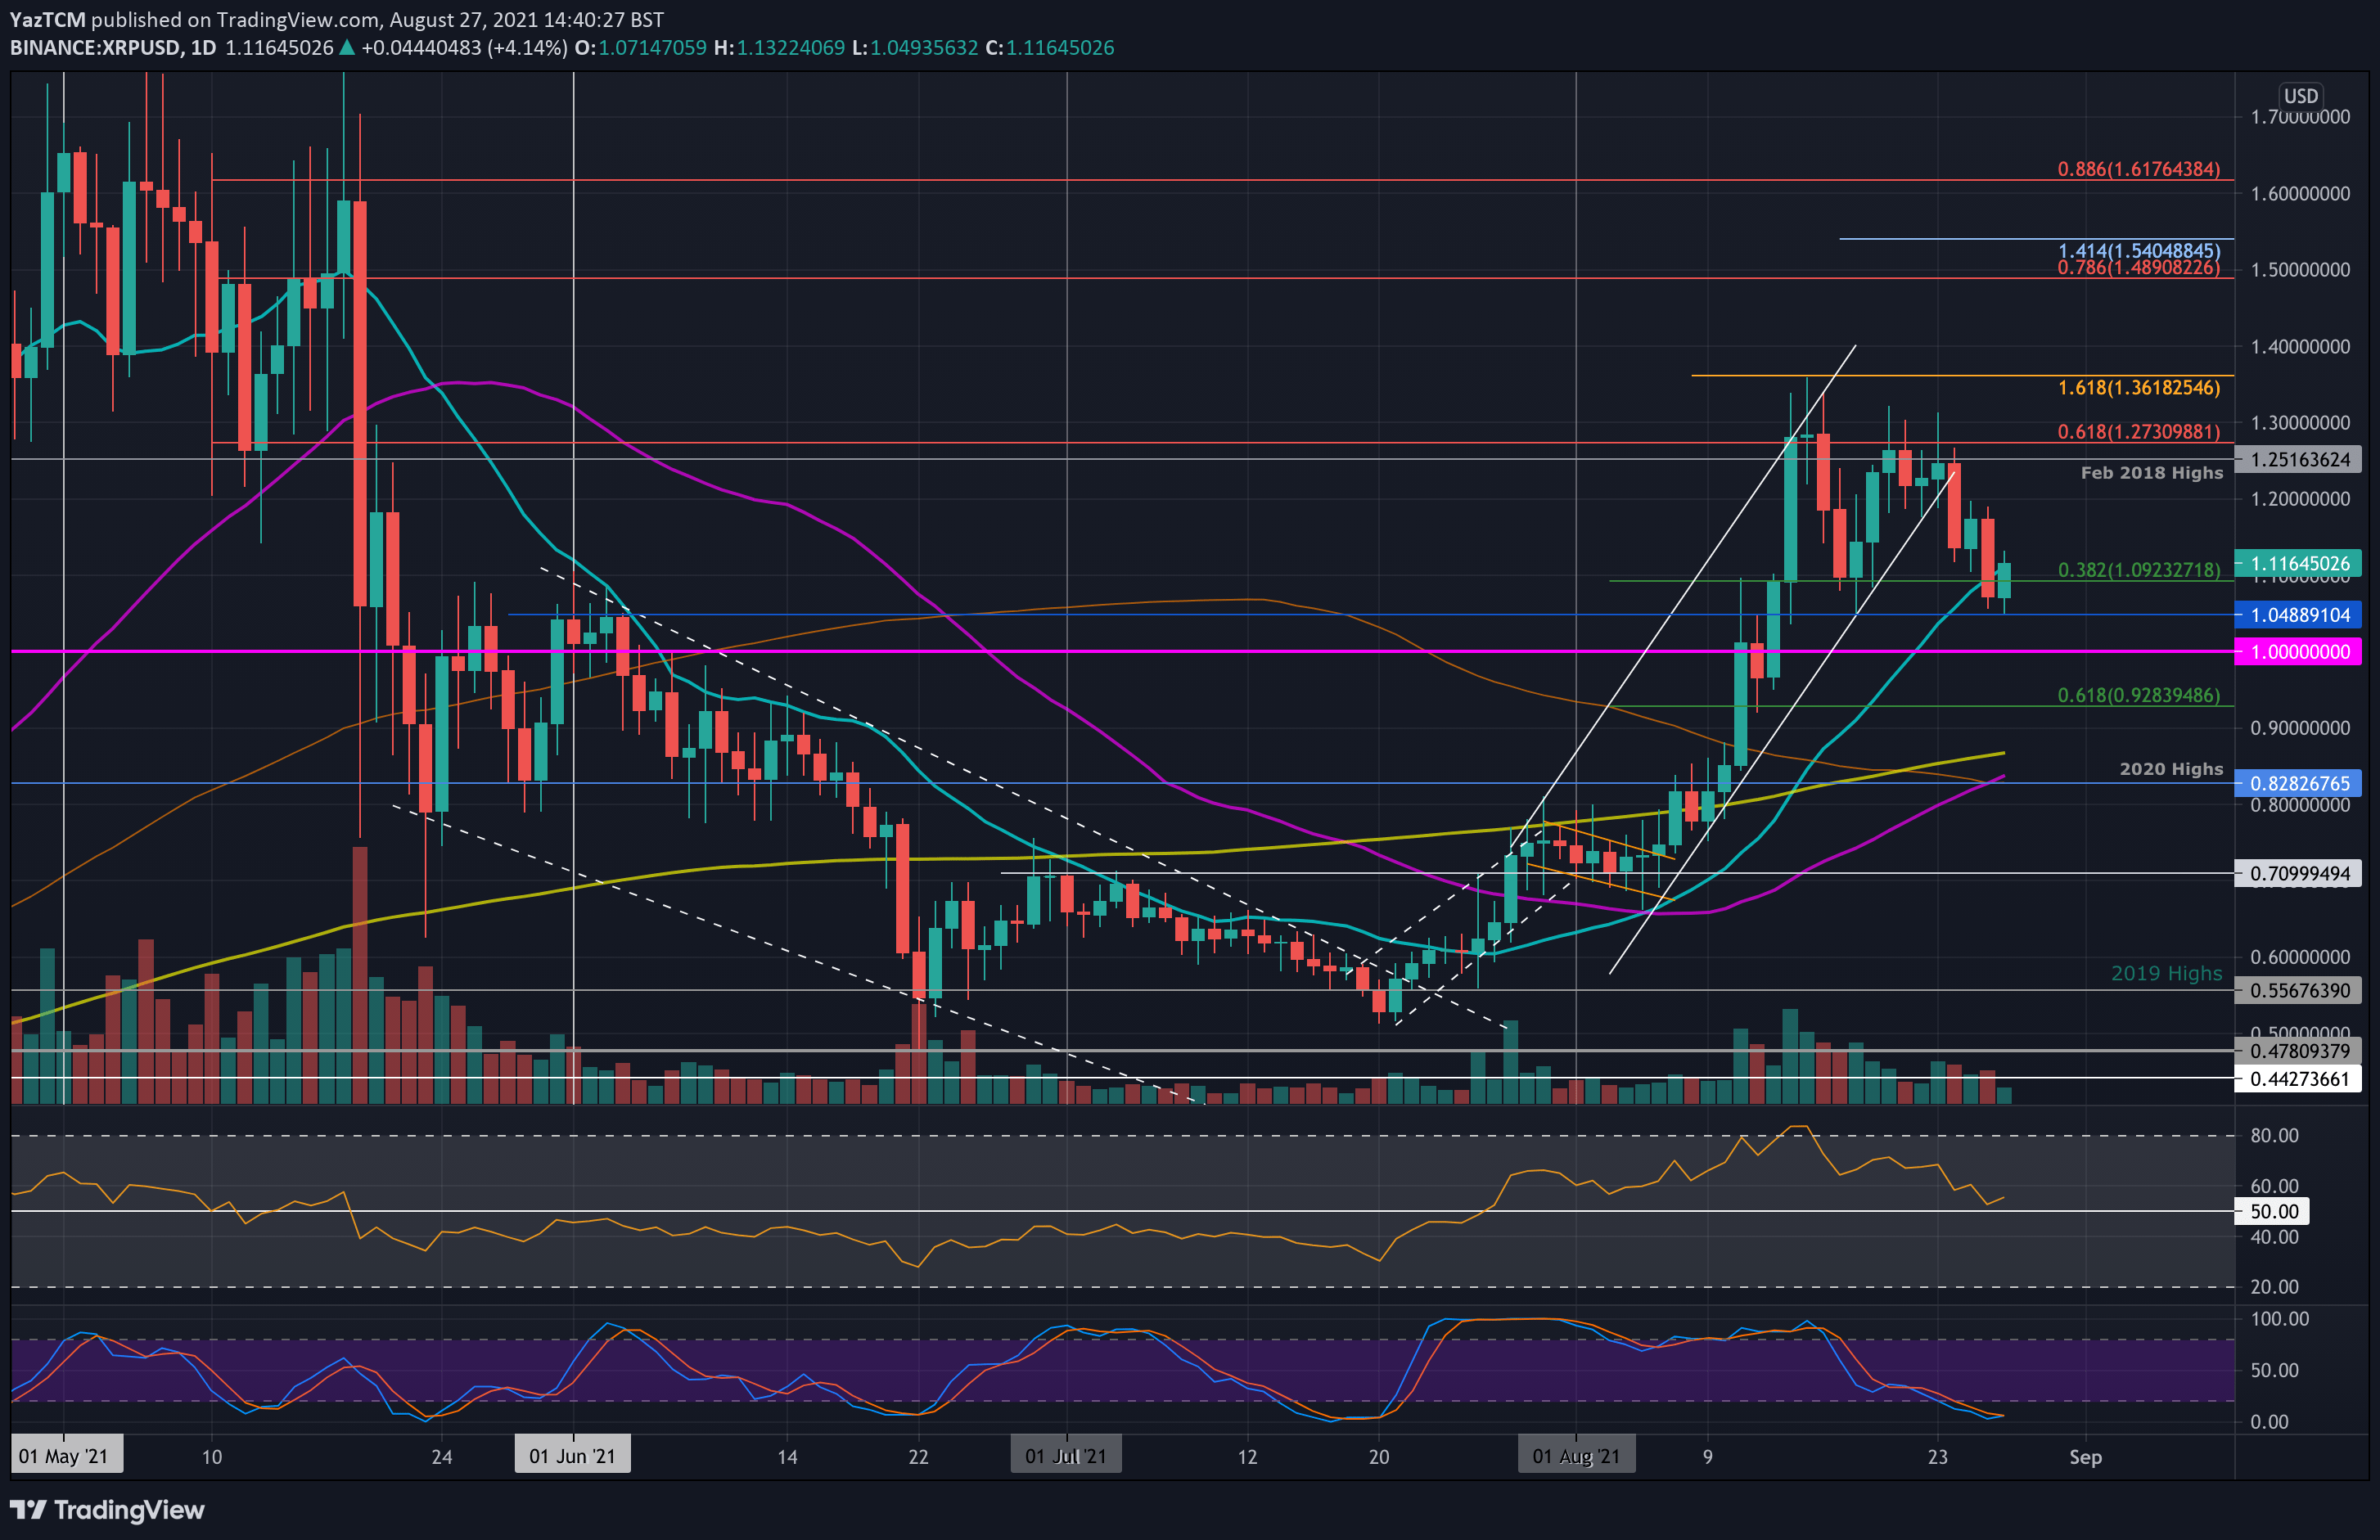
XRP had surged into resistance at $1.27 (bearish .618 Fib) last Friday and was unable to overcome the level. After another attempt to break $1.27 on Monday, XRP started to head lower throughout the week.
Yesterday, it fell beneath the 20-day MA and continued to spike as low as $1.05 today. However, XRP had since rebounded slightly as it sits above the 20-day MA at $1.10. So far on the weekly, XRP is down by 6%, according to CoinGecko.
Looking ahead, the first strong resistance lies at $1.20. This is followed by the resistance between $1.25 (Feb 2018 high) – $1.27 (bearish .618 Fib). Beyond $1.30, additional resistance lies at $1.36 (1.618 Fib Extension & August high), $1.40, and $1.50 (bearish .786 Fib).
On the other side, the first support lies at $1.10 (20-dau MA & .382 Fib). This is followed by $1.05 (weekly low), $1.00, and $0.928 (.618 Fib).
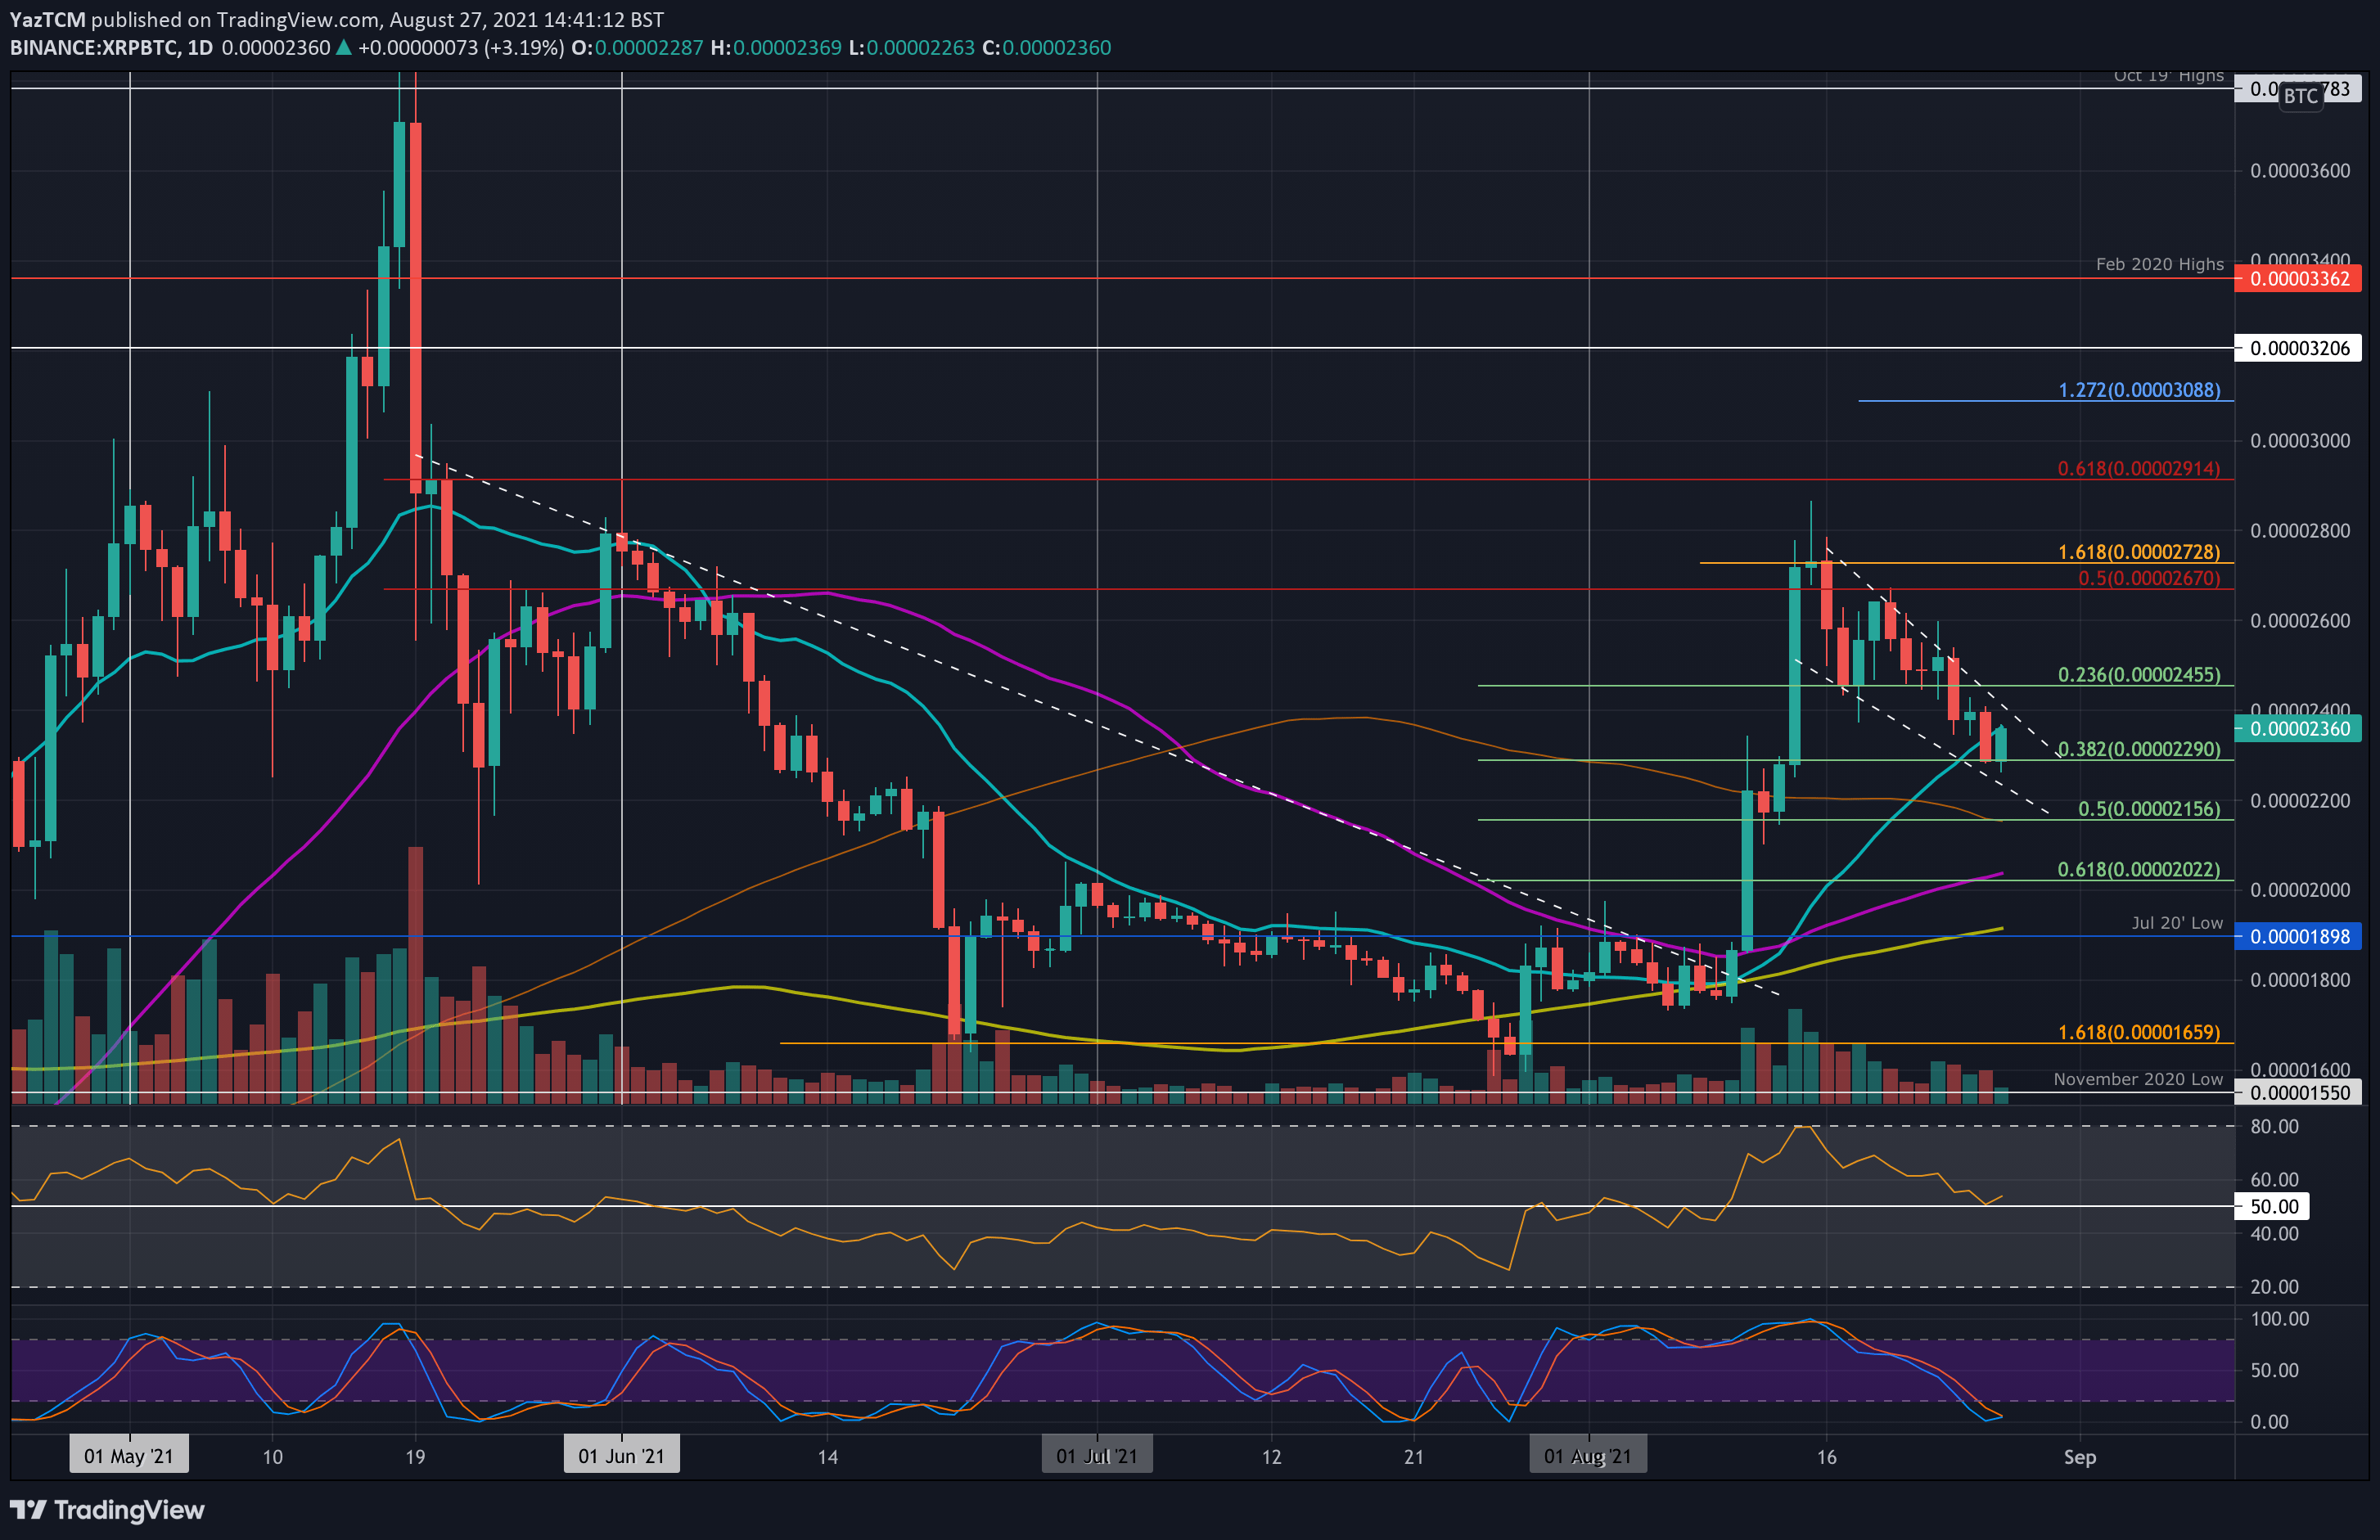
XRP also lost momentum against BTC, as it trades inside a descending wedge formation. The coin met resistance at 2670 SAT (bearish .5 Fib) last Friday and started to head lower from there. Initially, it found support at 2455 SAT (.236 Fib) but fell beneath there on Tuesday.
XRP/BTC continued lower as it broke beneath the 20-day MA yesterday, to hit the support at 2290 SAT (.382 Fib). But just like the USD pair, XRP/BTC had since bounced nicely from there to return to the 20-day MA price area.
Looking ahead, the first resistance lies at 2455 SAT. This is followed by 2670 SAT (bearish .5 Fib), 2800 SAT, and 2915 SAT (bearish .618 Fib).
On the other side, the first support lies at 2290 SAT (.382 Fib). This is followed by 2150 SAT (.5 Fib & 100-day MA) ,2000 SAT (.618 Fib & 50-day MA), and 1900 SAT (200-day MA).
Cardano (ADA)
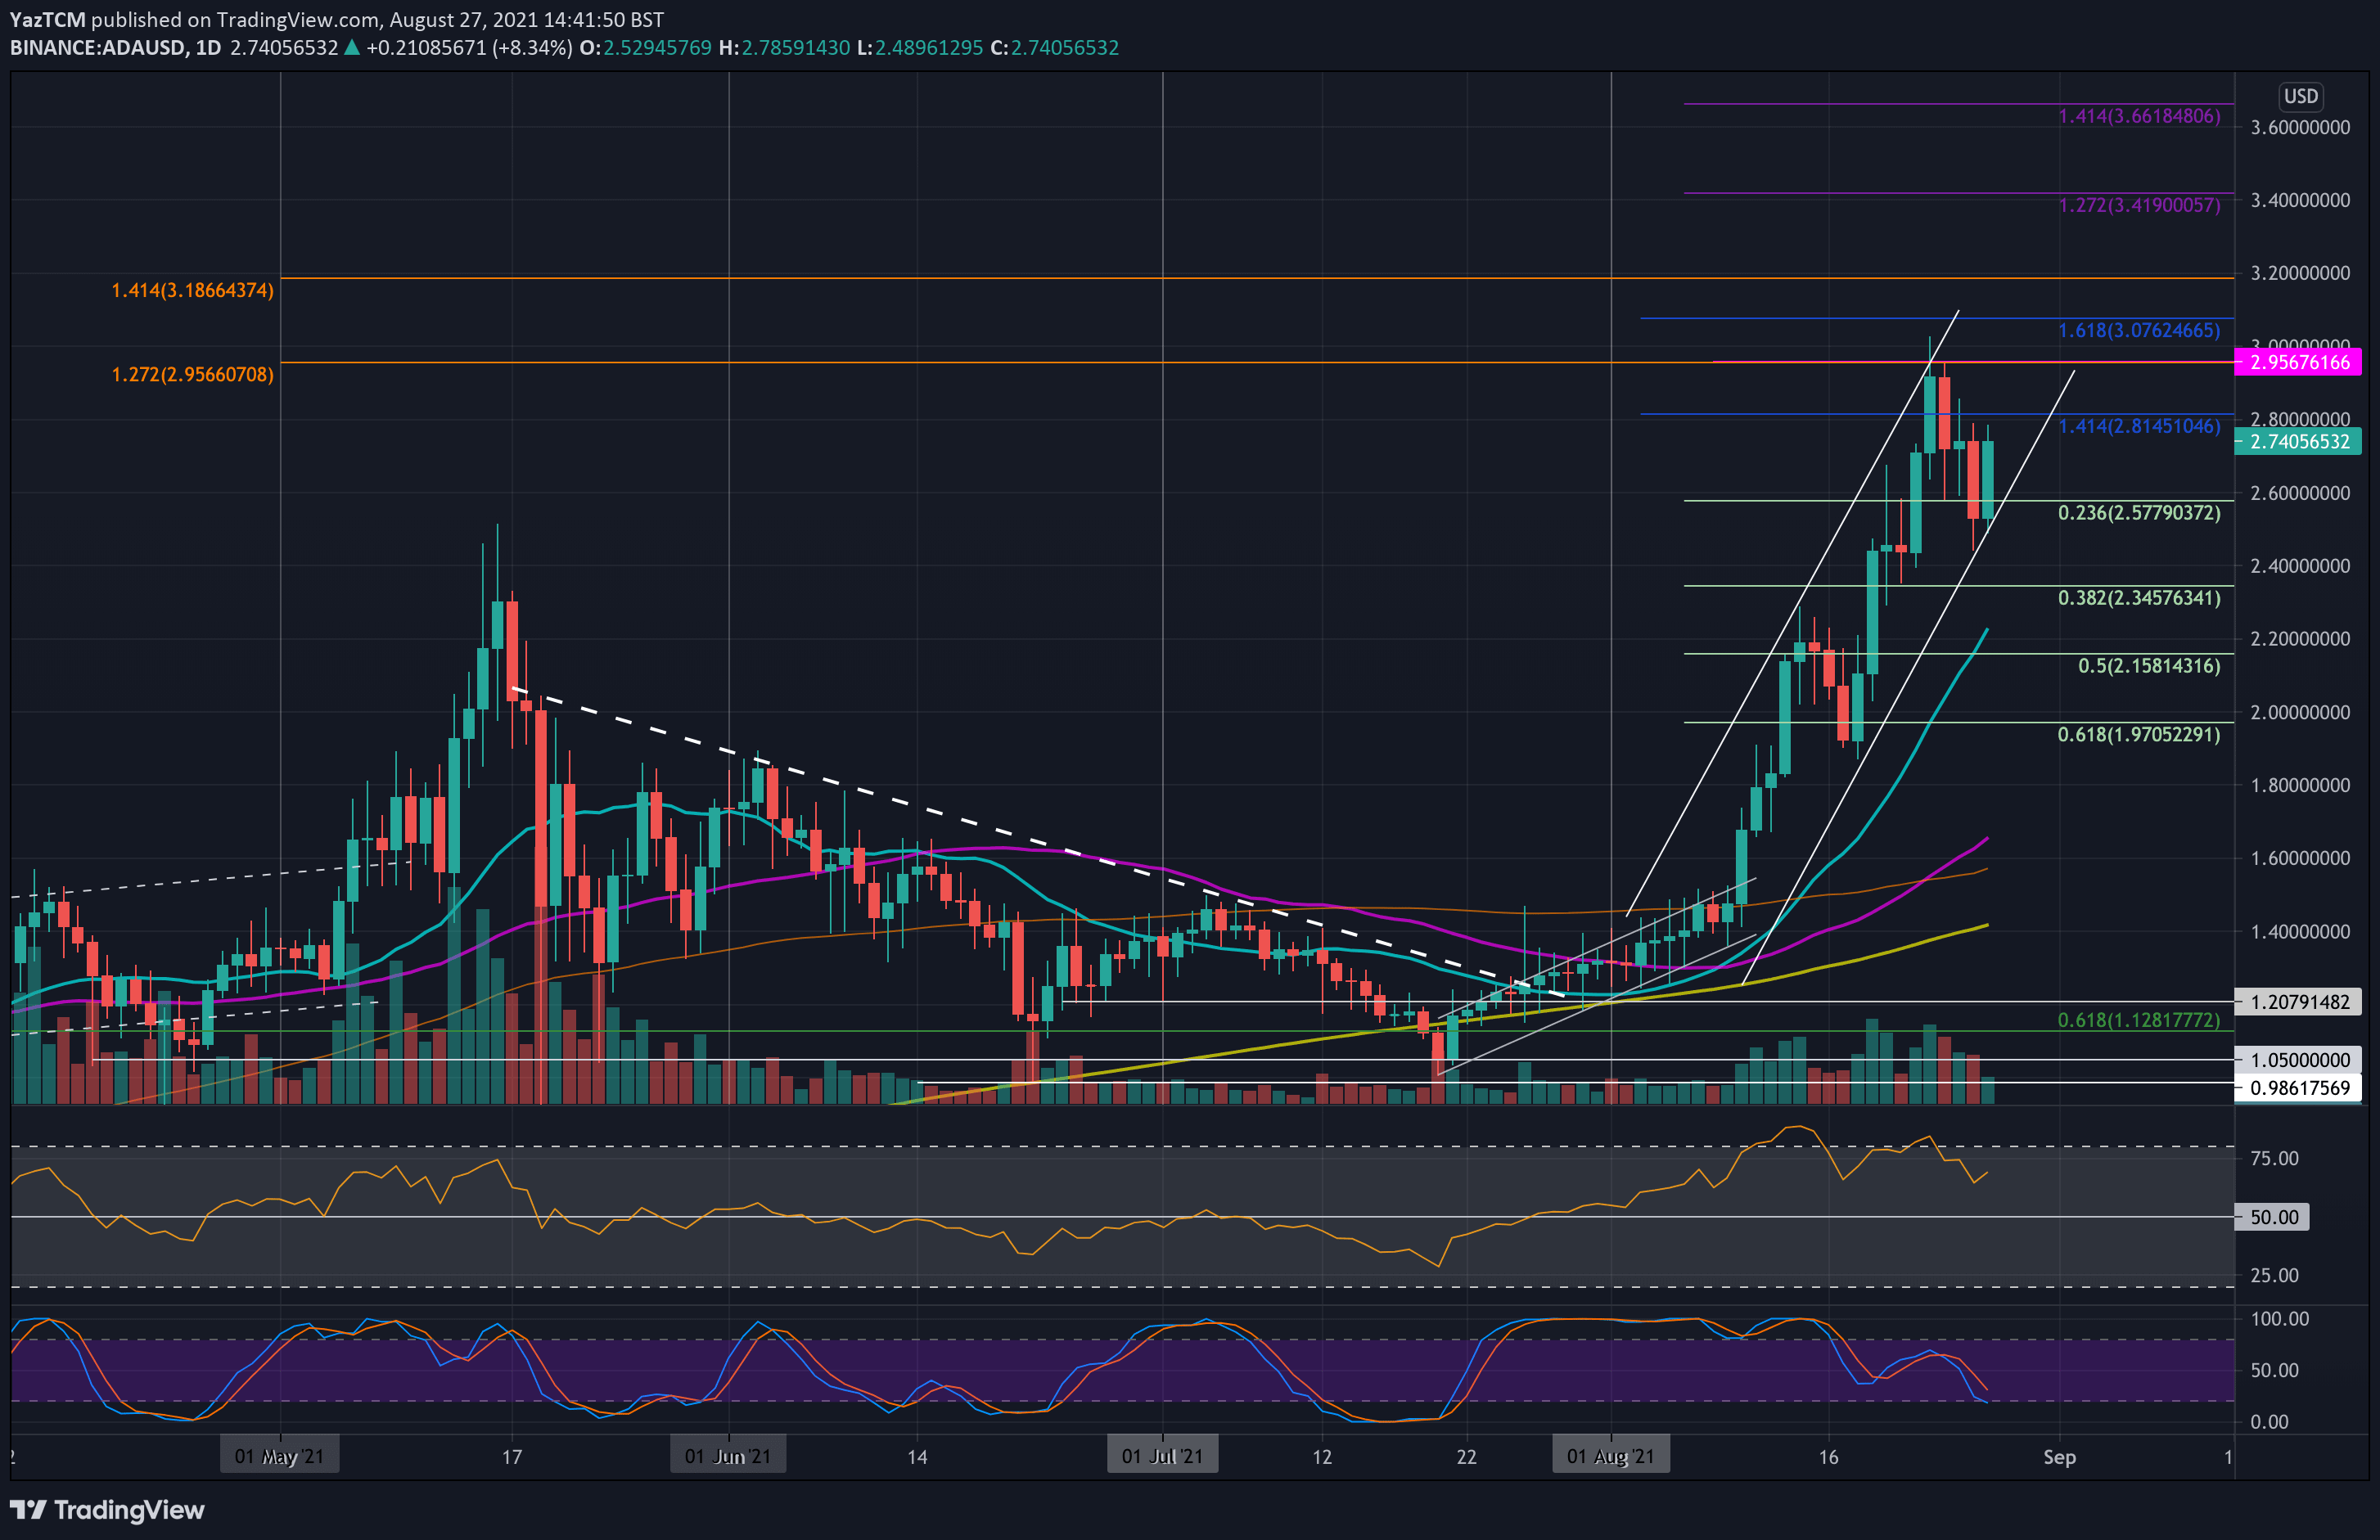
Cardano saw an extraordinary week in which it managed to surge by 20% and break its all-time high ($2.95). The cryptocurrency has been trading inside a steep ascending price channel throughout August and recently met the support at the lower angle of the price channel.
Earlier in the week, ADA managed to set a new ATH price, almost touching $3, but went on to fall lower from there until reaching support amid the lower angle of the price channel at around $2.50. It has since rebounded from there today as it attempts to head back towards ATH levels.
Looking ahead, the first resistance lies at $2.80 (1.414 Fib extension). This is followed by $2.95-$3.00 (ATH area), $3.20, $3.40 (1.272 Fib Extension), and $3.50.
On the other side, the first support lies at the lower angle of the price channel, around $2.50. This is followed by added support at $2.35 (.382 Fib), $2.23 (20-day MA), $2.15 (.5 Fib), and $2.00 (.618 Fib).
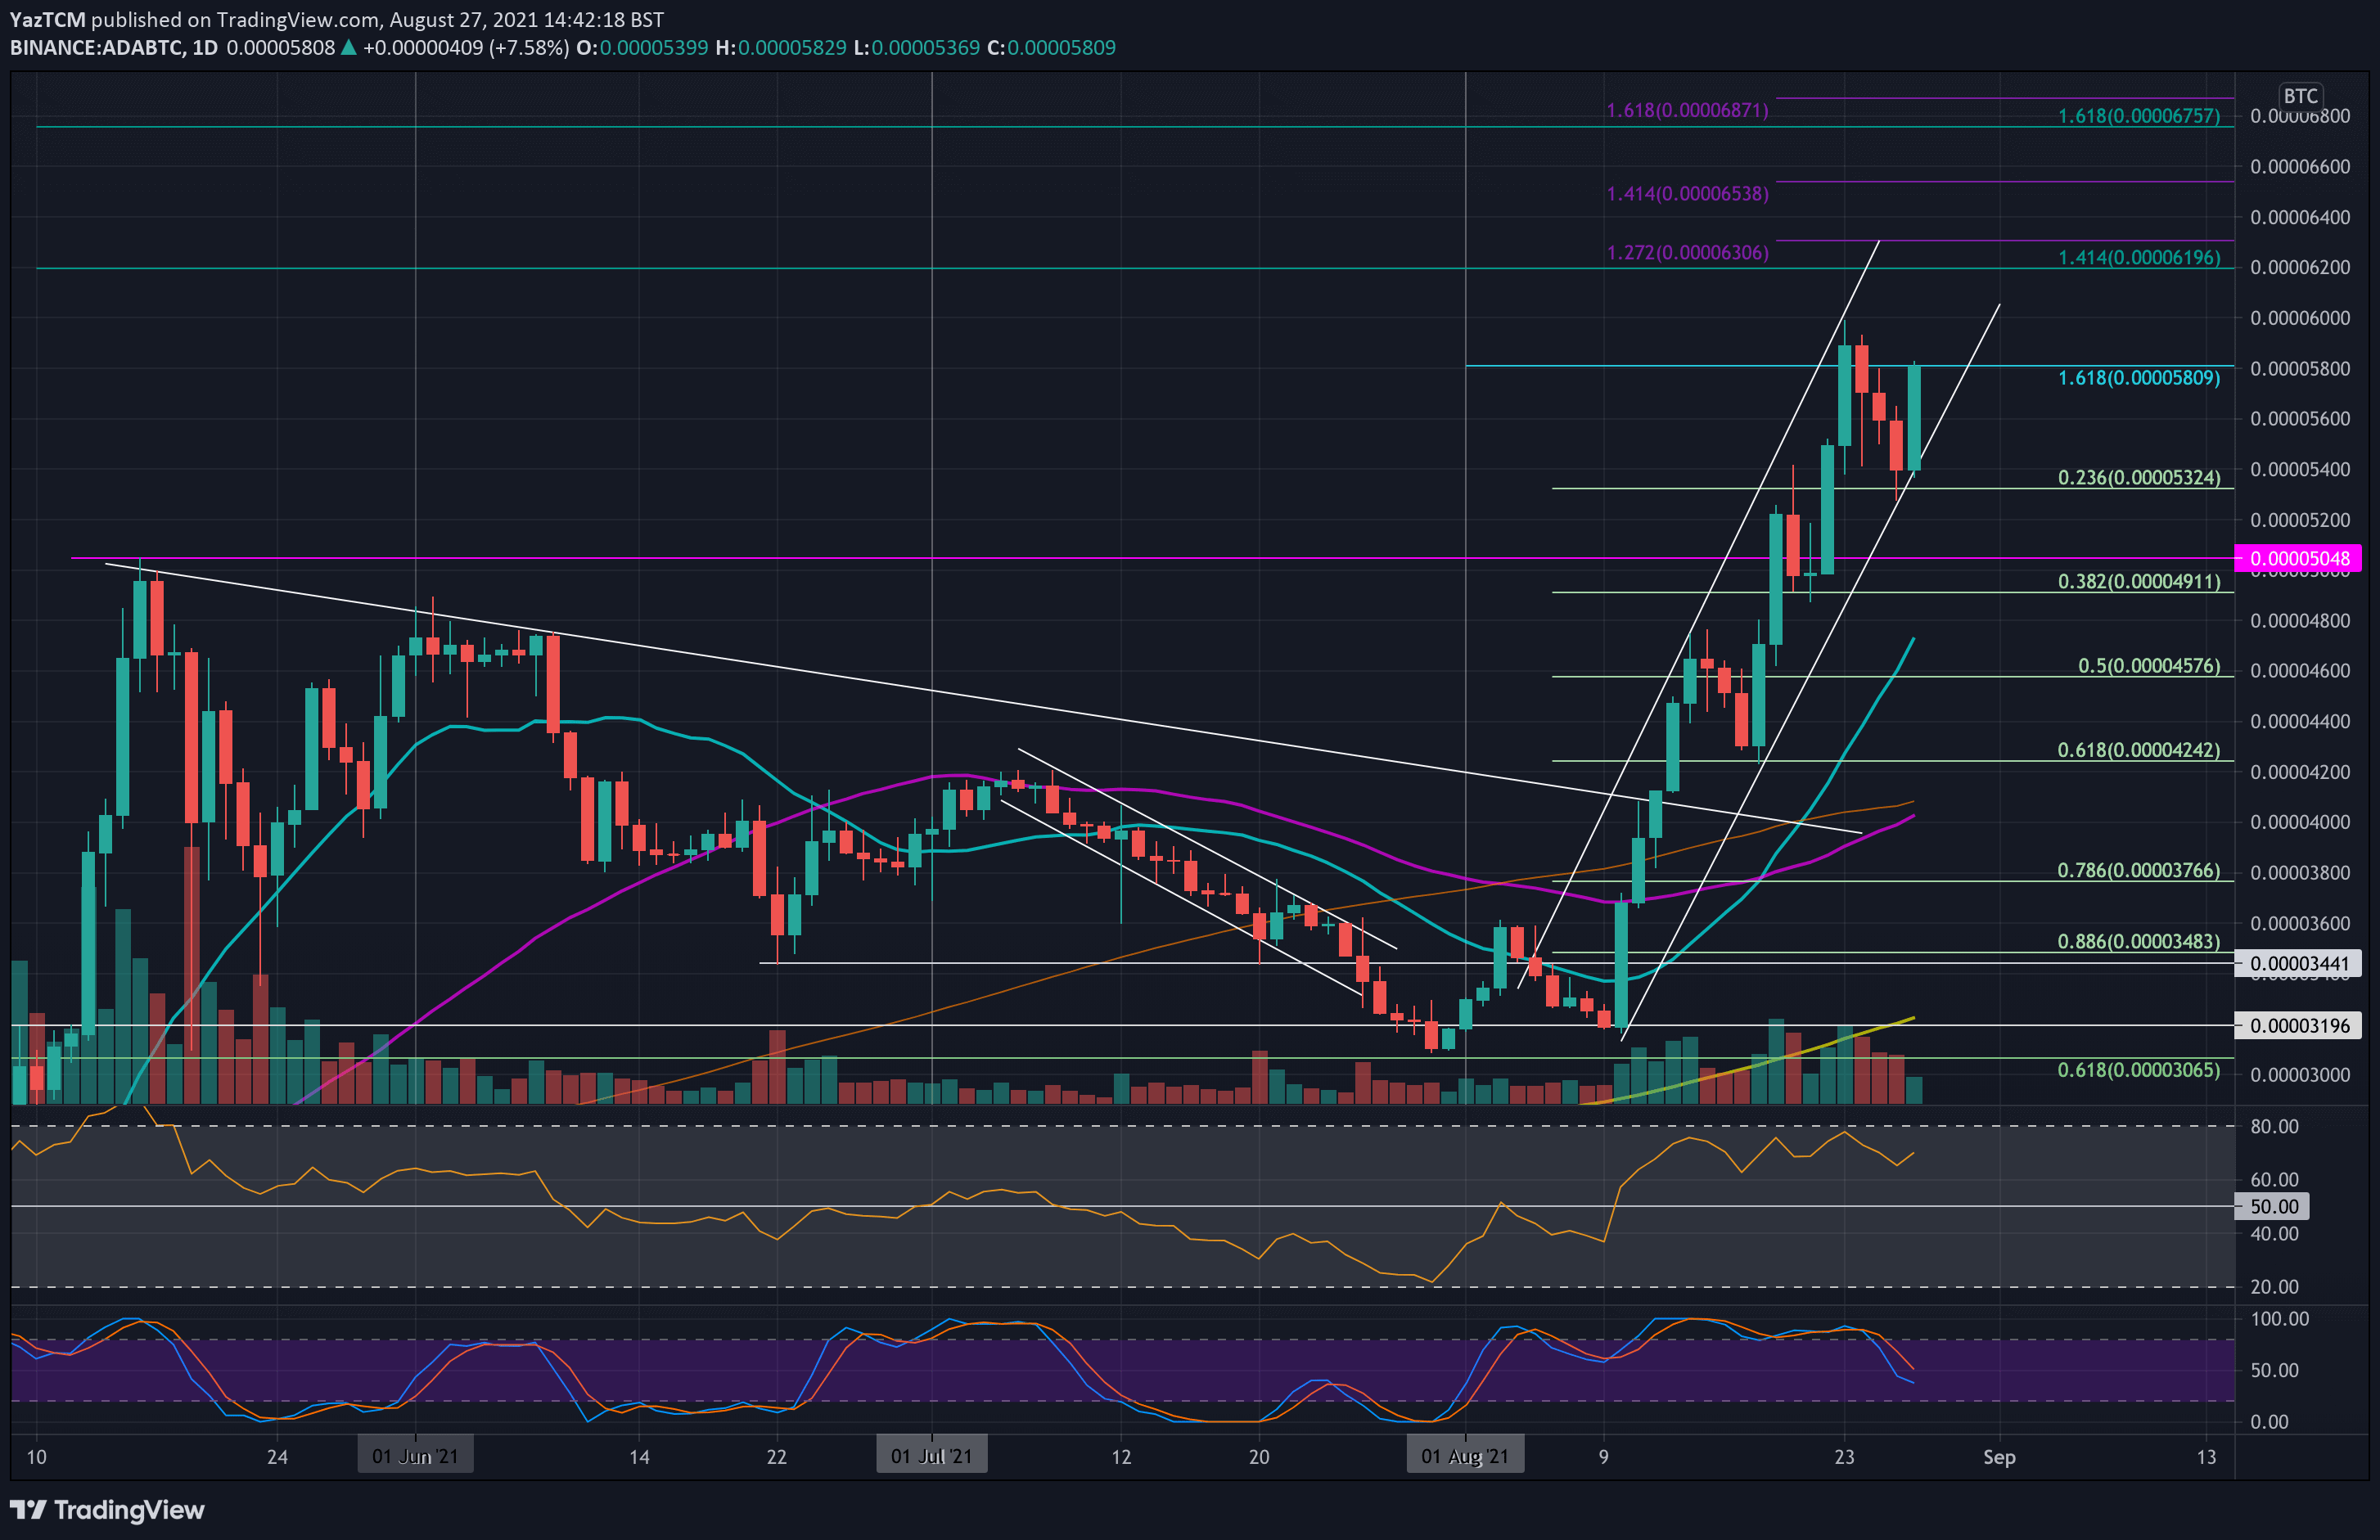
ADA/BTC also continues to perform well, as it also trades inside an ascending price channel. The coin surged above 5000 SAT at the start of the week to set a new ATH (against BTC) at almost 6000 SAT on Monday.
From there, it started to head lower until the support met at the lower angle of the price channel. Following the retest, ADA/BTC rebounded sharply to shoot back above 5800 SAT as of now.
Looking ahead, the first solid resistance lies at 6000 SAT. This is followed by 6200 SAT, 6300 SAT (1.272 Fib Extension), 6540 SAT (1.414 Fib Extension), and 6870 SAT (1.618 Fib Extension).
On the other side, the first support lies at the lower angle of the price channel. This is followed by 5325 SAT (.236 Fib), 5050 SAT (May high), 4910 SAT (.382 Fib), and 4700 SAT (20-day MA).
Solana (SOL)
SOL is also performing very well this week after surging by a solid 11% to set another ATH at $84.20. The coin retraced from $80 over the weekend and started to decline throughout the week until support was found around $70 (.236 Fib) on Wednesday.
It then rebounded from there, and started to head higher as it breached above $75 yesterday. Today, it continued to shoot higher from $75 to break $80 and set the new ATH price.
Looking ahead, the first resistance lies at $87.20 (1.618 Fib Extension – blue). This is followed by $90, $96.60 (1.272 Fib Extension), $100, and $105 (1.414 Fib Extension).
On the other side, the first support lies at $80. This is followed by $75, $70 (.236 Fib), $60.50 (.382 Fib & 20-day MA), $58.50, and $53.15 (.5 Fib).

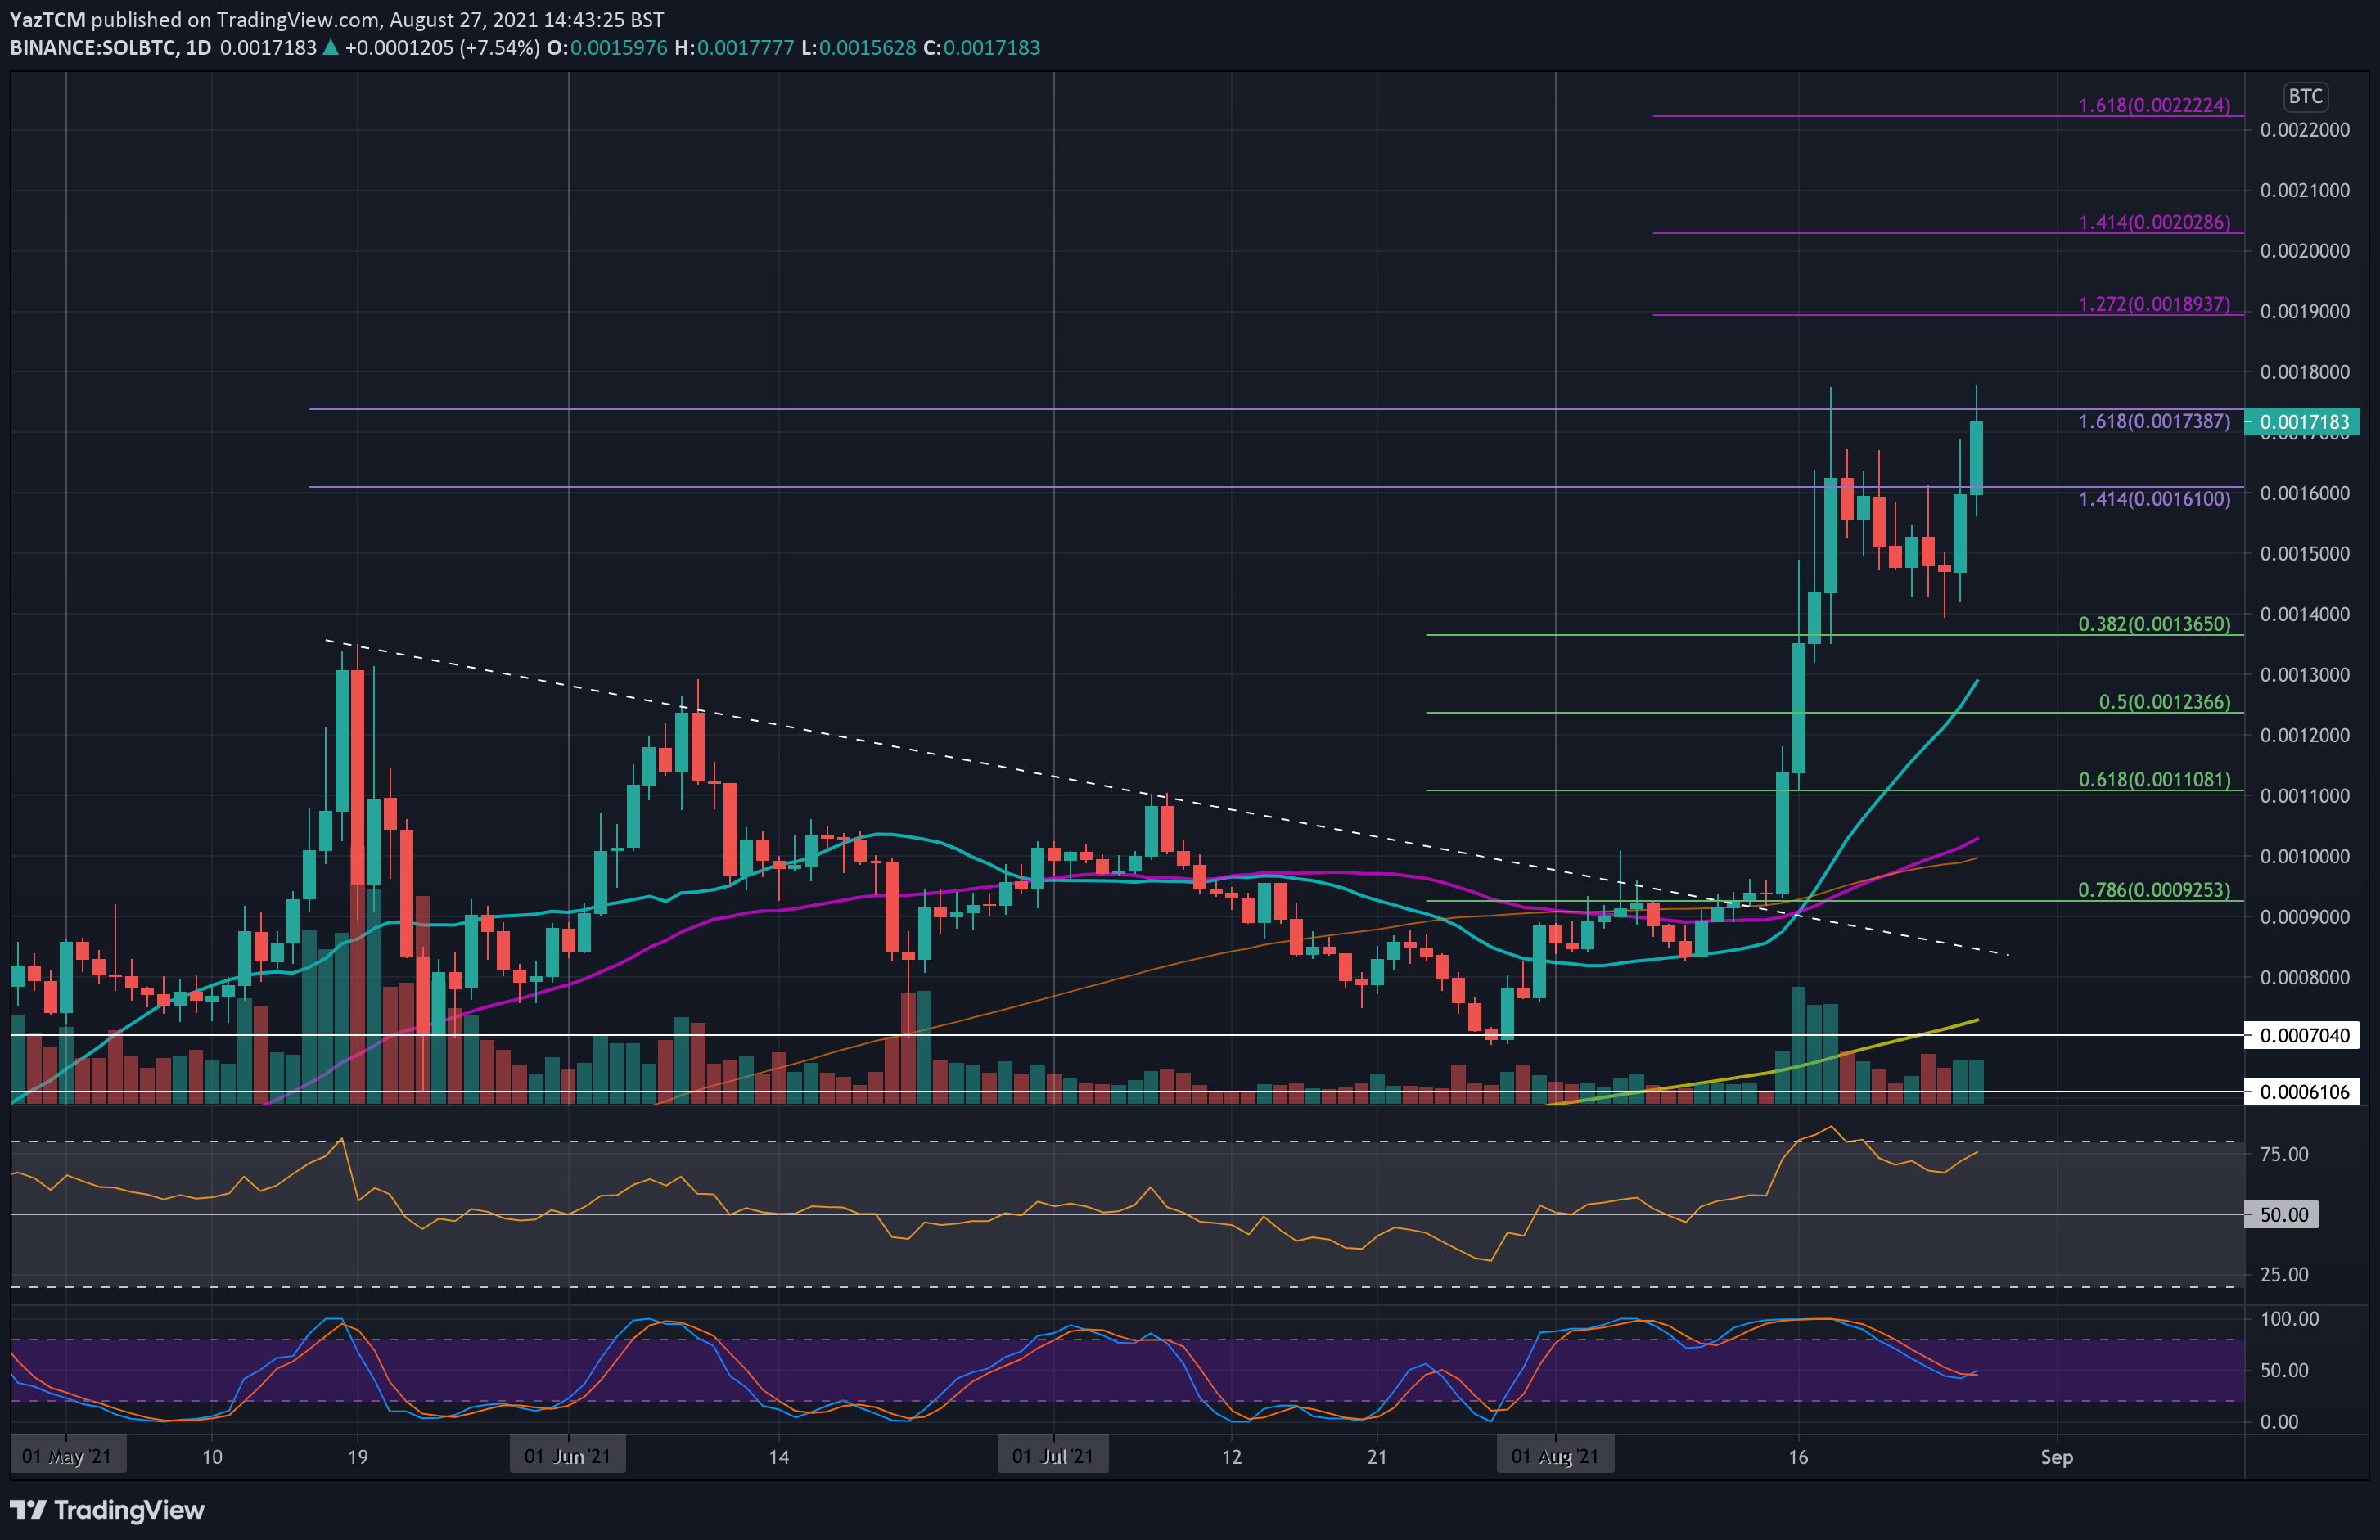
Against BTC, SOL also is performing very well trading around ATH levels of 0.00177 BTC. The cryptocurrency was falling throughout the first half of the week until support was found around 0.00146 BTC on Wednesday.
SOL rebounded from there yesterday to break 0.0015 BTC and hit 0.0016 BTC. It continued upward today to return to the 0.00177 BTC ATH, which was set just earlier last week.
Looking ahead, if the buyers break the ATH, the first resistance lies at 0.0019 BTC (1.272 Fib Extension). This is followed by 0.002 BTC, 0.00202 BTC (1.414 Fib Extension), 0.0021 BTC, and 0.00222 BTC (1.618 Fib Extension).
On the other side, the first support lies at 0.0016 BTC. This is followed by 0.0015 BTC (the week’s low), 0.00136 BTC (.382 Fib), 0.0013 BTC (20-day MA), and 0.00123 BTC (.5 Fib).