XRP/USD – XRP Breaks June Price Channel Key Support Levels: %excerpt%.556, %excerpt%.515, %excerpt%.5.Key Resistance Levels: %excerpt%.61, %excerpt%.7, %excerpt%.757. XRP fell as low as %excerpt%.515 this week during the BTC spike beneath K. It quickly rebounded from there to break above the 2018 high at %excerpt%.556 yesterday. Today, the price hike allowed XRP to break the upper angle of a descending price channel. The cryptocurrency has been trading inside this price channel since the start of June. It made numerous attempts to break its upper angle over the past fortnight but was rejected on each occasion. If XRP can close a daily candle above the price channel today, it could be the first signal that it is ready to head back toward the July highs and possibly further. XRP/USD Daily Chart. Source: TradingView.XRP-USD
Topics:
Yaz Sheikh considers the following as important: Ripple (XRP) Price, XRP Analysis, xrpbtc, xrpusd
This could be interesting, too:
Jordan Lyanchev writes Ripple’s (XRP) Surge to Triggers Over Million in Short Liquidations
Jordan Lyanchev writes Trump Confirms Work on Strategic Crypto Reserve: XRP, ADA, SOL Included
Dimitar Dzhondzhorov writes Is a Major Ripple v. SEC Lawsuit Development Expected This Week? Here’s Why
Mandy Williams writes Ripple Releases Institutional DeFi Roadmap for XRP Ledger in 2025
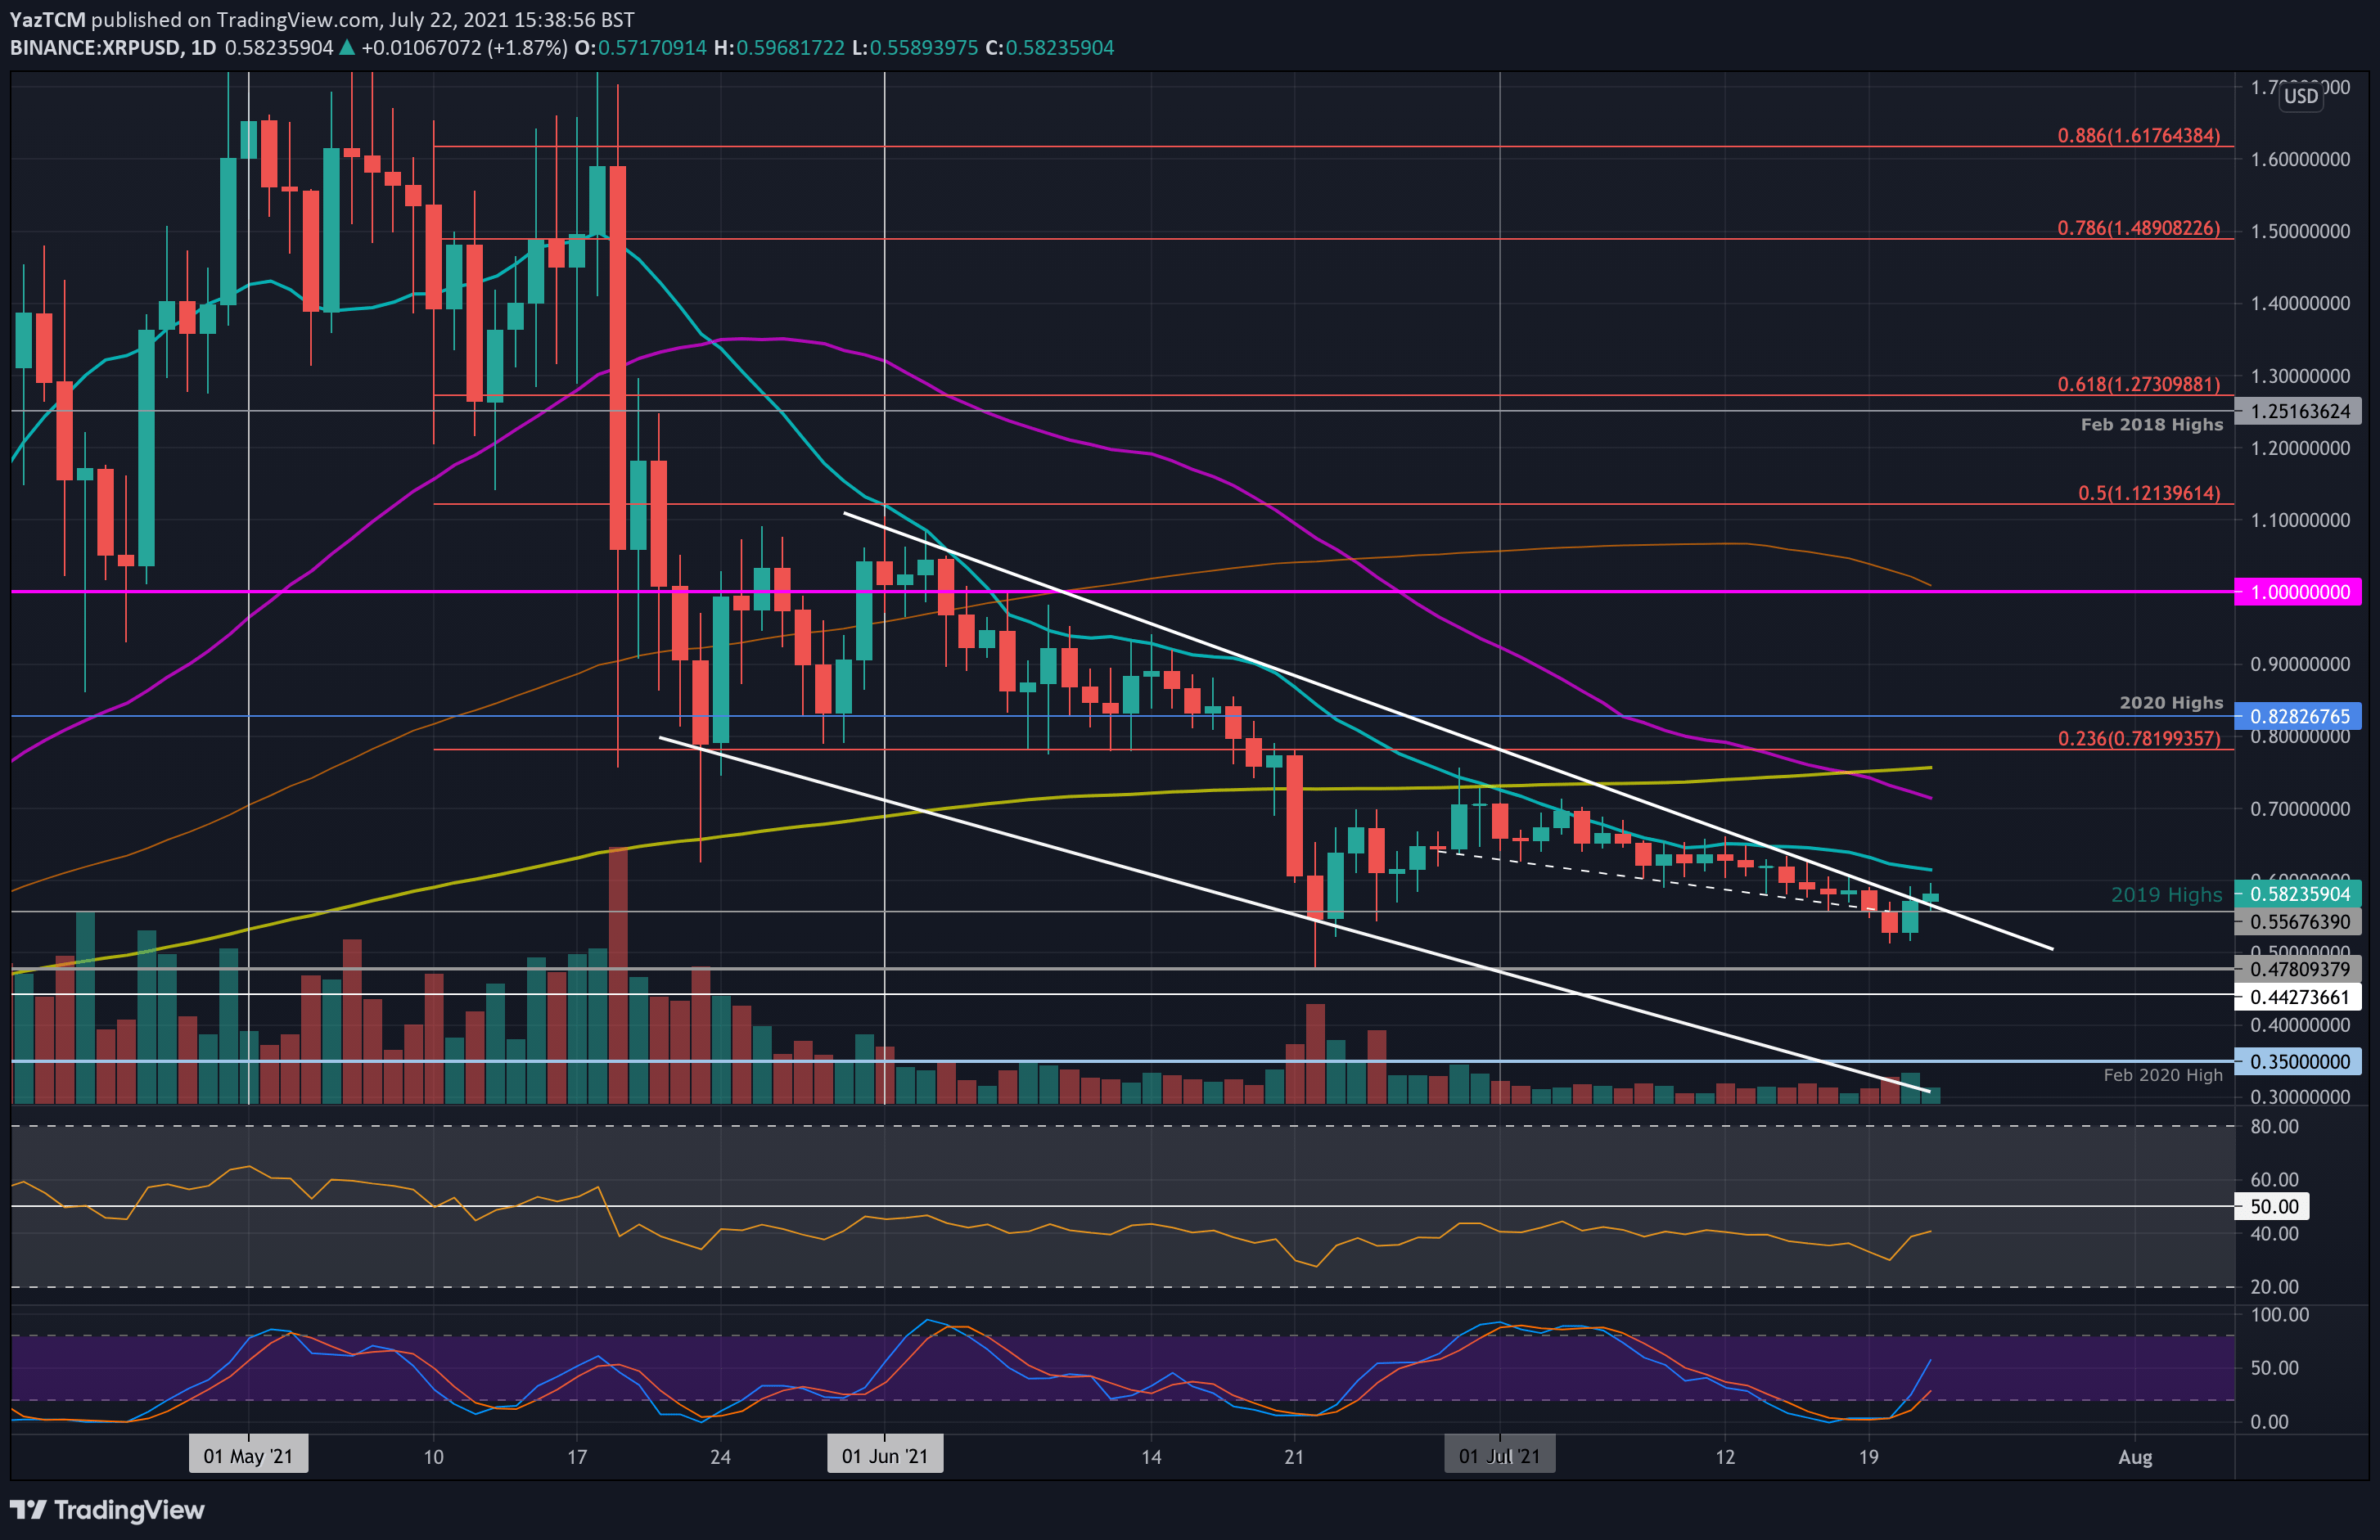
XRP/USD – XRP Breaks June Price Channel
Key Support Levels: $0.556, $0.515, $0.5.
Key Resistance Levels: $0.61, $0.7, $0.757.
XRP fell as low as $0.515 this week during the BTC spike beneath $30K. It quickly rebounded from there to break above the 2018 high at $0.556 yesterday. Today, the price hike allowed XRP to break the upper angle of a descending price channel.
The cryptocurrency has been trading inside this price channel since the start of June. It made numerous attempts to break its upper angle over the past fortnight but was rejected on each occasion.
If XRP can close a daily candle above the price channel today, it could be the first signal that it is ready to head back toward the July highs and possibly further.
XRP-USD Short Term Price Prediction
Looking ahead, if the buyers continue upward, the first resistance lies at $0.61 (20-day MA). This is followed by $0.7 (50-day MA & July highs), $0.757 (200-day MA), and $0.78 (bearish .236 Fib).
On the other side, the first support lies at $0.556 (2019 high & price channel support). This is followed by $0.515, $0.5, and $0.478.
The RSI remains in bearish territory beneath the midline. The recent uptick suggests that the bearish momentum is showing signs of fading, but it would need to break the midline to turn bullish. It has not been above the midline since mid-May.
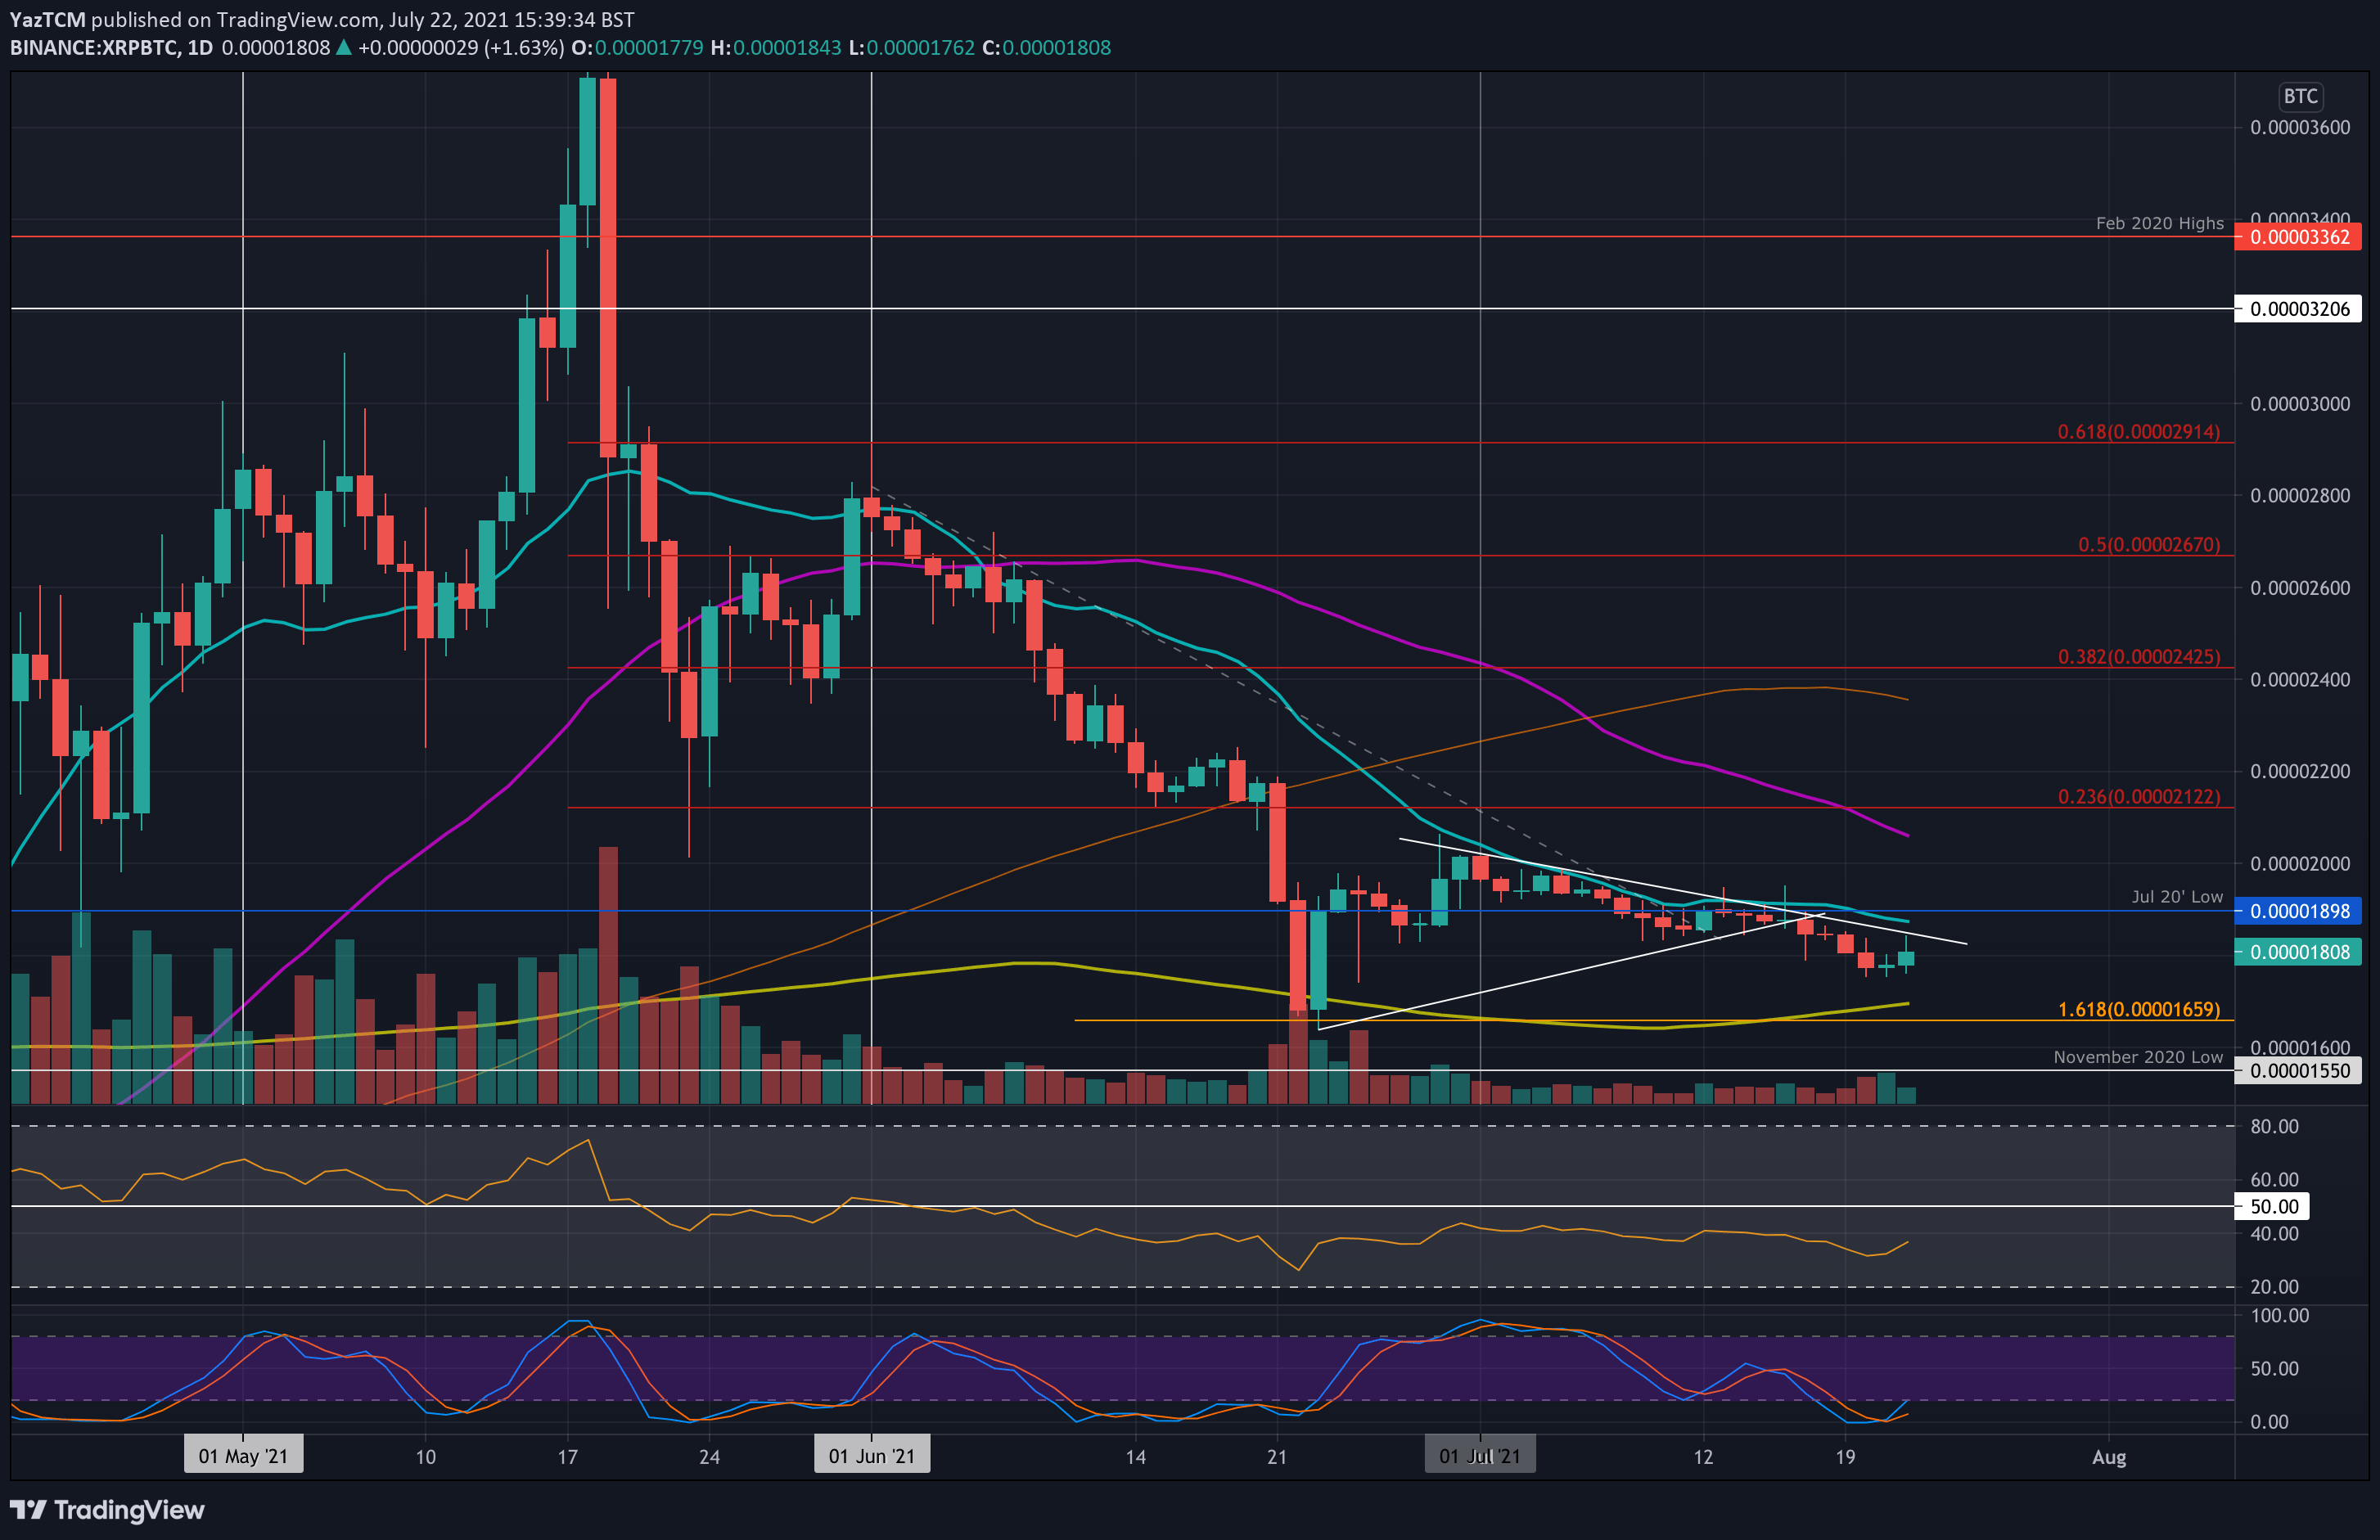
XRP/BTC – Bulls Battle To Prevent Further Declines.
Key Support Levels: 1750 SAT, 1700 SAT, 1660 SAT.
Key Resistance Levels: 1850 SAT, 1900 SAT, 2000 SAT.
Against BTC, XRP fell beneath a symmetrical triangle pattern earlier in the week. XRP attempted to break the upper angle prior to the breakout but was rejected on each attempt by the 20-day MA.
Since breaking beneath the triangle, XRP fell as low as 1750 SAT yesterday. However, it has since rebounded back above 1800 SAT as the buyers battle to prevent further declines.
XRP-BTC Short Term Price Prediction
Looking ahead, the first resistance lies at 1850 SAT, provided by a falling trend line. This is followed by 1900 SAT (20-day MA & July 2020 low), 2000 SAT, and 2060 SAT (50-day MA).
On the other side, the first support lies at 1750 SAT. This is followed by 1700 SAT (200-day MA), 1660 SAT, and 1550 SAT (Nov 2020 low).
Again, the RSI remains deep in the bearish territory.