XLM/USD – Bulls Defend Support at %excerpt%.27Key Support Levels: %excerpt%.27, %excerpt%.257, %excerpt%.224.Key Resistance Levels: %excerpt%.3, %excerpt%.325, %excerpt%.35.XLM seems to be holding strong at the %excerpt%.27 support over the past three days after it surged as high as %excerpt%.45 last week. The cryptocurrency could not break a daily candle above %excerpt%.35 and started to head lower from there. Nevertheless, it’s up about 50% since the open seven days ago and it’s now facing an important resistance.During the BTC intra-day price drop on Monday, XLM fell as low as %excerpt%.2 but quickly recovered to close the daily candle above %excerpt%.27. It has since pushed higher toward %excerpt%.286 but is trading beneath a short term falling trend line, which will need to be penetrated to head higher.XLM/USD Daily Chart. Source: TradingViewXLM-USD Short Term Price
Topics:
Yaz Sheikh considers the following as important: Price Analysis, Stellar (XLM) Price, XLMBTC, XLMUSD
This could be interesting, too:
Jordan Lyanchev writes Stellar (XLM) Explodes by 30% in 2 Days, Bitcoin (BTC) Stable at K (Weekend Watch)
CryptoVizArt writes ETH’s Path to K Involves Maintaining This Critical Support (Ethereum Price Analysis)
Duo Nine writes Crypto Price Analysis June-29: ETH, XRP, ADA, DOGE, and DOT
Duo Nine writes Crypto Price Analysis June-15: ETH, XRP, ADA, DOGE, and DOT
XLM/USD – Bulls Defend Support at $0.27
Key Support Levels: $0.27, $0.257, $0.224.
Key Resistance Levels: $0.3, $0.325, $0.35.
XLM seems to be holding strong at the $0.27 support over the past three days after it surged as high as $0.45 last week. The cryptocurrency could not break a daily candle above $0.35 and started to head lower from there. Nevertheless, it’s up about 50% since the open seven days ago and it’s now facing an important resistance.
During the BTC intra-day price drop on Monday, XLM fell as low as $0.2 but quickly recovered to close the daily candle above $0.27. It has since pushed higher toward $0.286 but is trading beneath a short term falling trend line, which will need to be penetrated to head higher.
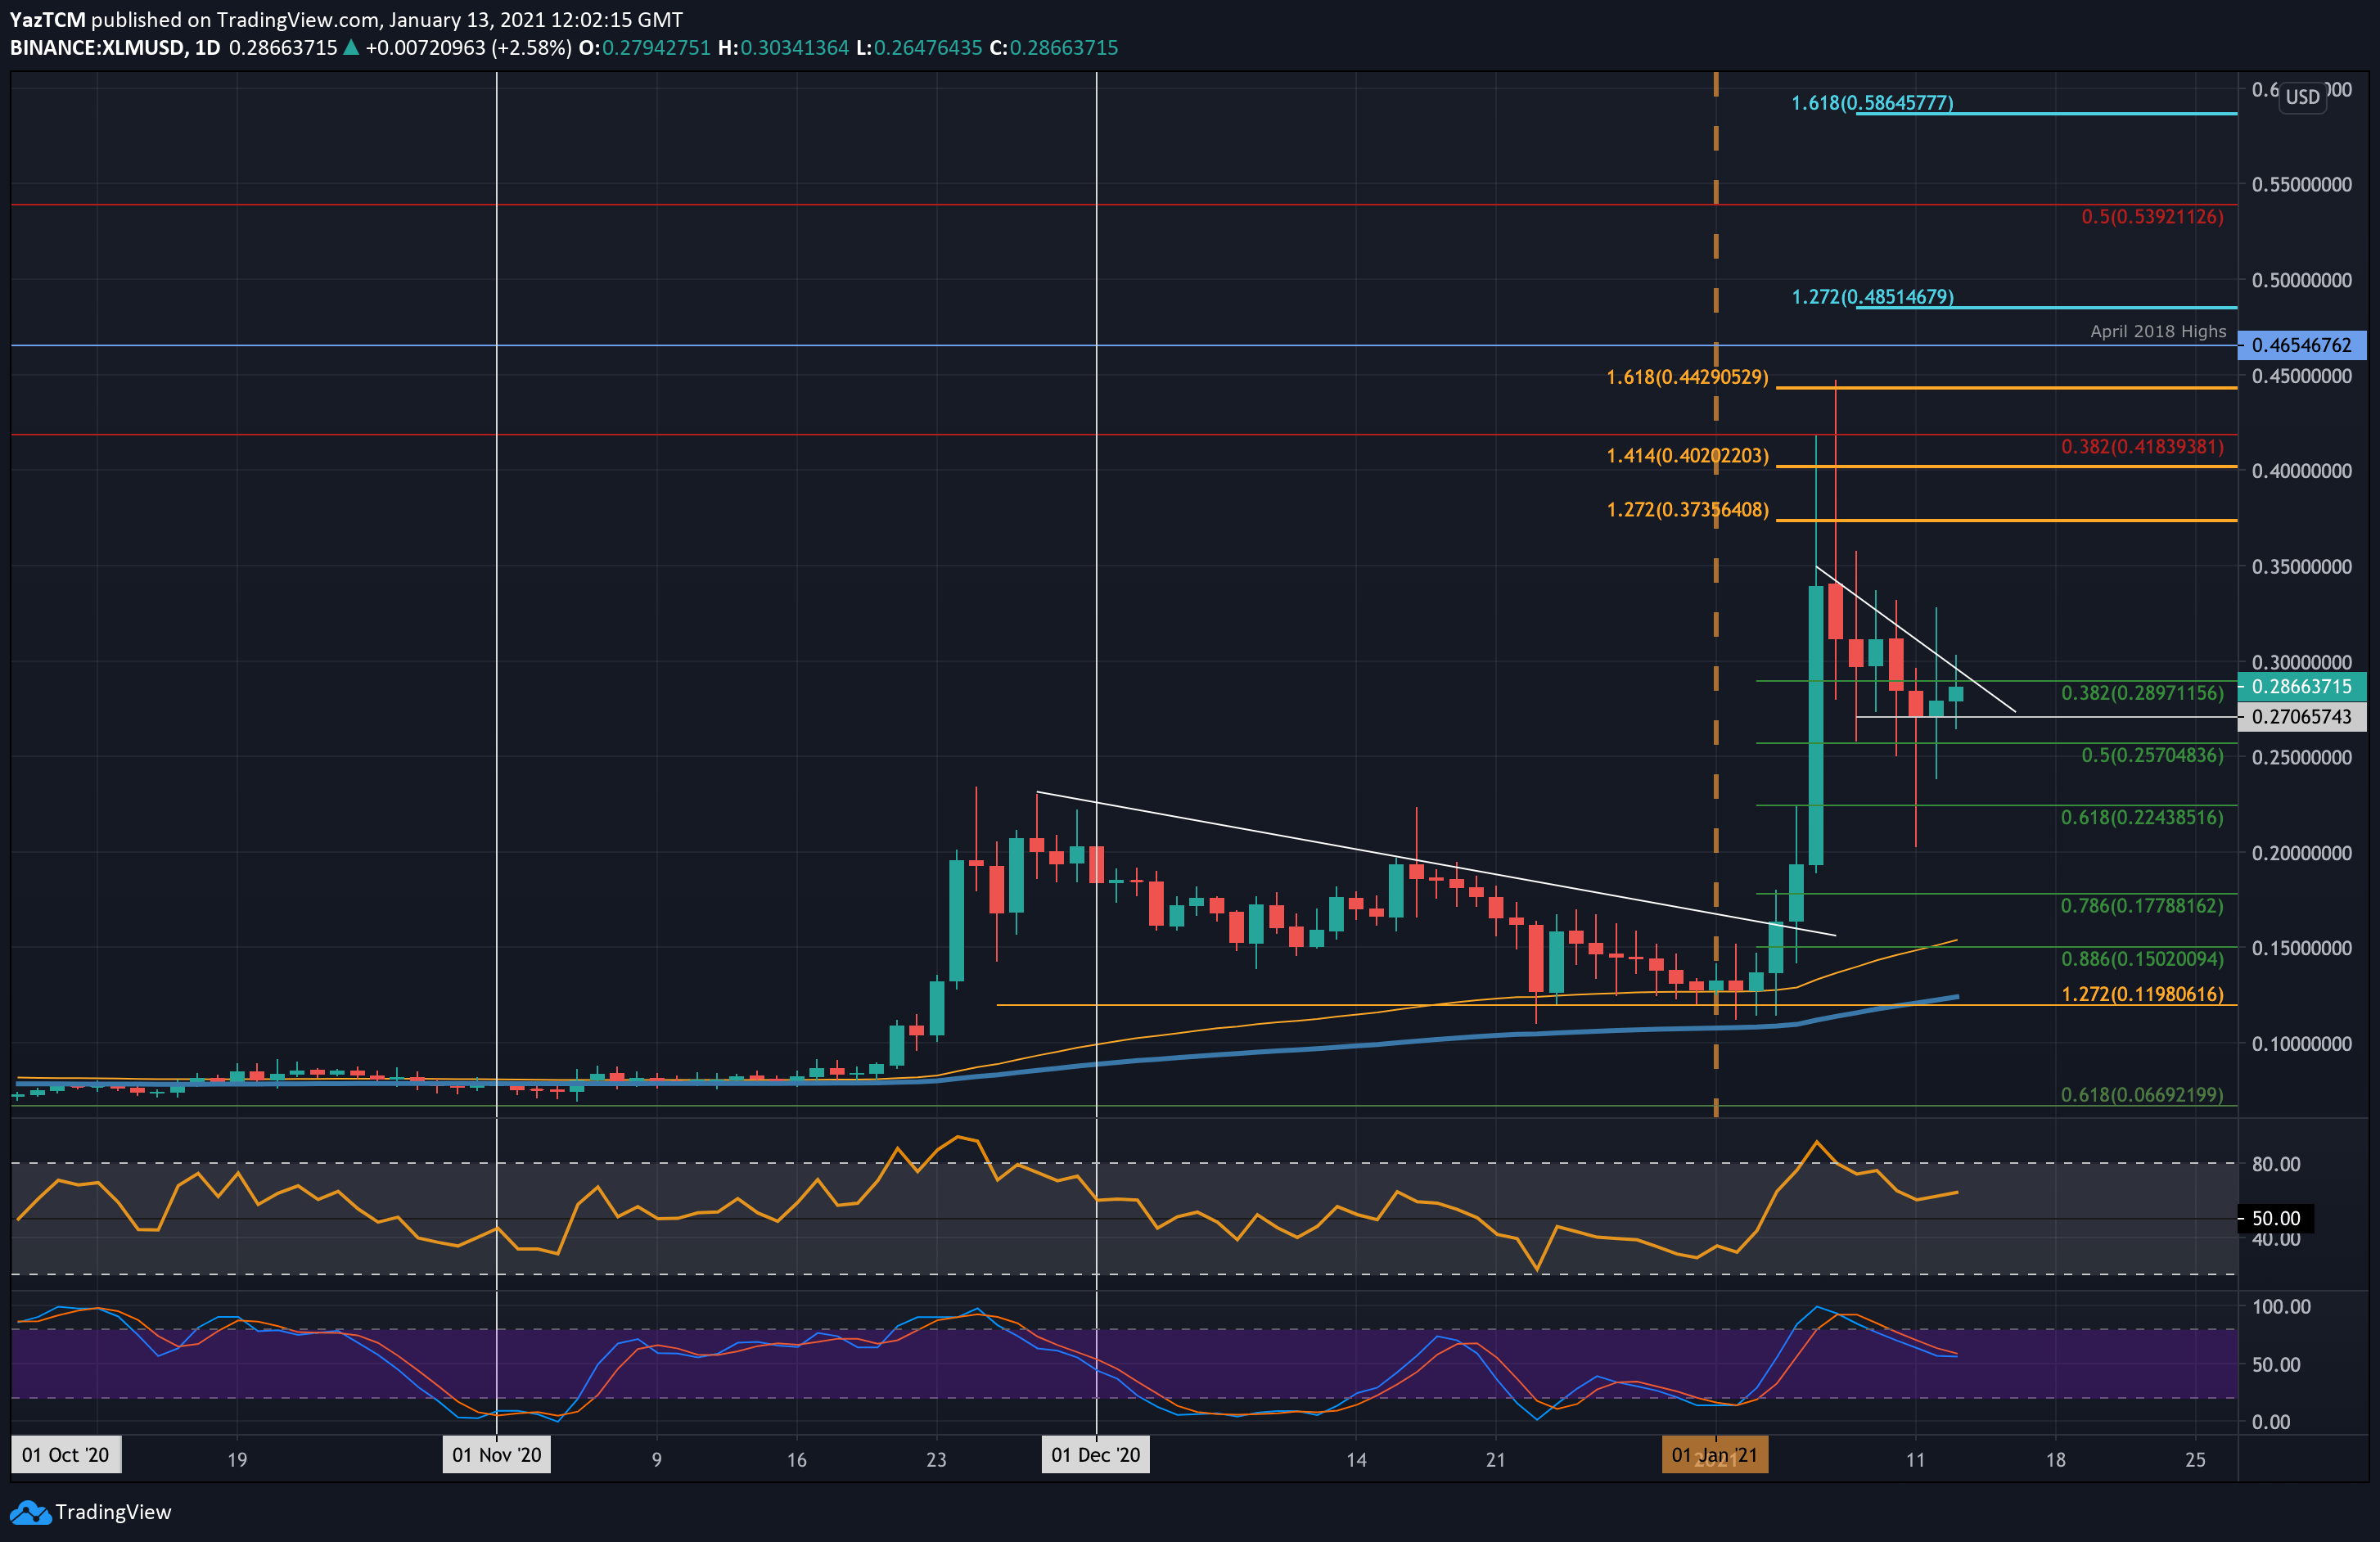
XLM-USD Short Term Price Prediction
Looking ahead, if the bulls break the current falling trend line, the first level of resistance lies at $0.3. This is followed by $0.325, $0.35, and $0.373 (1.272 Fib Extension). Additional resistance lies at $0.4, $0.418 (bearish .382 Fib Retracement), and $0.442 91.618 Fib Extension).
On the other side, the first level of support lies at $0.27. This is followed by $0.257 (.5 Fib), $0.224 (.618 Fib), and $0.2.
The daily RSI remains above the mid-line and has dropped from extremely overbought conditions, giving the market breathing space to push higher again.
XLM/BTC – Stellar Holding Strong Above 200-days EMA
Key Support Levels: 800 SAT, 740 SAT, 700 SAT.
Key Resistance Levels: 935 SAT, 1000 SAT, 1090 SAT.
Against Bitcoin, XLM had also surged as high as 1150 SAT last week. More specifically, it could not close a daily candle above resistance at 935 SAT (bearish .618 Fib Retracement). From there, it started to head lower toward the end of last week until support was found at 740 SAT (200-days EMA & .5 Fib).
It held this support for five days and rebounded from there yesterday. It is now trading above a steeply rising rend line at around 840 SAT.
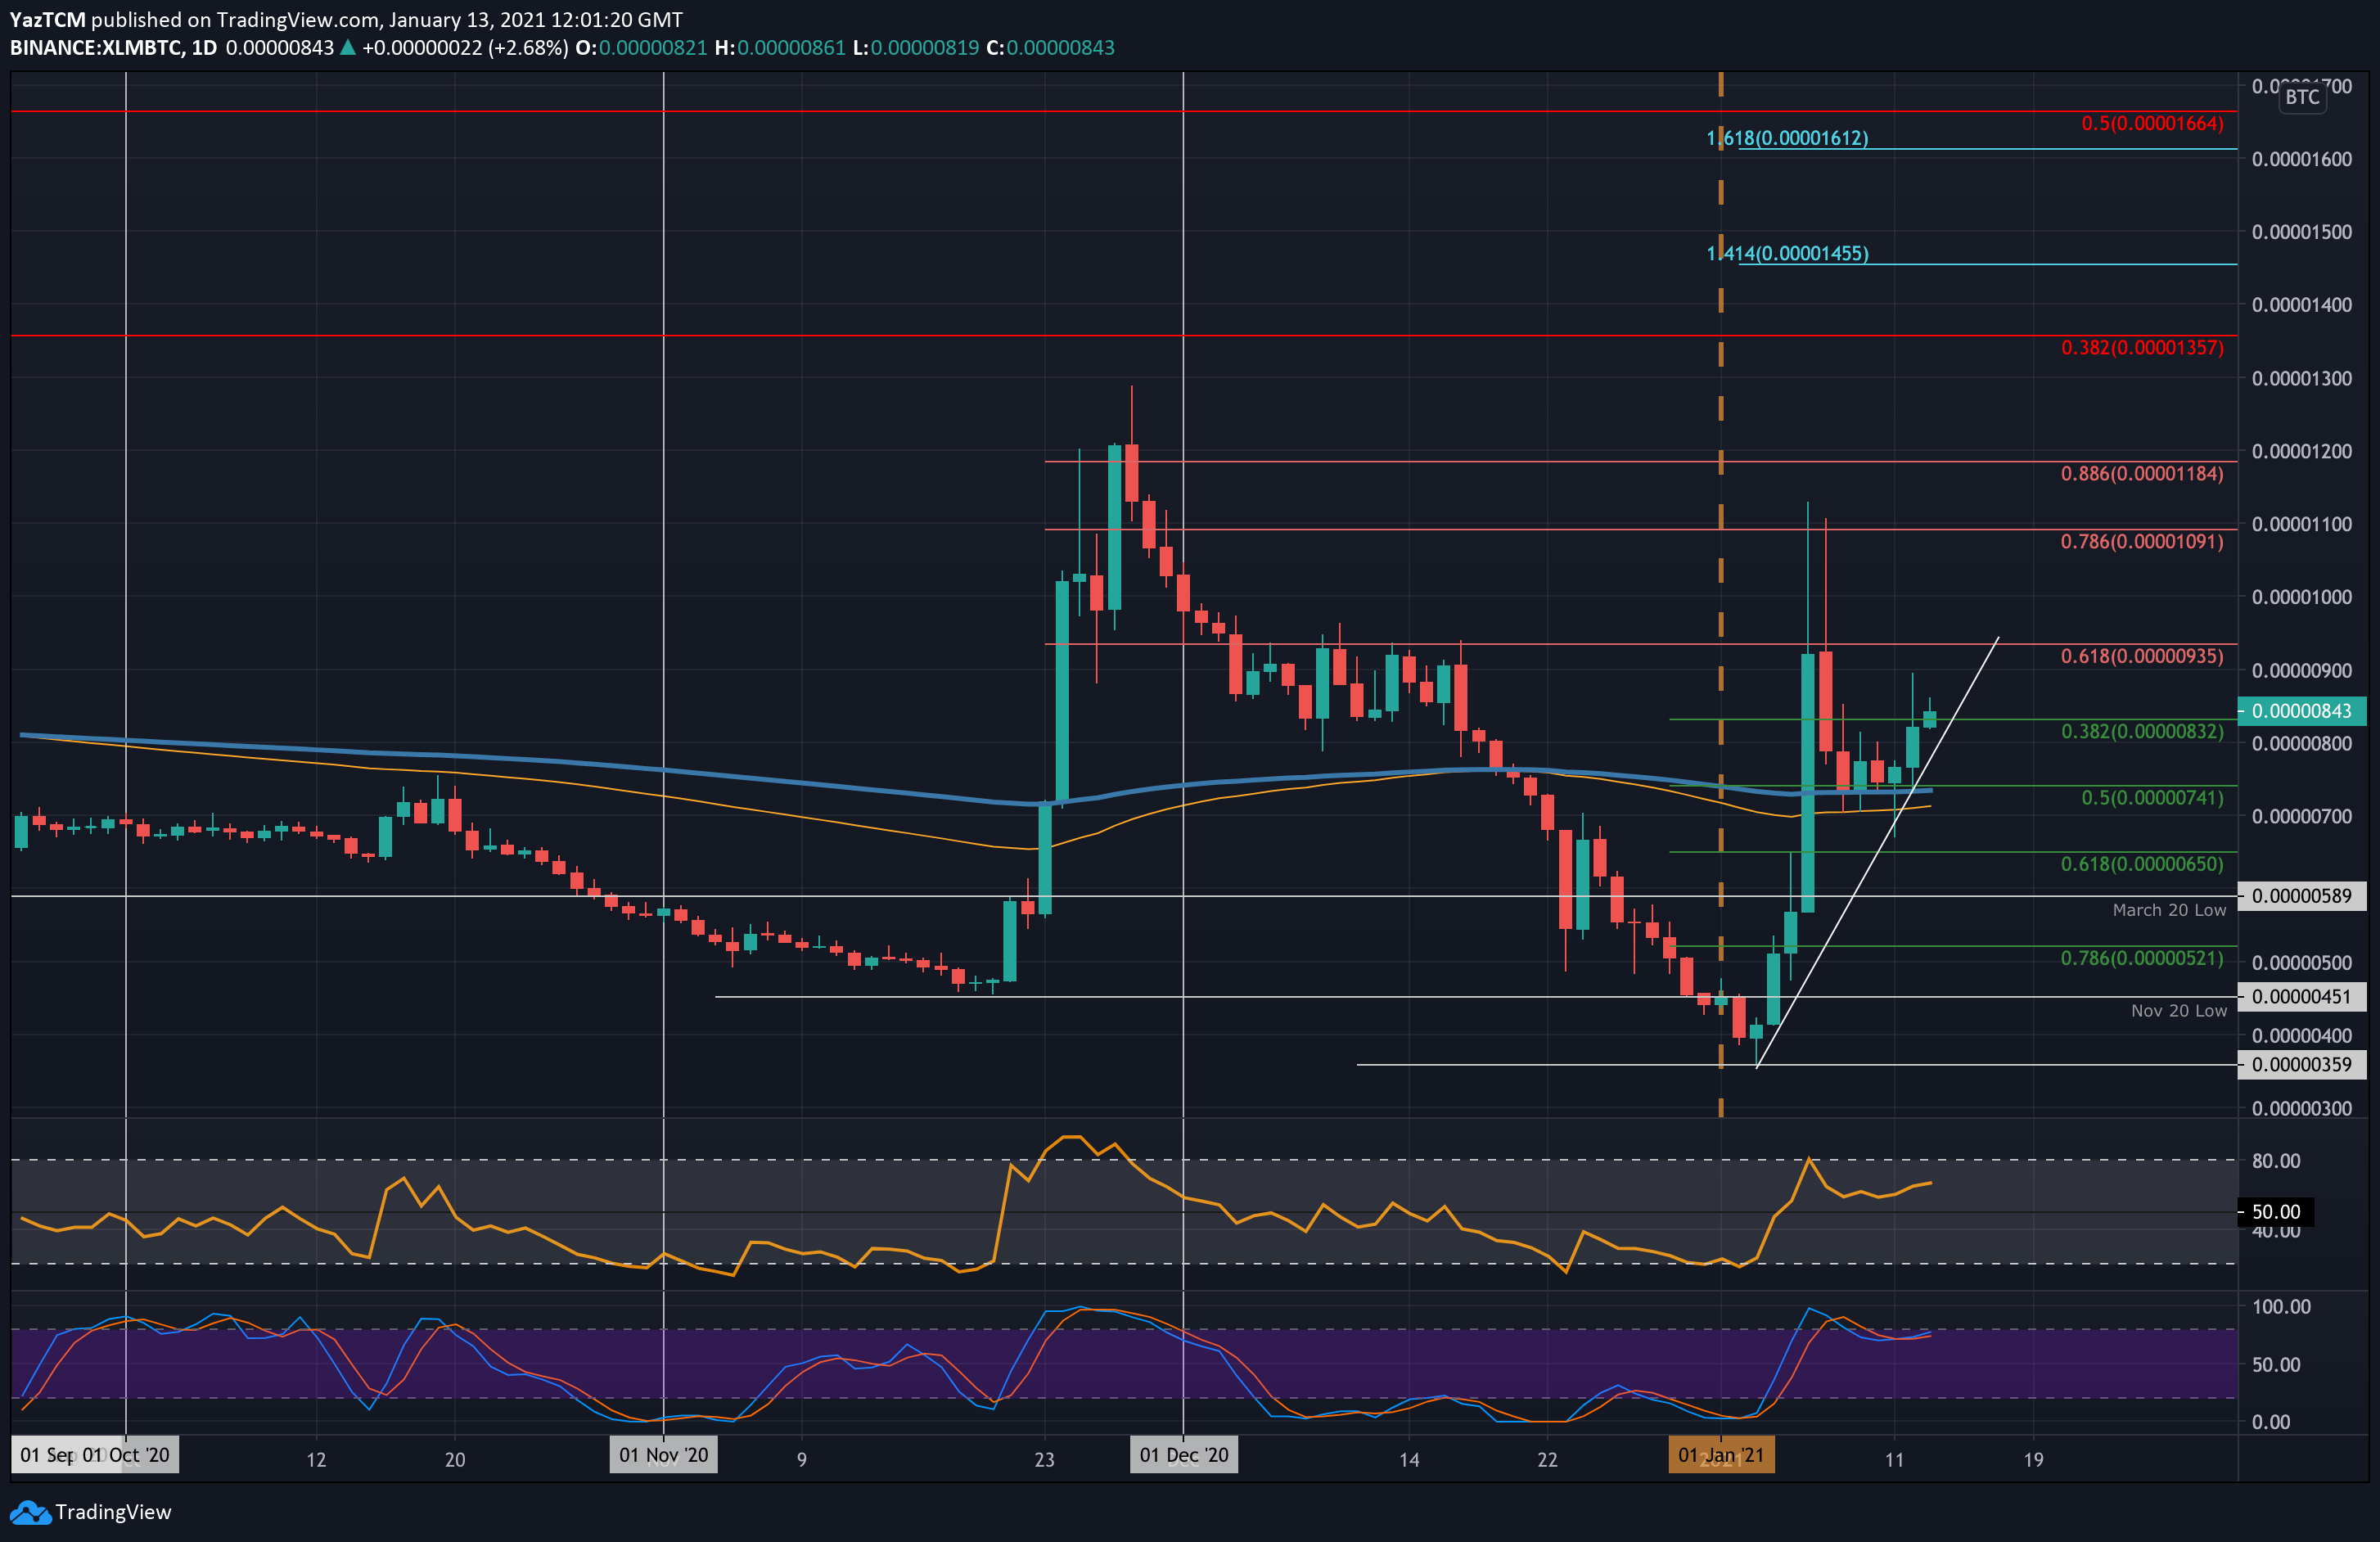
XLM-BTC Short Term Price Prediction
Moving forward, if the buyers push higher, the first level of resistance lies at 935 SAT (bearish .618 Fib). This is followed by resistance at 1000 SAT, 1091 SAT (bearish .786 Fib), and 1184 SAT (bearish .886 Fib).
On the other side, the first level of support lies at the rising trend line, around 800 SAT. Beneath this, support lies at 740 SAT (200-days EMA), 700 SAT (100-days EMA), 650 SAT (.618 Fib), and 590 SAT (March 20 low).
Likewise, the RSi has pulled back from extremely overbought conditions and is now pushing higher as the bullish momentum increases again.