Bitcoin continues its struggle to push and hold above K, as it has been rejected from this significant level for the third time. The price rebounded from the K support level last month and has been making higher highs and lows on the daily chart. This resulted in the creation of a bullish structure. Can the cryptocurrency finally break through its goal of the K resistance level? Technical Analysis By: Edris The Daily Chart As of this writing, Bitcoin has yet to break above the K resistance level. The 100-day moving average has reached the K range and is creating further resistance. In case of a short-term bearish pullback, the 50-day moving average – which currently sits around the K level – would be the first support. If the price breaks below the MA,
Topics:
CryptoVizArt considers the following as important: Bitcoin (BTC) Price, BTC Analysis, btcusd, btcusdt
This could be interesting, too:
Chayanika Deka writes XRP, SOL, and ADA Inclusion in US Crypto Reserve Pushes Traders on Edge
Chayanika Deka writes Why Arthur Hayes Is Bullish on Bitcoin Under Trump’s Economic Strategy
Mandy Williams writes Why the Bitcoin Market Is Stuck—and the Key Metric That Could Change It: CryptoQuant CEO
Wayne Jones writes Metaplanet Acquires 156 BTC, Bringing Total Holdings to 2,391
Bitcoin continues its struggle to push and hold above $24K, as it has been rejected from this significant level for the third time. The price rebounded from the $20K support level last month and has been making higher highs and lows on the daily chart. This resulted in the creation of a bullish structure. Can the cryptocurrency finally break through its goal of the $24K resistance level?
Technical Analysis
By: Edris
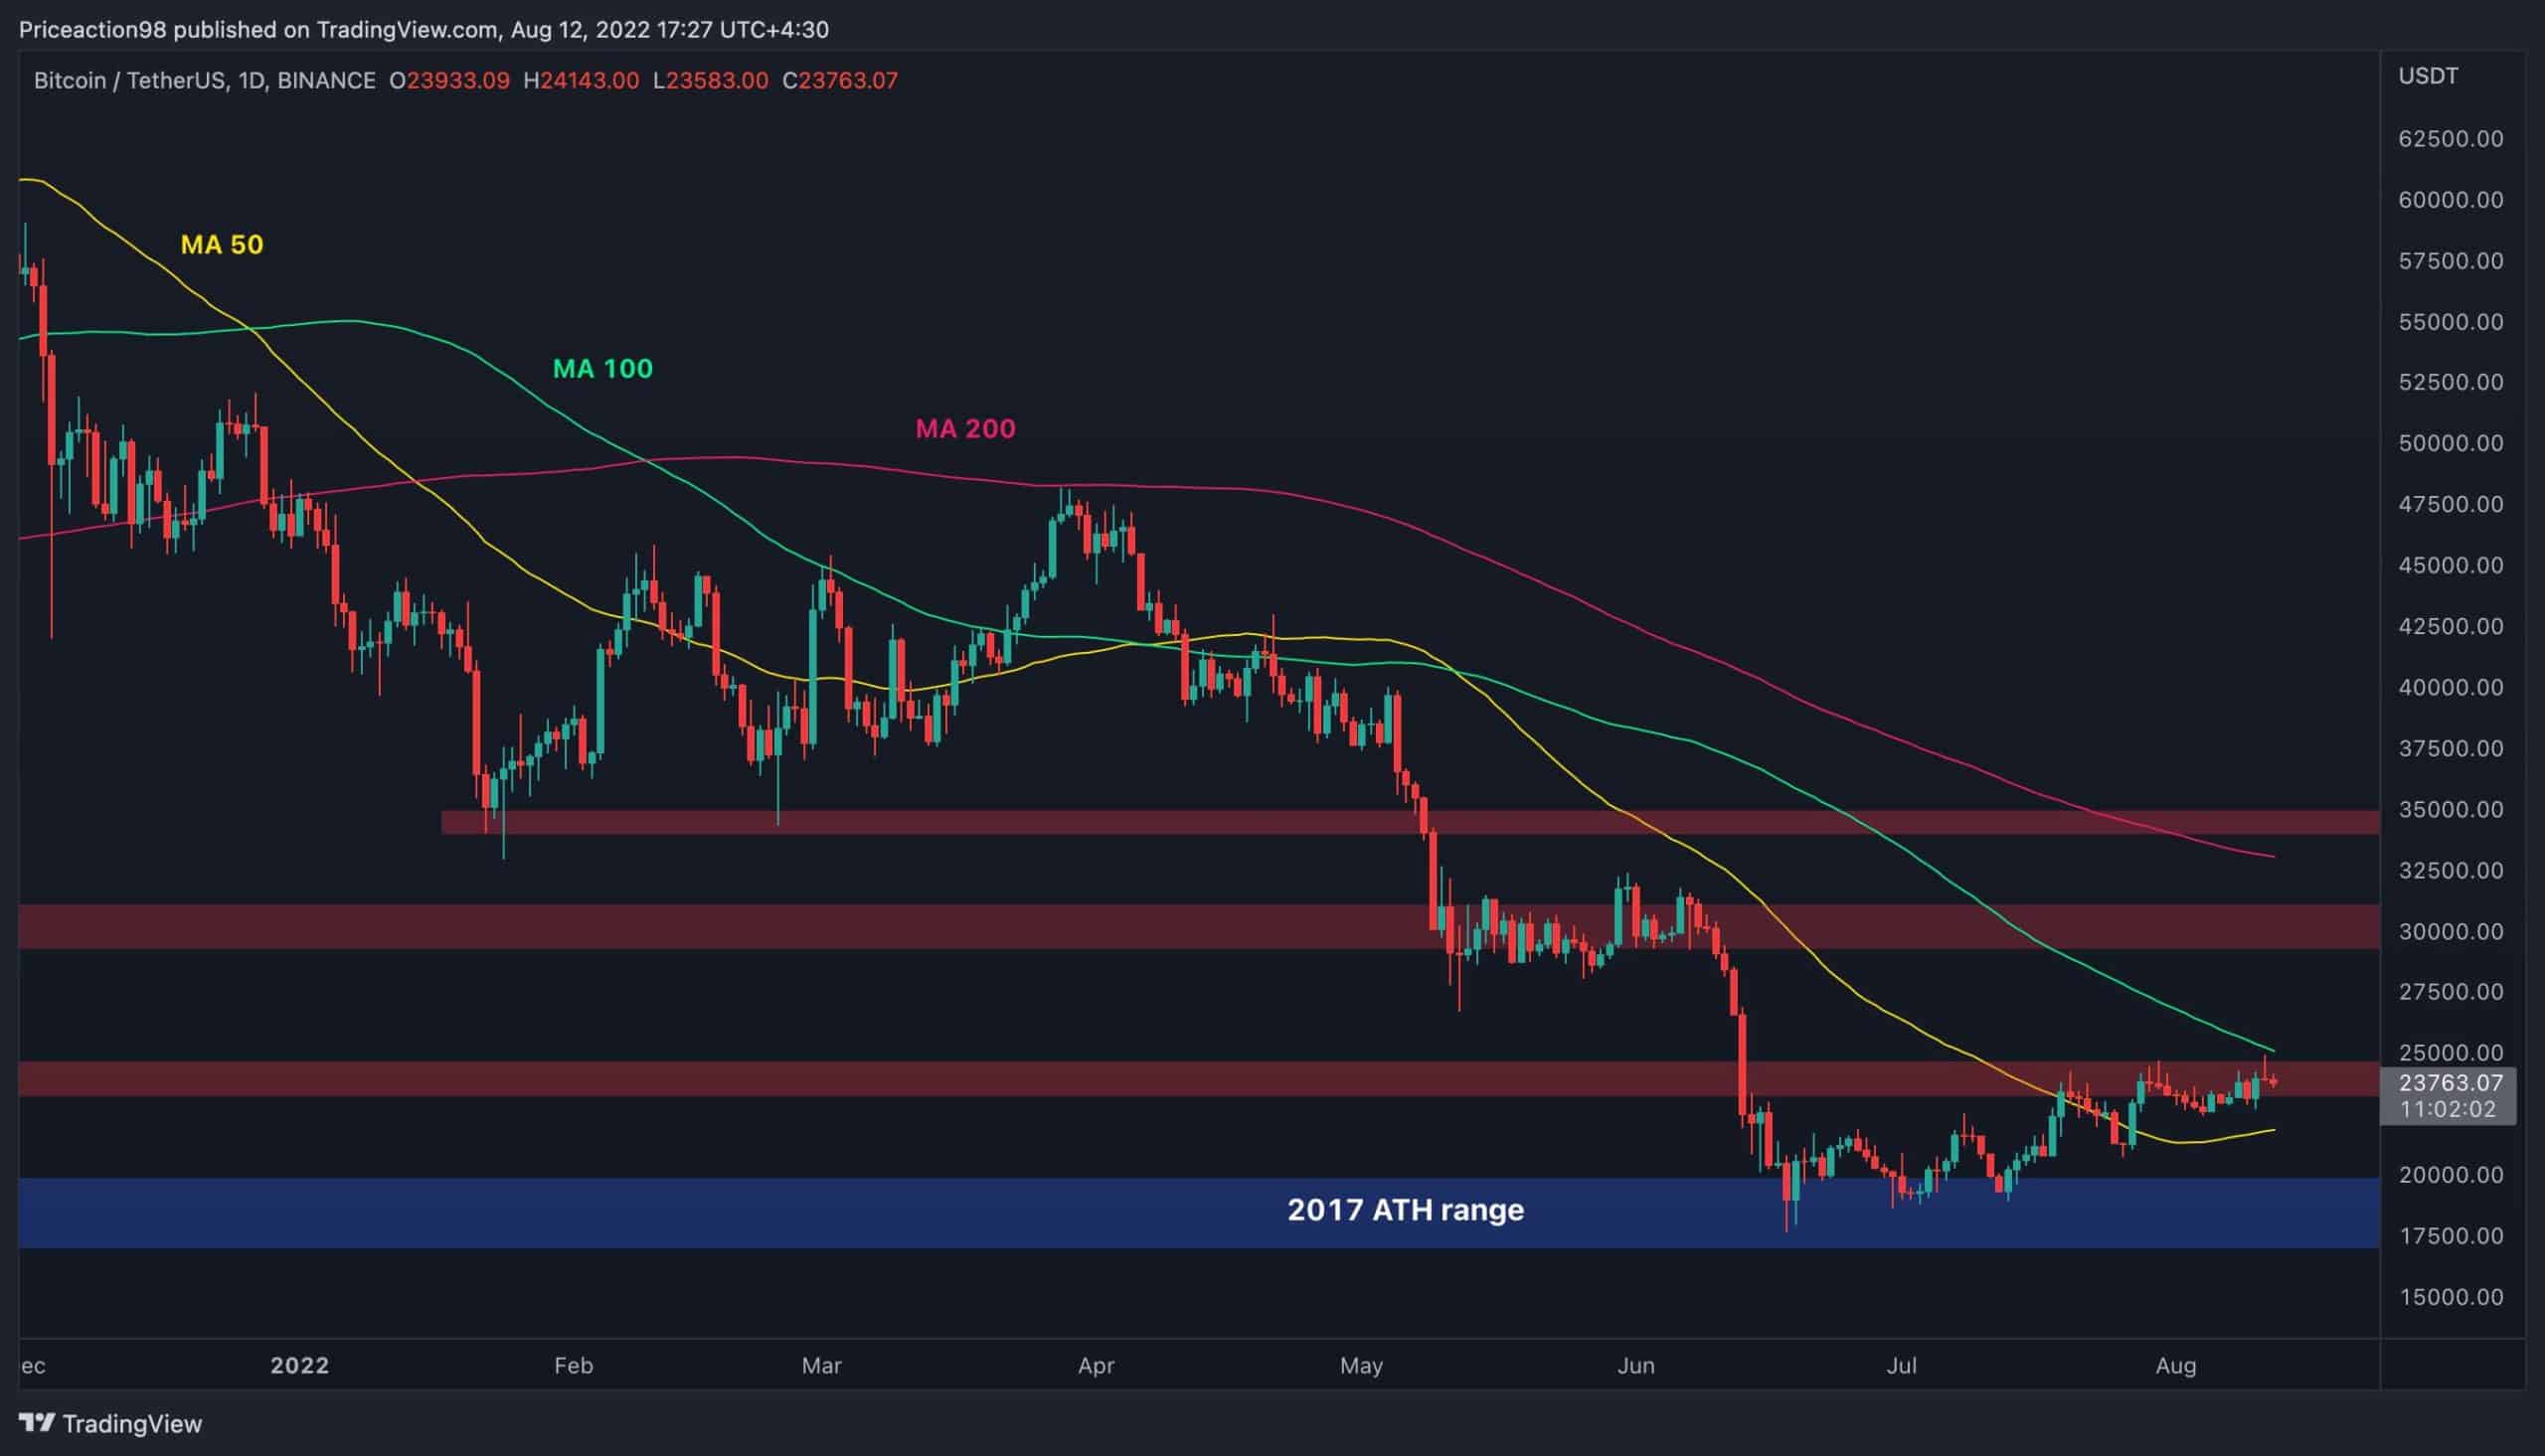
The Daily Chart
As of this writing, Bitcoin has yet to break above the $24K resistance level. The 100-day moving average has reached the $24K range and is creating further resistance. In case of a short-term bearish pullback, the 50-day moving average – which currently sits around the $22K level – would be the first support. If the price breaks below the MA, bearish momentum would likely return. Thus, a downtrend continuation below the $20K support area is probable.
On the other hand, if the price finally breaks above the $24K level and the 100-day moving average, a quick rally towards the $30K support zone would be expected.
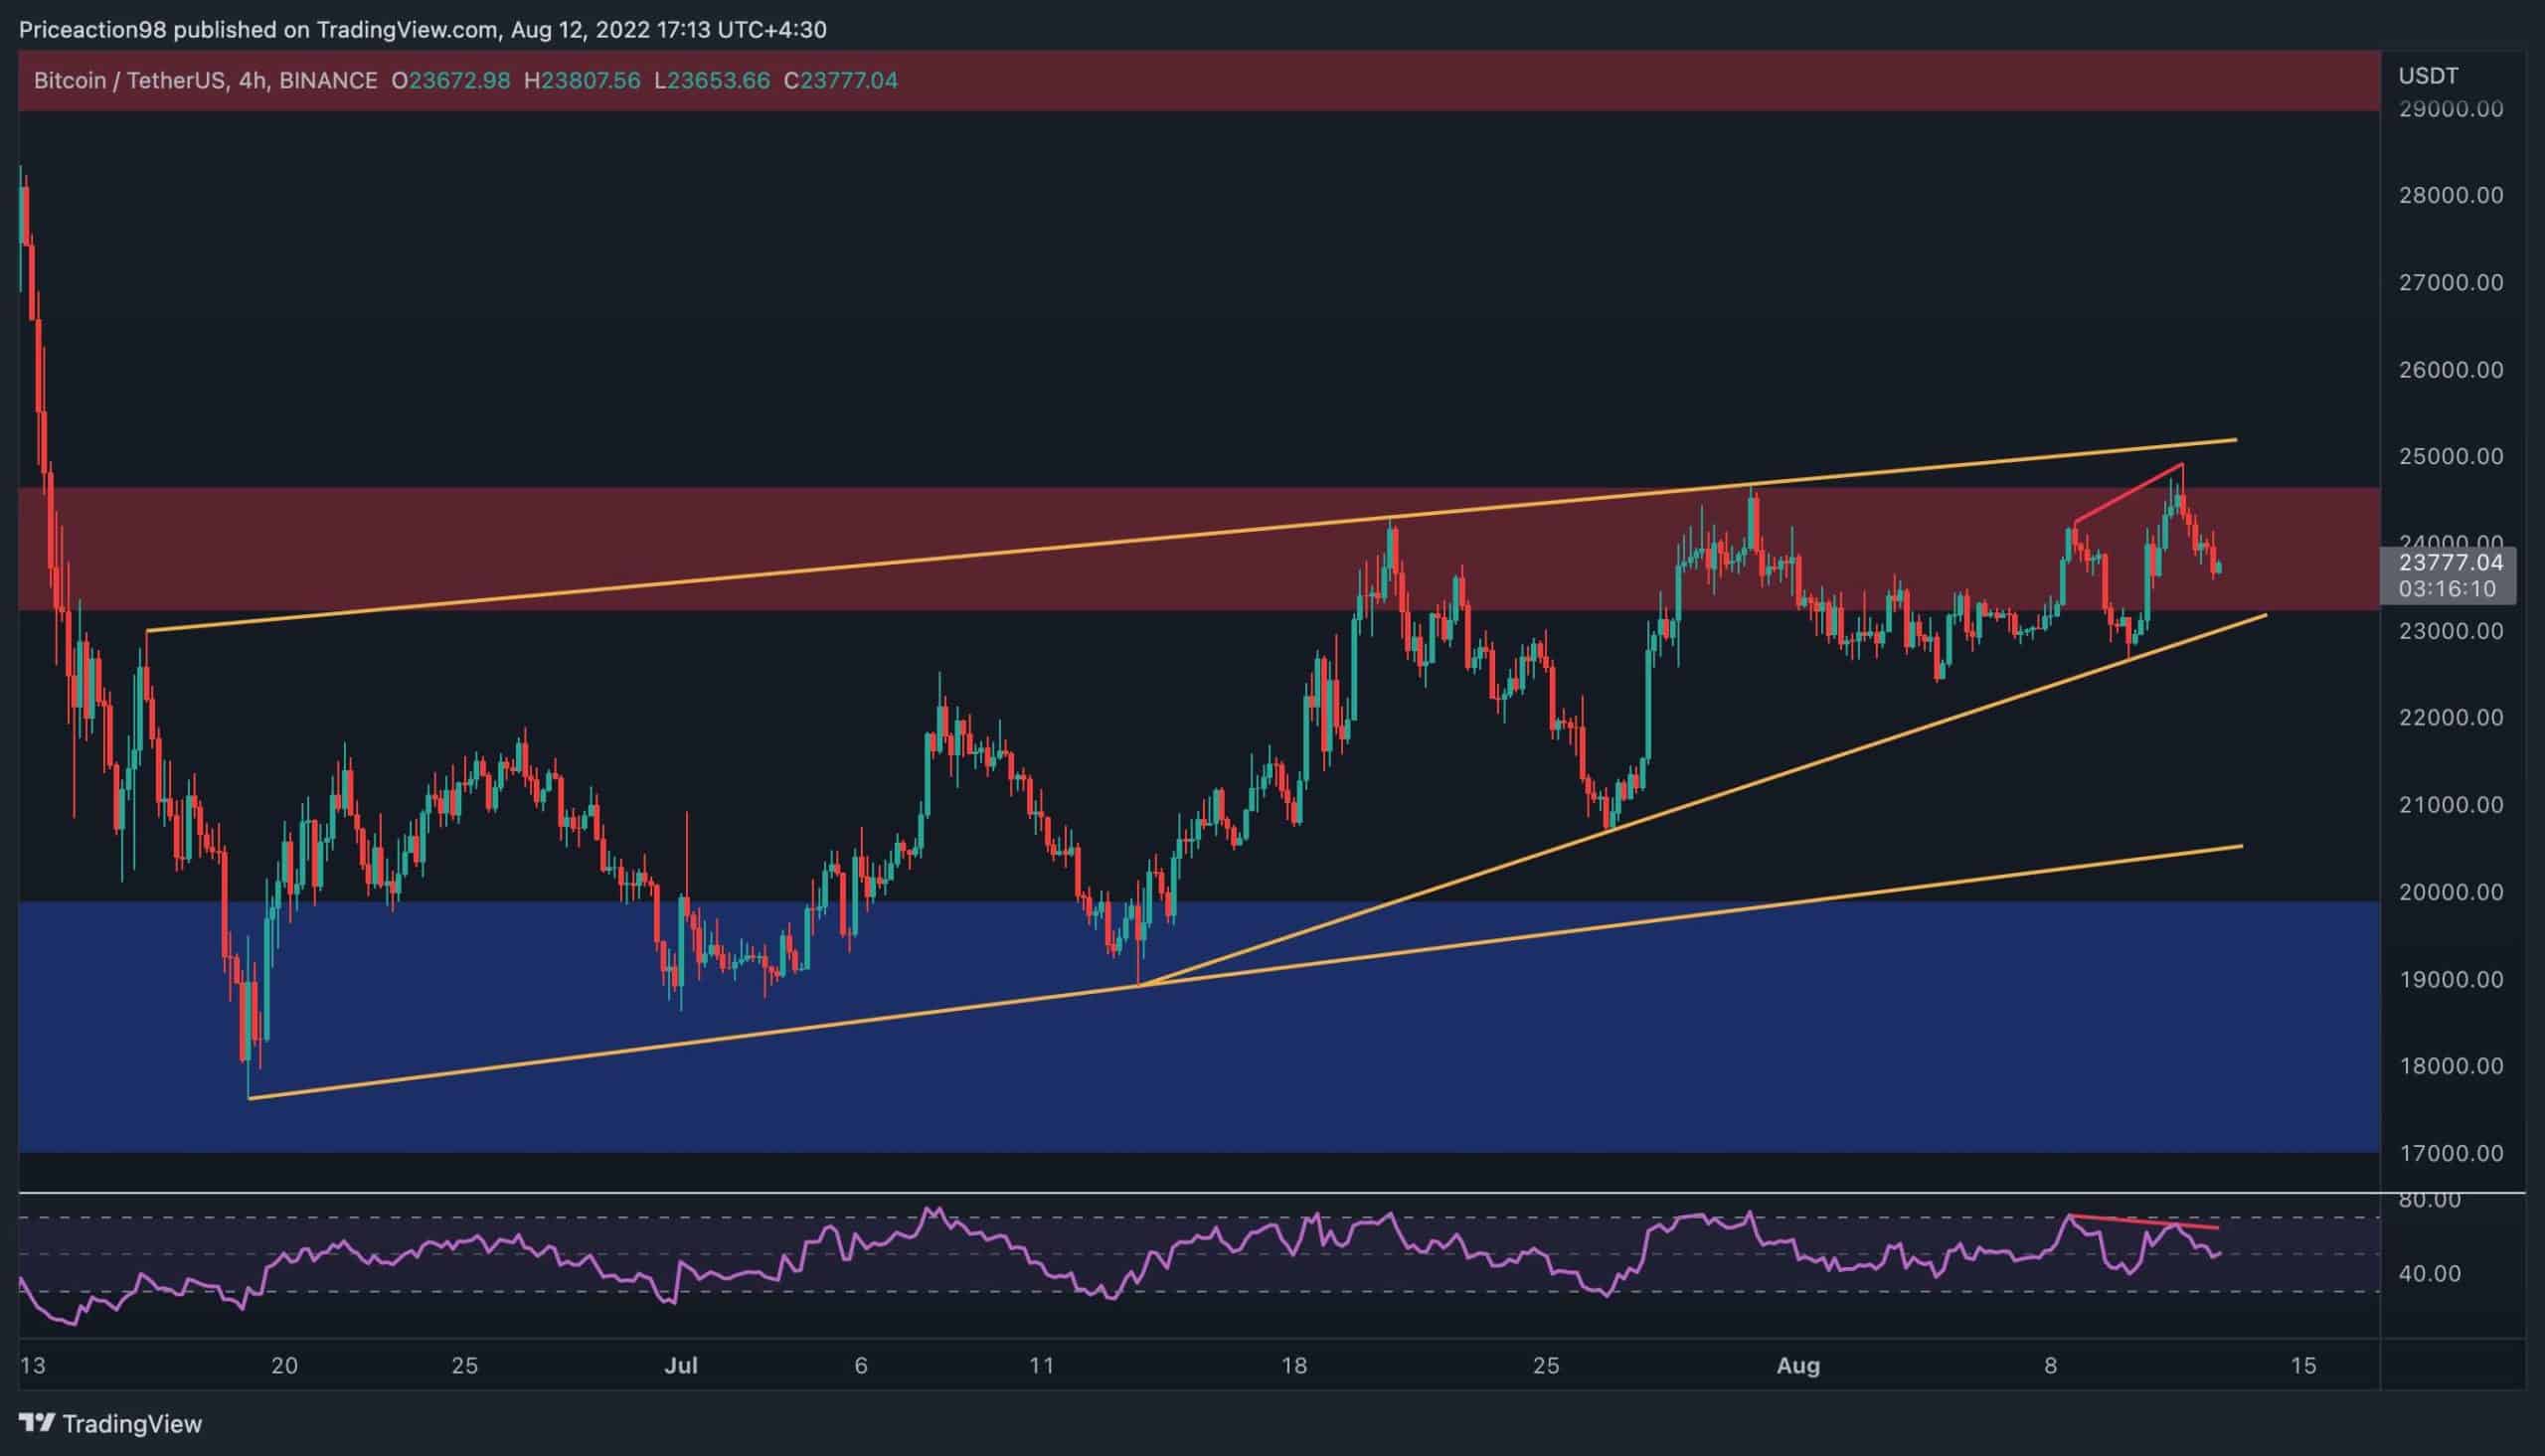
The 4-Hour Chart
The price has reached the higher boundary of the large bearish flag but has been rejected once again. The higher lows formed over recent weeks have resulted in a bullish trendline and could provide support in the short term. However, the RSI oscillator has printed a bearish divergence signal which points to a potential breakdown of the mentioned bullish trendline.
In this case, a drop towards the lower boundary of the flag and even a bearish breakout and continuation below the $18K low would be the most likely scenario. This is a continuation pattern that gets validated after a breakout and could lead to another bearish impulsive move.
It must be noted, however, that if the price breaks above the flag in the coming days, the bearish continuation scenario would not be ruled out completely, but it does seem less likely to occur.
Onchain Analysis
By Shayan
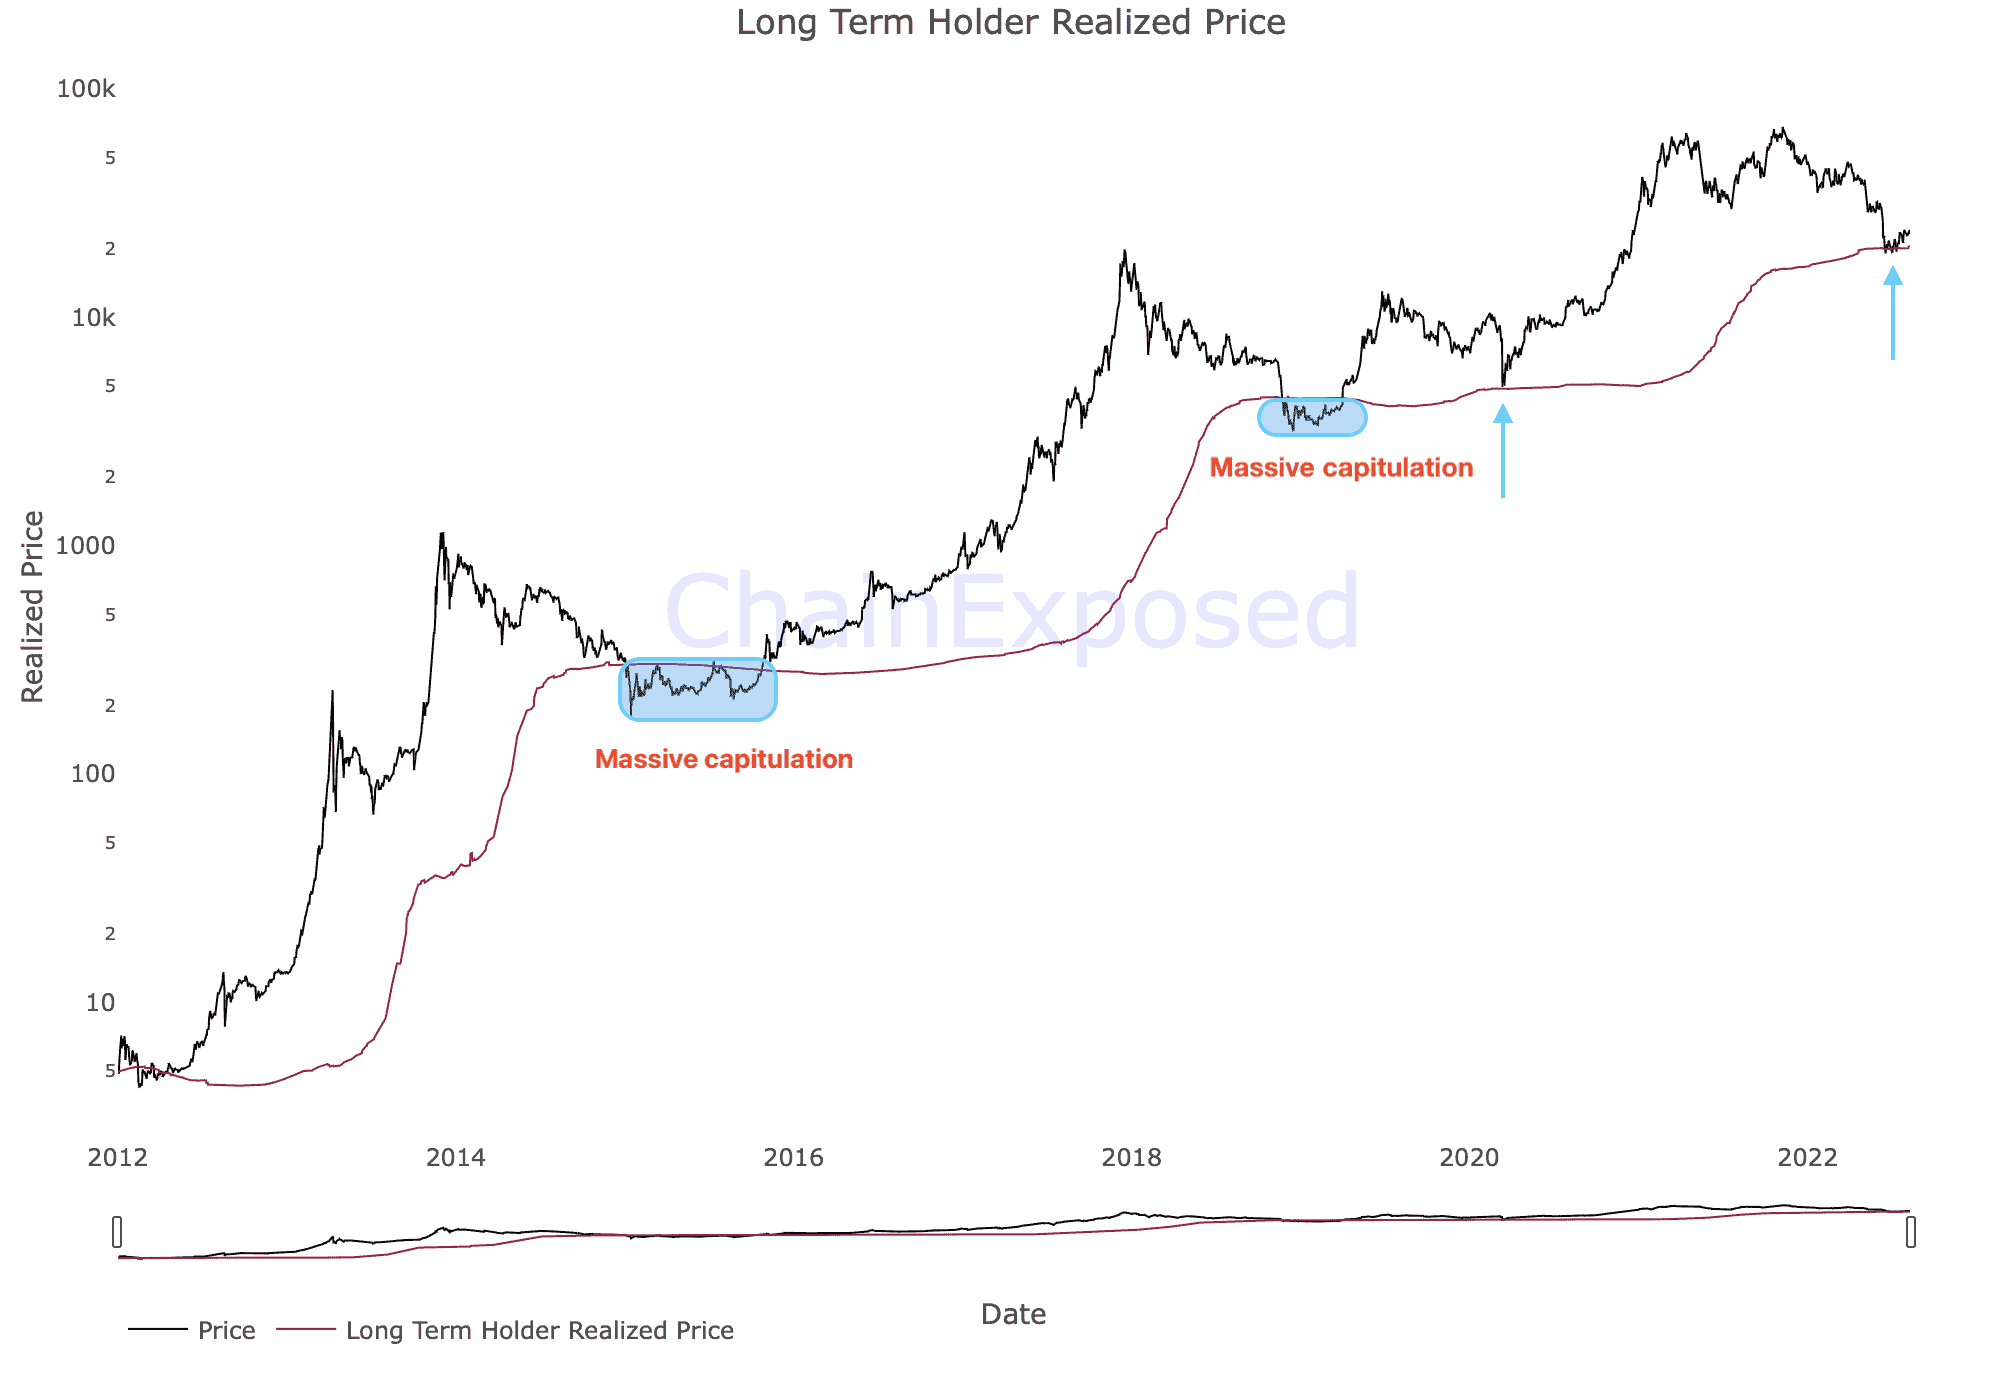
The following chart illustrates Bitcoin’s Long Term Holder Realized Price alongside its price. It measures the average price weighted by the supply of what the long-term holders spent on their coins. It is diagnosed as the on-chain support or resistance level.
Historically, a bear market’s bottom is usually formed as the market suffers extreme fear. All market participants enter a capitulation stage, and the weaker hands tend to realize immense losses. However, the whales and long-term holders are usually the last cohorts to capitulate. This stage would be a proxy for the final phase of the bearish cycle.
Bitcoin’s price has surpassed the LTH realized price for the third time in its existence. This implies that the long-term holders are now in an aggregate loss. Although, it has bounced back above the crucial level and is beginning to recover. The next bull market will be initiated if the level successfully supports the price.