Today, BTC went through some massive volatility. Accordingly, the trading volume on Binance increased exponentially. The price is struggling to hold above the K level, and the potential for further correction is causing fear across the market. Technical Analysis By Grizzly The Daily Chart: On the daily chart, Bitcoin is trading slightly above K, one of the lowest levels since the market crash in June. Throughout this period, this crucial level (in yellow) has been significant support, preventing Bitcoin from plunging further. The 14-day Relative Strength Index (RSI) is close to its diagonal support line (in white). If the downward price action continues and the pair closes below .6K, the way to the next support at K appears to be clear. This corresponds with
Topics:
CryptoVizArt considers the following as important: Bitcoin (BTC) Price, BTC Analysis, BTCEUR, BTCGBP, btcusd, btcusdt
This could be interesting, too:
Chayanika Deka writes XRP, SOL, and ADA Inclusion in US Crypto Reserve Pushes Traders on Edge
Chayanika Deka writes Why Arthur Hayes Is Bullish on Bitcoin Under Trump’s Economic Strategy
Mandy Williams writes Why the Bitcoin Market Is Stuck—and the Key Metric That Could Change It: CryptoQuant CEO
Wayne Jones writes Metaplanet Acquires 156 BTC, Bringing Total Holdings to 2,391
Today, BTC went through some massive volatility. Accordingly, the trading volume on Binance increased exponentially. The price is struggling to hold above the $18K level, and the potential for further correction is causing fear across the market.
Technical Analysis
By Grizzly
The Daily Chart:
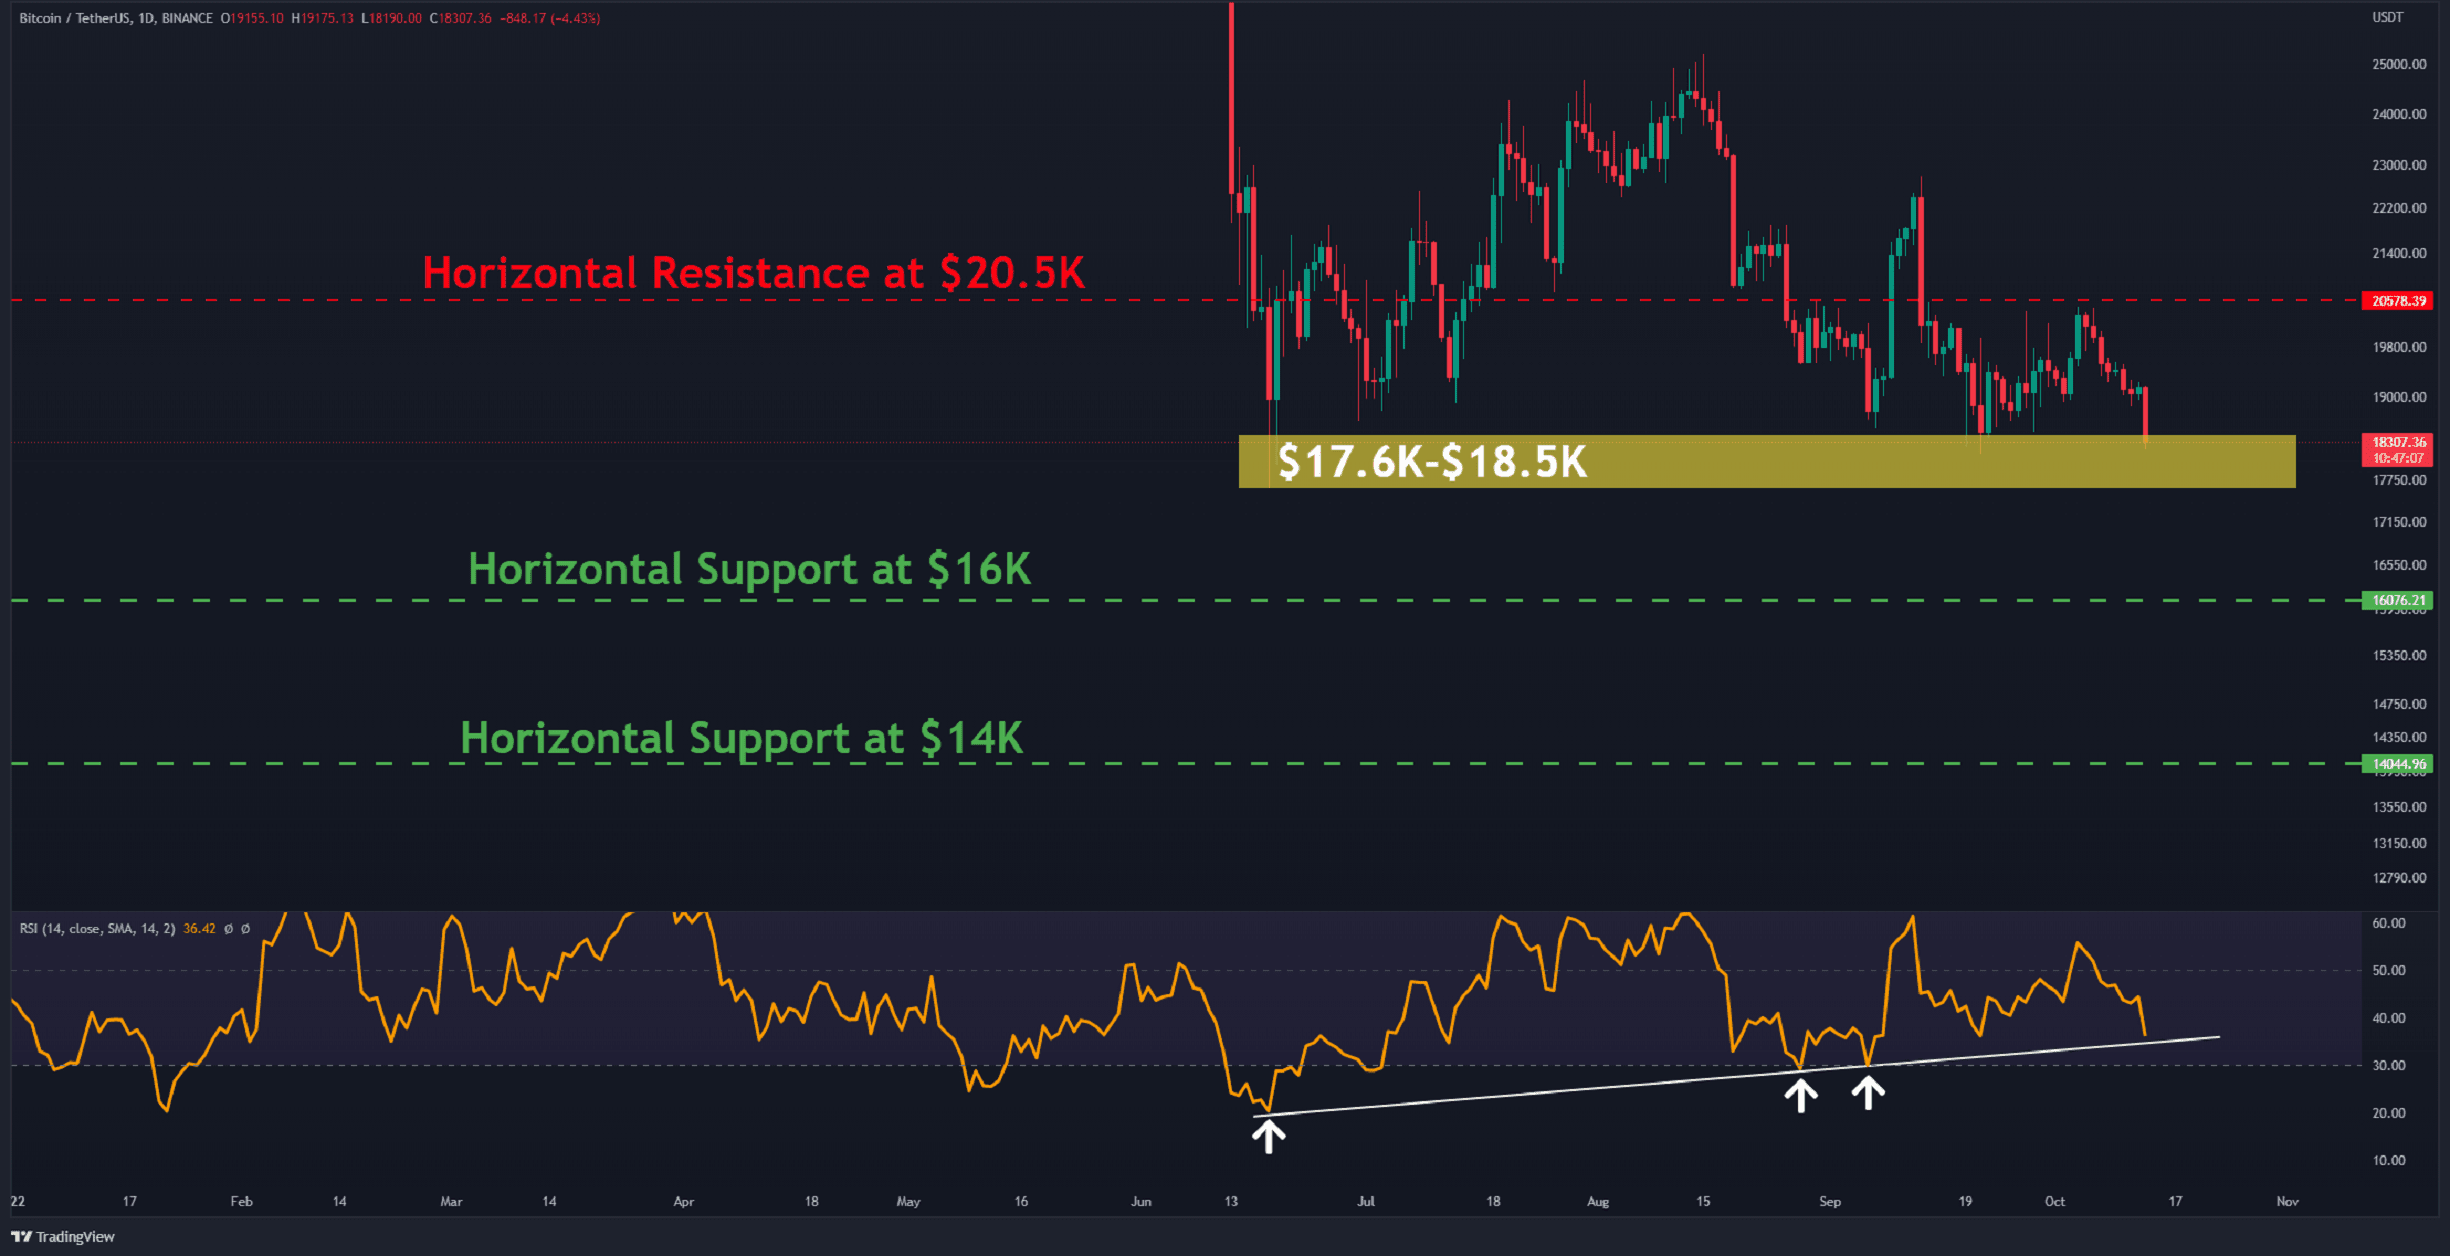
On the daily chart, Bitcoin is trading slightly above $18K, one of the lowest levels since the market crash in June. Throughout this period, this crucial level (in yellow) has been significant support, preventing Bitcoin from plunging further.
The 14-day Relative Strength Index (RSI) is close to its diagonal support line (in white). If the downward price action continues and the pair closes below $17.6K, the way to the next support at $16K appears to be clear. This corresponds with the RSI approaching the oversold zone below 30. In the worst-case scenario, the RSI may remain below 30 for an extended period of time, perhaps resulting in Bitcoin reaching $14K on the price chart.
Alternatively, if buyers push the price over $20.5K, the bullish sentiment will be back in the market in the short term.
Key Support Levels: $17.6K & $16K
Key Resistance Levels: $20.5K & $22.7K
Daily Moving Averages:
MA20: $19349
MA50: $19757
MA100: $21084
MA200: $26752
The 4-Hour Chart:
The pair is approaching the support of the descending line (in green) on the 4-hour chart, which is about $18K. Touching this support in prior downward waves has coincided with price movement toward the diagonal resistance. If history repeats again, the potential of reclaiming the $19K would be high. Otherwise, the daily support of around $17.6K is what most of the speculators have their eyes on.
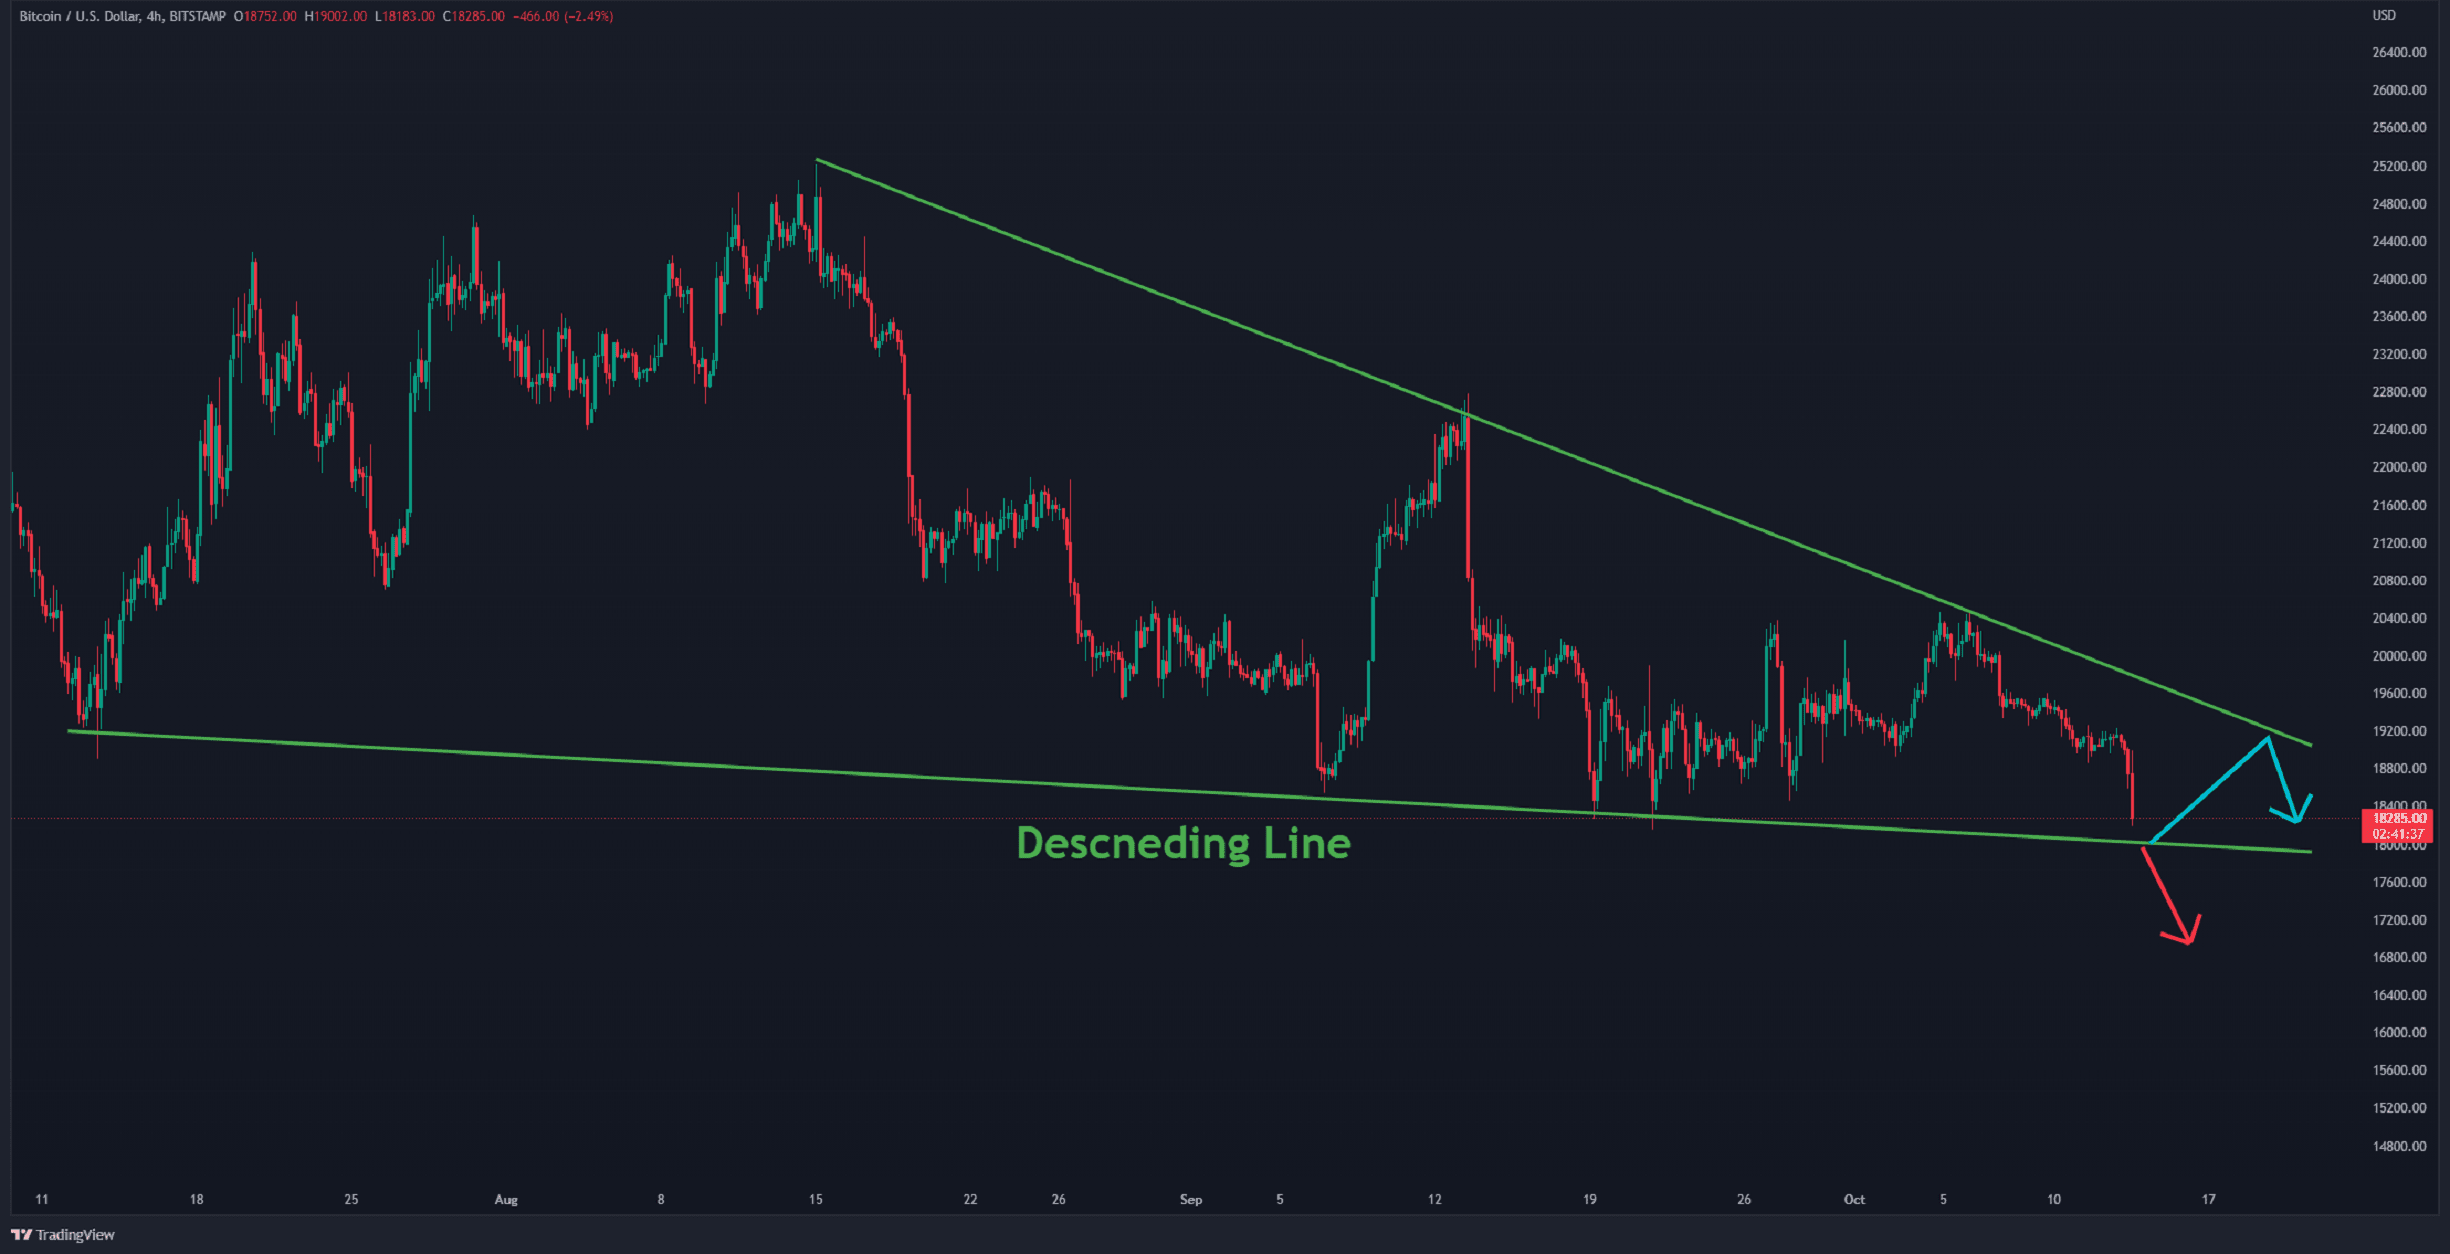
It should be highlighted that if the price closes over $19.6K in this timeframe, the hopes for bulls to enter the market will be revived.