Since January 2022, Bitcoin has been experiencing significant volatility. The following chart shows an evident supply zone at the -46K price area, marking it the range’s top and the main barrier for the BTC price to reach out for a possible retest of the -60K channel. On the other hand, a distinguished demand area at the -35K region marks this area as the lower consolidation boundary. The Daily Chart Technical Analysis by Shayan Currently, the price stabilizes above the K mark, which turned into the crucial short-term support level. Given the current state of global uncertainty and the existing fear in the market, there is a considerable possibility that bitcoin price will continue to consolidate between these two supply and demand zones, with substantial
Topics:
CryptoVizArt considers the following as important: Bitcoin (BTC) Price, BTC Analysis, BTCEUR, BTCGBP, btcusd, btcusdt
This could be interesting, too:
Chayanika Deka writes XRP, SOL, and ADA Inclusion in US Crypto Reserve Pushes Traders on Edge
Chayanika Deka writes Why Arthur Hayes Is Bullish on Bitcoin Under Trump’s Economic Strategy
Mandy Williams writes Why the Bitcoin Market Is Stuck—and the Key Metric That Could Change It: CryptoQuant CEO
Wayne Jones writes Metaplanet Acquires 156 BTC, Bringing Total Holdings to 2,391
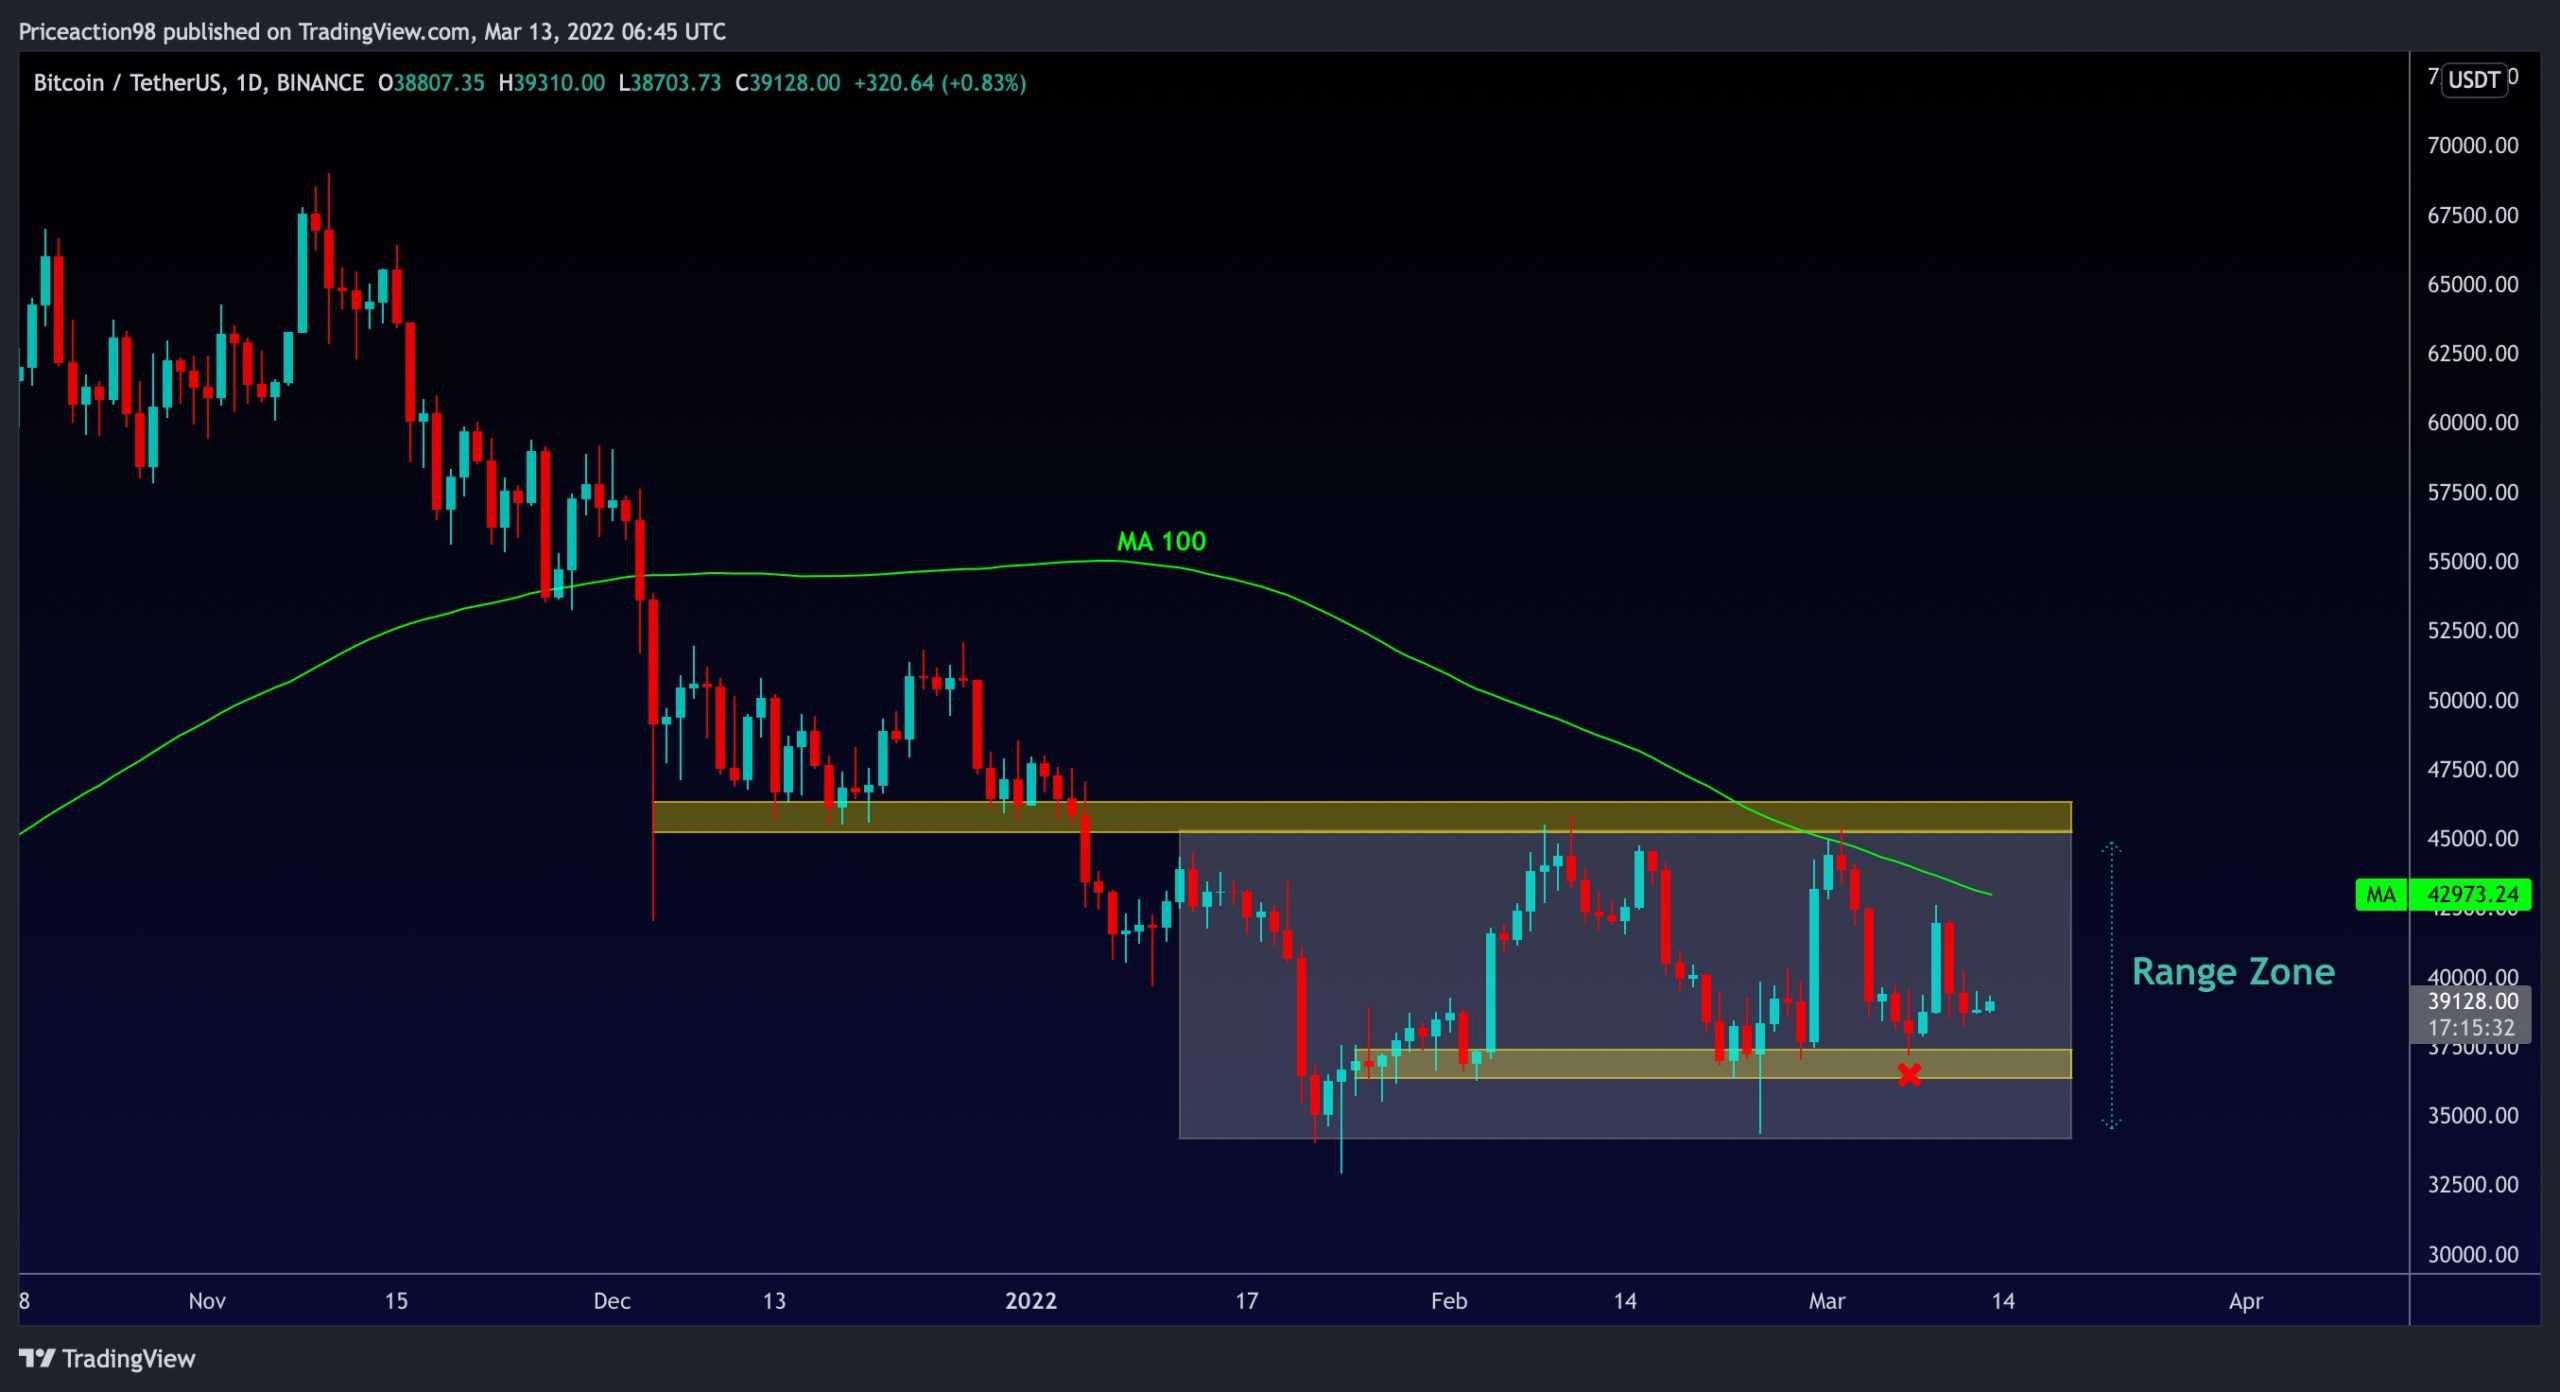
Since January 2022, Bitcoin has been experiencing significant volatility. The following chart shows an evident supply zone at the $45-46K price area, marking it the range’s top and the main barrier for the BTC price to reach out for a possible retest of the $50-60K channel.
On the other hand, a distinguished demand area at the $33-35K region marks this area as the lower consolidation boundary.
The Daily Chart
Technical Analysis by Shayan
Currently, the price stabilizes above the $37K mark, which turned into the crucial short-term support level. Given the current state of global uncertainty and the existing fear in the market, there is a considerable possibility that bitcoin price will continue to consolidate between these two supply and demand zones, with substantial volatility.
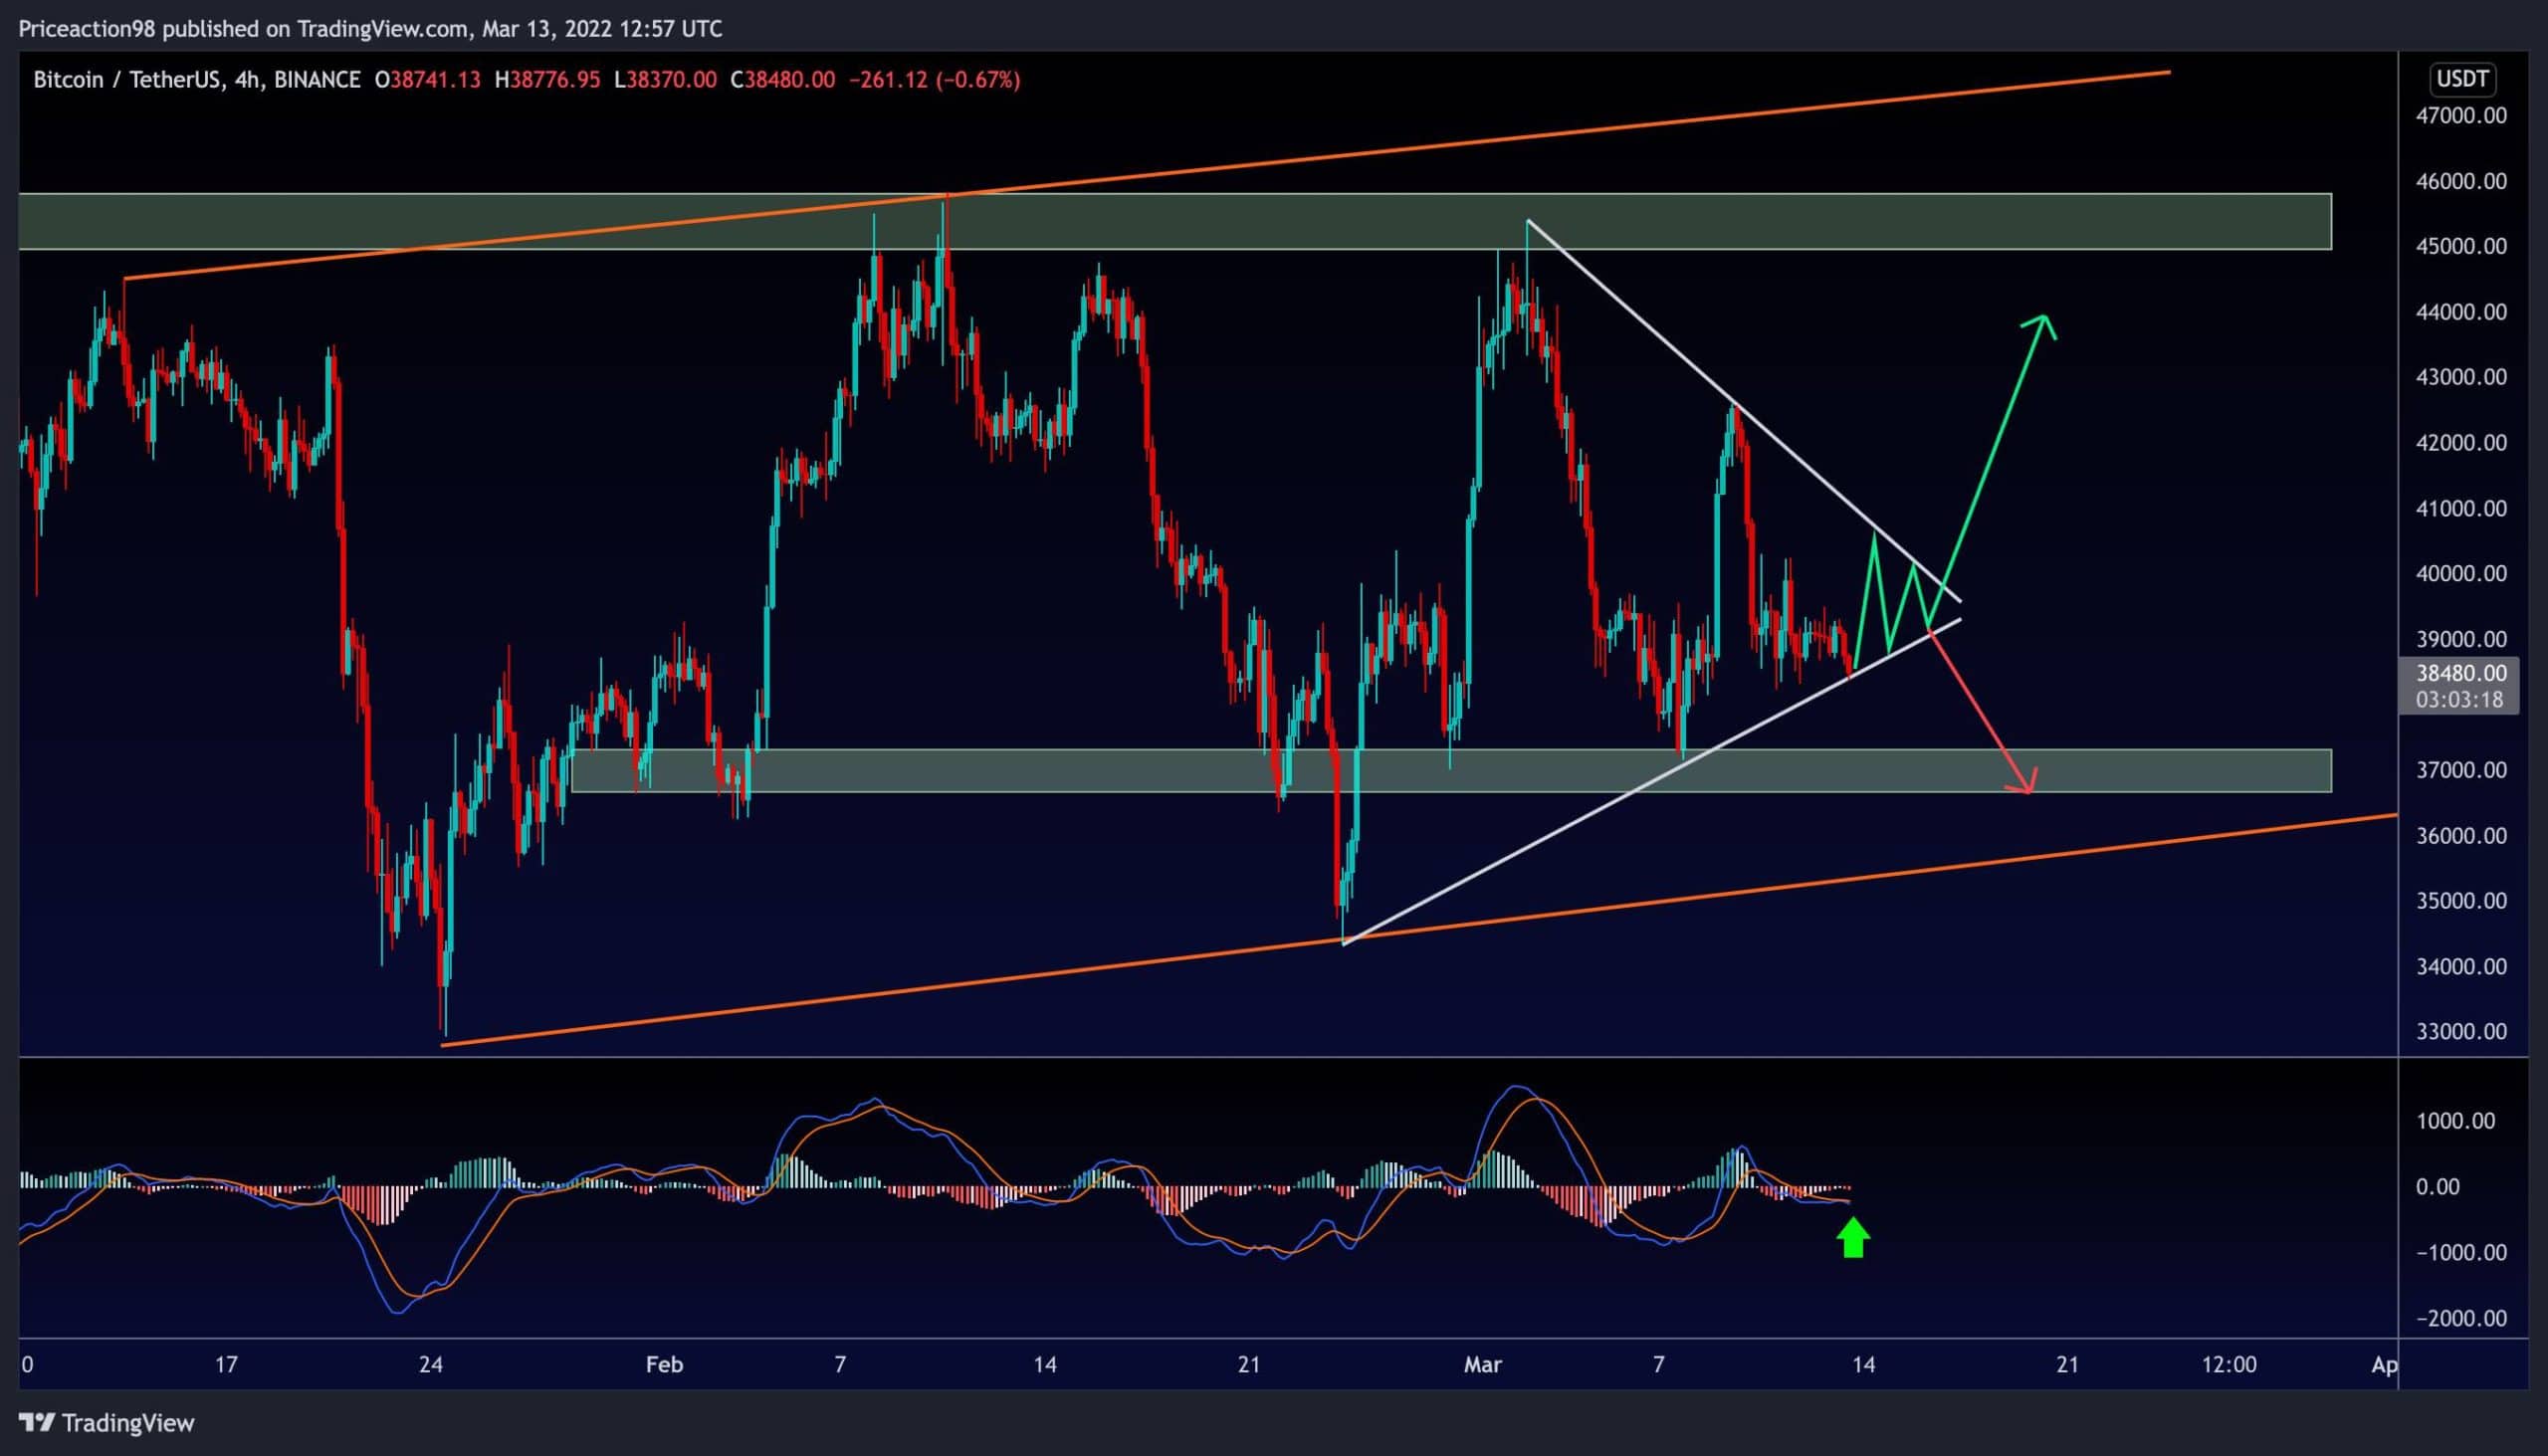
The 4-Hour Chart
On the shorter-term timeframe, the mentioned volatility is explicit. The recent price action indicates an equilibrium between the bears and the bulls at the moment.
As the chart shows, bitcoin moves inside a symmetrical triangle pattern. As the price approaches the apex, it will either break through the upper trendline for a bullish breakout or break below the lower trendline for a bearish continuation.
A break above/below a triangular pattern can be considered potential bullish/bearish signals, especially if followed by a high amount of volume. Hence, bitcoin will test the $37K support level soon if the lower trendline is broken.
Furthermore, the MACD indicator is about to turn positive, increasing the probability of an imminent bullish breakout.
Onchain Analysis
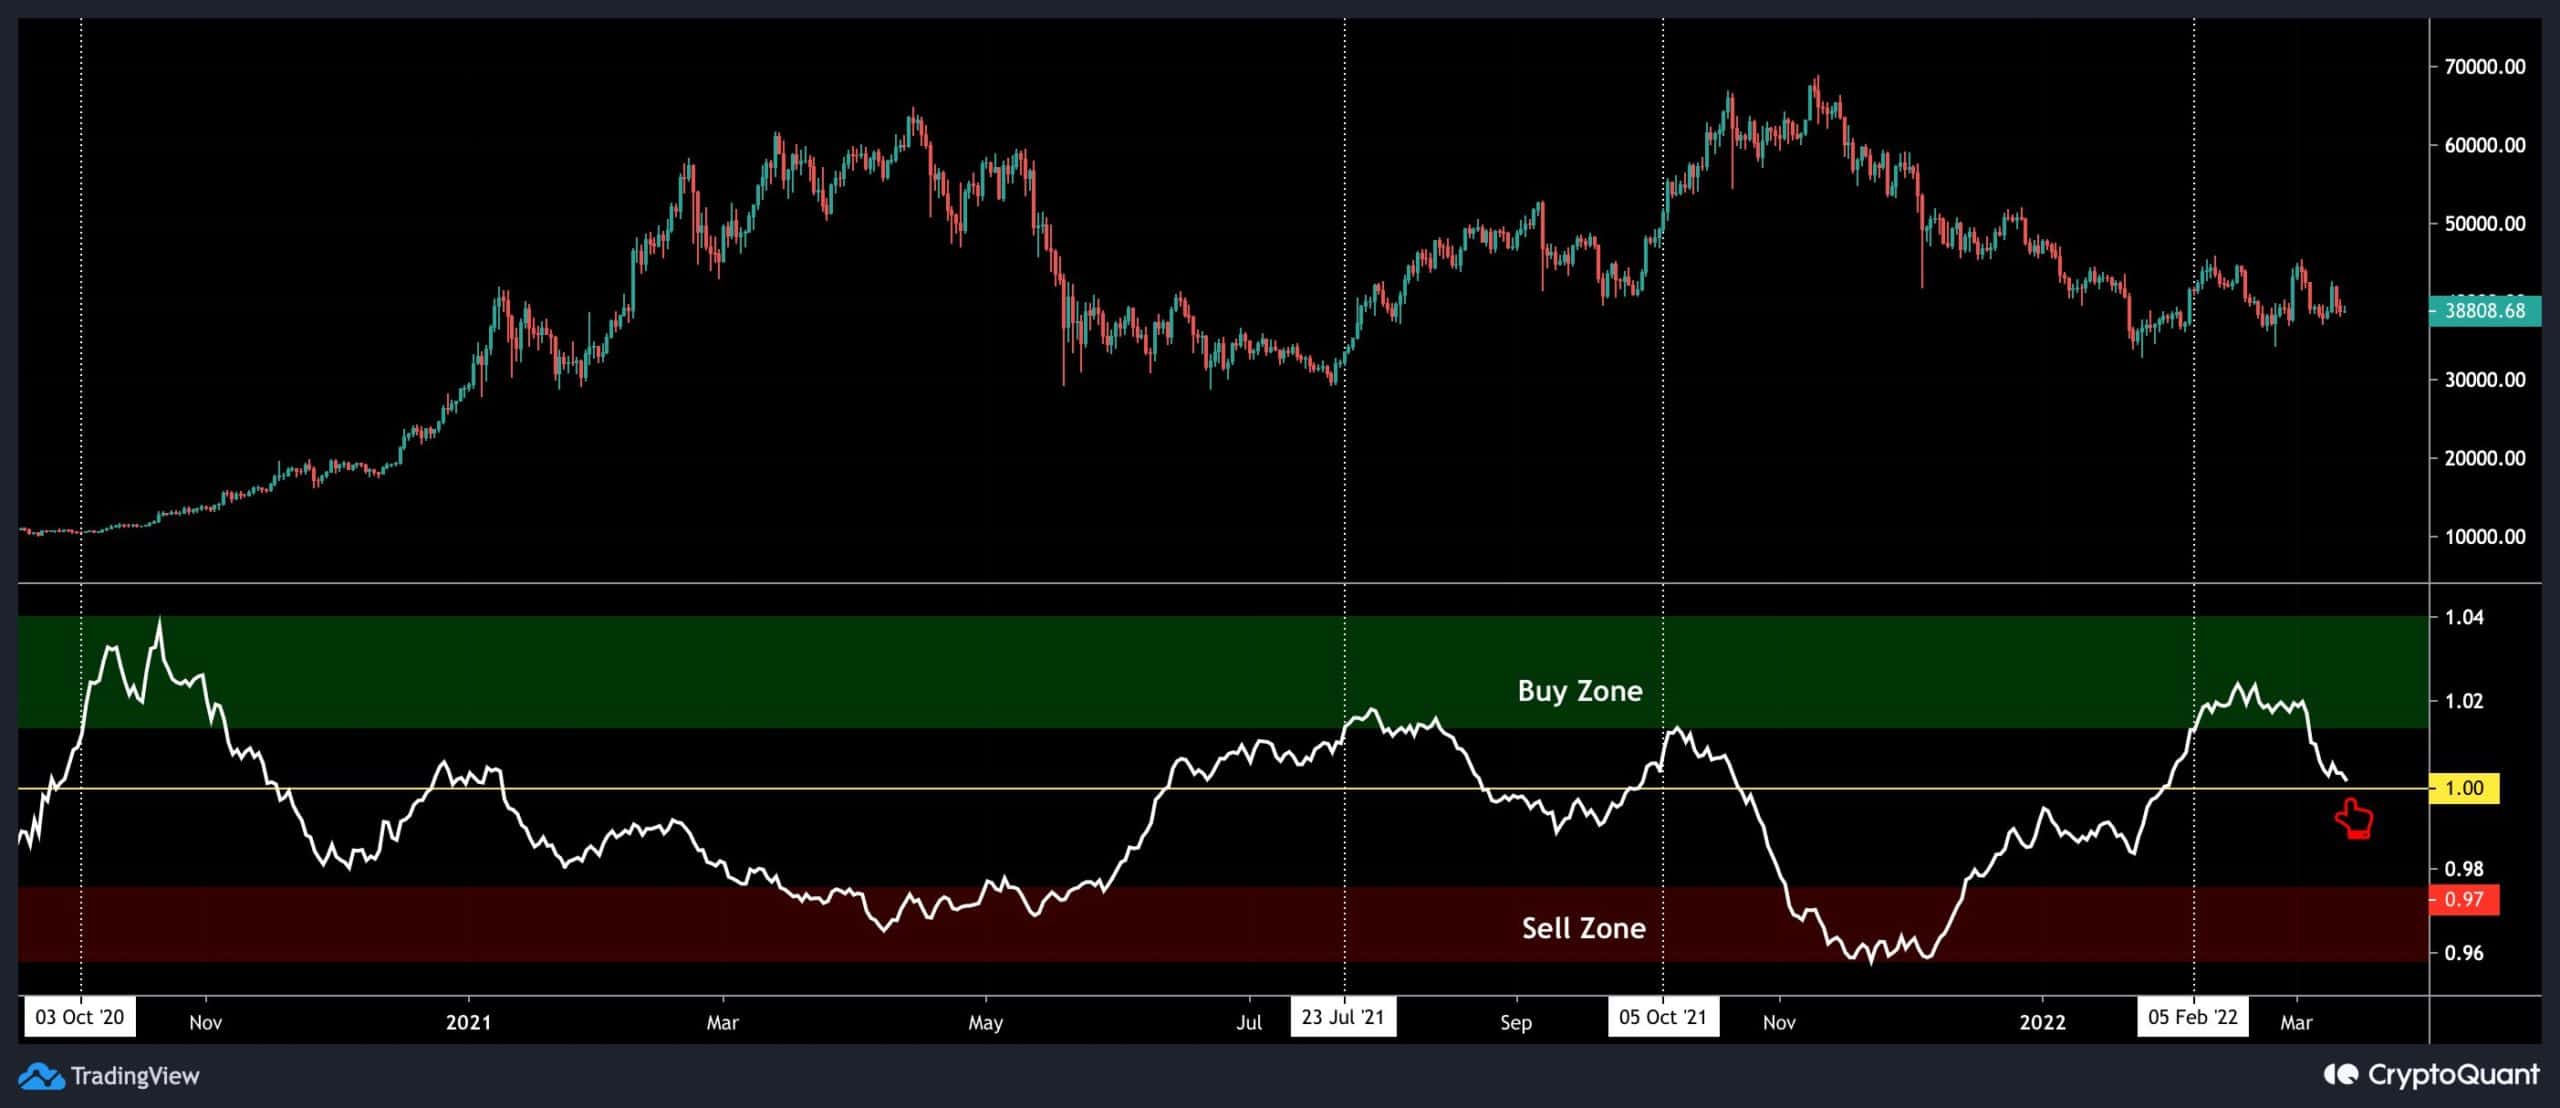
The Taker Buy Sell Ratio is represented on the following chart, indicating whether buyers or sellers are more aggressive in the order book. Values above 1 imply intense demand in the perpetual futures market, while values below 1 suggest selling pressure.
This indicator showed values above one throughout the recent swing from $33K to $46K, which could be construed as intense demand. However, the price has not been rising considerably this time, which might be a bearish indication. Furthermore, demand appears to be diminishing as this indicator is heading lower towards 1.