The market is currently attempting a recovery that might take the price up to K after being supported by the critical K level. However, there is significant resistance at around K. The bearish phase appears far from over as the substantial lack of demand in the market continues. Technical Analysis By Shayan The Daily Chart The descending multi-week trendline (currently at .5K) has been acting as significant resistance to the price for the past five months. Meanwhile, Bitcoin has seen some mild recovery and has reached the trendline for the fourth time. This particular level also aligns with the 50-day moving average (standing at .1K), which is a crucial resistance for the price. Considering the overlap between the 50-day moving average and the trendline, BTC
Topics:
CryptoVizArt considers the following as important: Bitcoin (BTC) Price, BTC Analysis, btcusd, btcusdt
This could be interesting, too:
Chayanika Deka writes XRP, SOL, and ADA Inclusion in US Crypto Reserve Pushes Traders on Edge
Chayanika Deka writes Why Arthur Hayes Is Bullish on Bitcoin Under Trump’s Economic Strategy
Mandy Williams writes Why the Bitcoin Market Is Stuck—and the Key Metric That Could Change It: CryptoQuant CEO
Wayne Jones writes Metaplanet Acquires 156 BTC, Bringing Total Holdings to 2,391
The market is currently attempting a recovery that might take the price up to $22K after being supported by the critical $18K level. However, there is significant resistance at around $20K. The bearish phase appears far from over as the substantial lack of demand in the market continues.
Technical Analysis
By Shayan
The Daily Chart
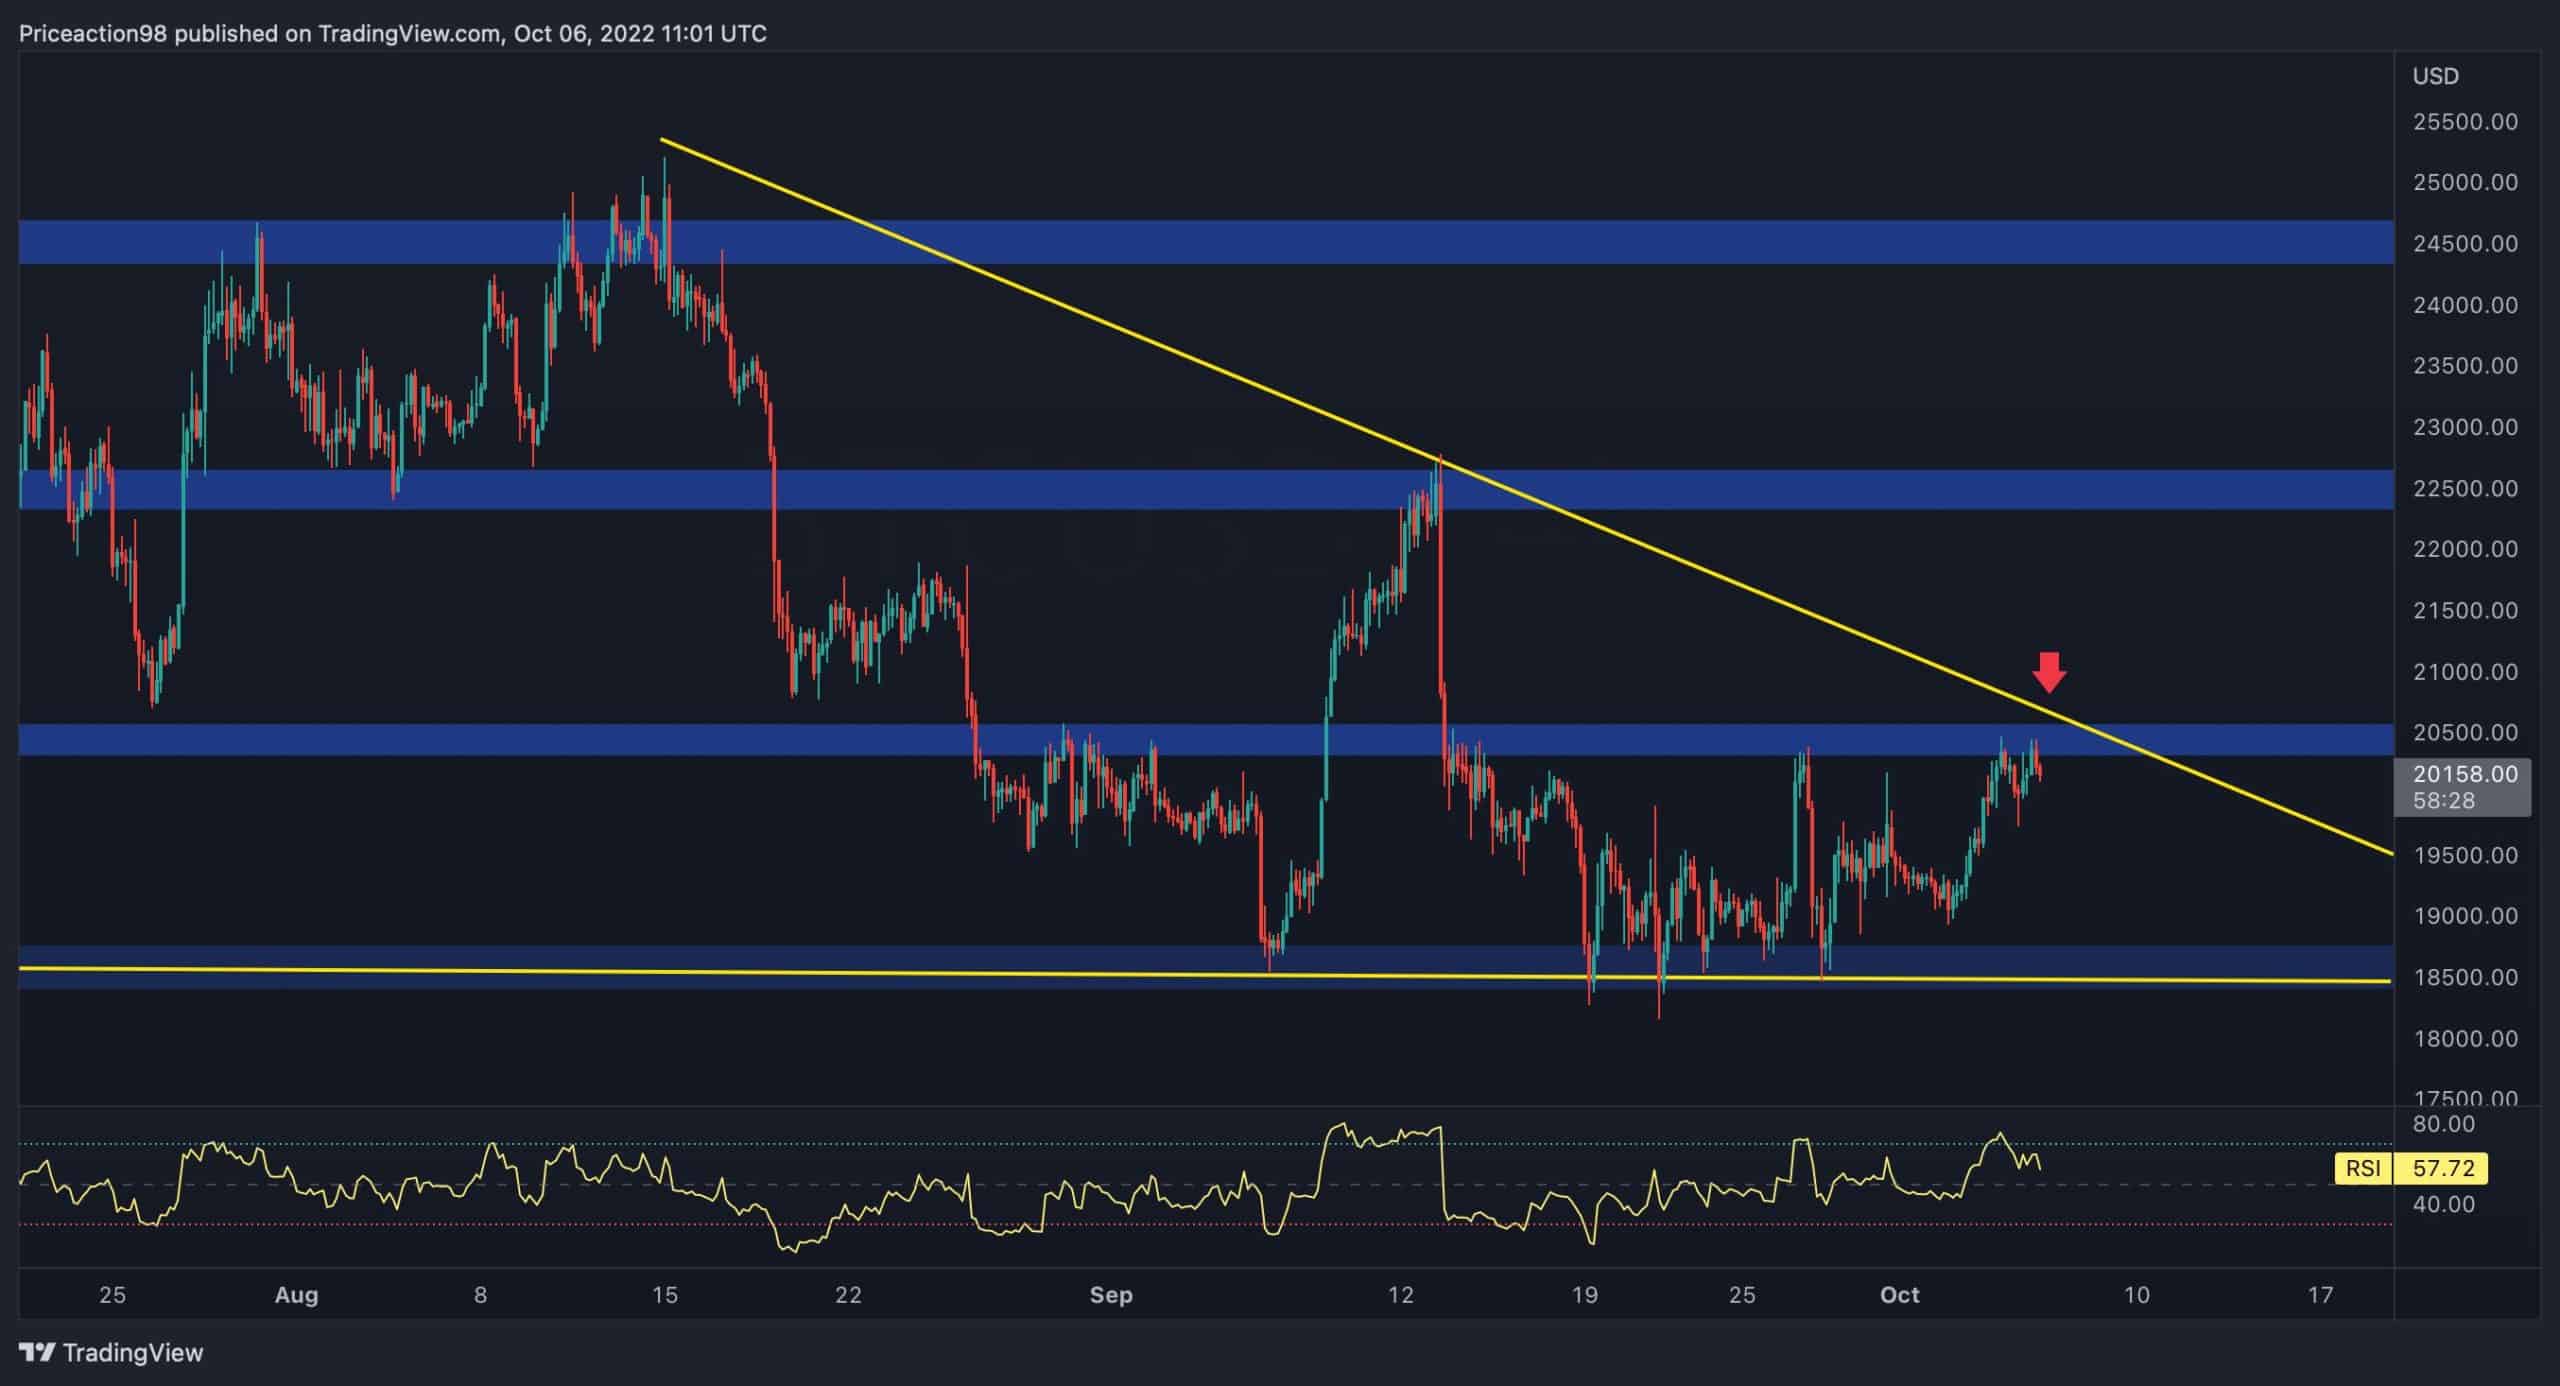
The descending multi-week trendline (currently at $20.5K) has been acting as significant resistance to the price for the past five months. Meanwhile, Bitcoin has seen some mild recovery and has reached the trendline for the fourth time. This particular level also aligns with the 50-day moving average (standing at $20.1K), which is a crucial resistance for the price.
Considering the overlap between the 50-day moving average and the trendline, BTC would face significant resistance at $21K. It must be breached in order to retest the $25K primary resistance level.
However, when reviewing the market sentiment and decreased momentum, the price seems more likely to get rejected from this crucial point and experience another drop.

The 4-Hour Chart
As stated, Bitcoin is trapped in a consolidation zone between the $18K support level and the substantial resistance at $25K. Meanwhile, the cryptocurrency has initiated a rally towards the descending wedge’s upper trendline.
However, Bitcoin is forming a potential double-top pattern, a well-known bearish pattern. If the neckline is broken, Bitcoin could experience a fall to the $18K level again. Considering the power of the $20K-$21K range and the formation of this double-top pattern, the price will likely fail to surpass the trendline and plunge towards lower price levels.
On-chain Analysis
By: Edris
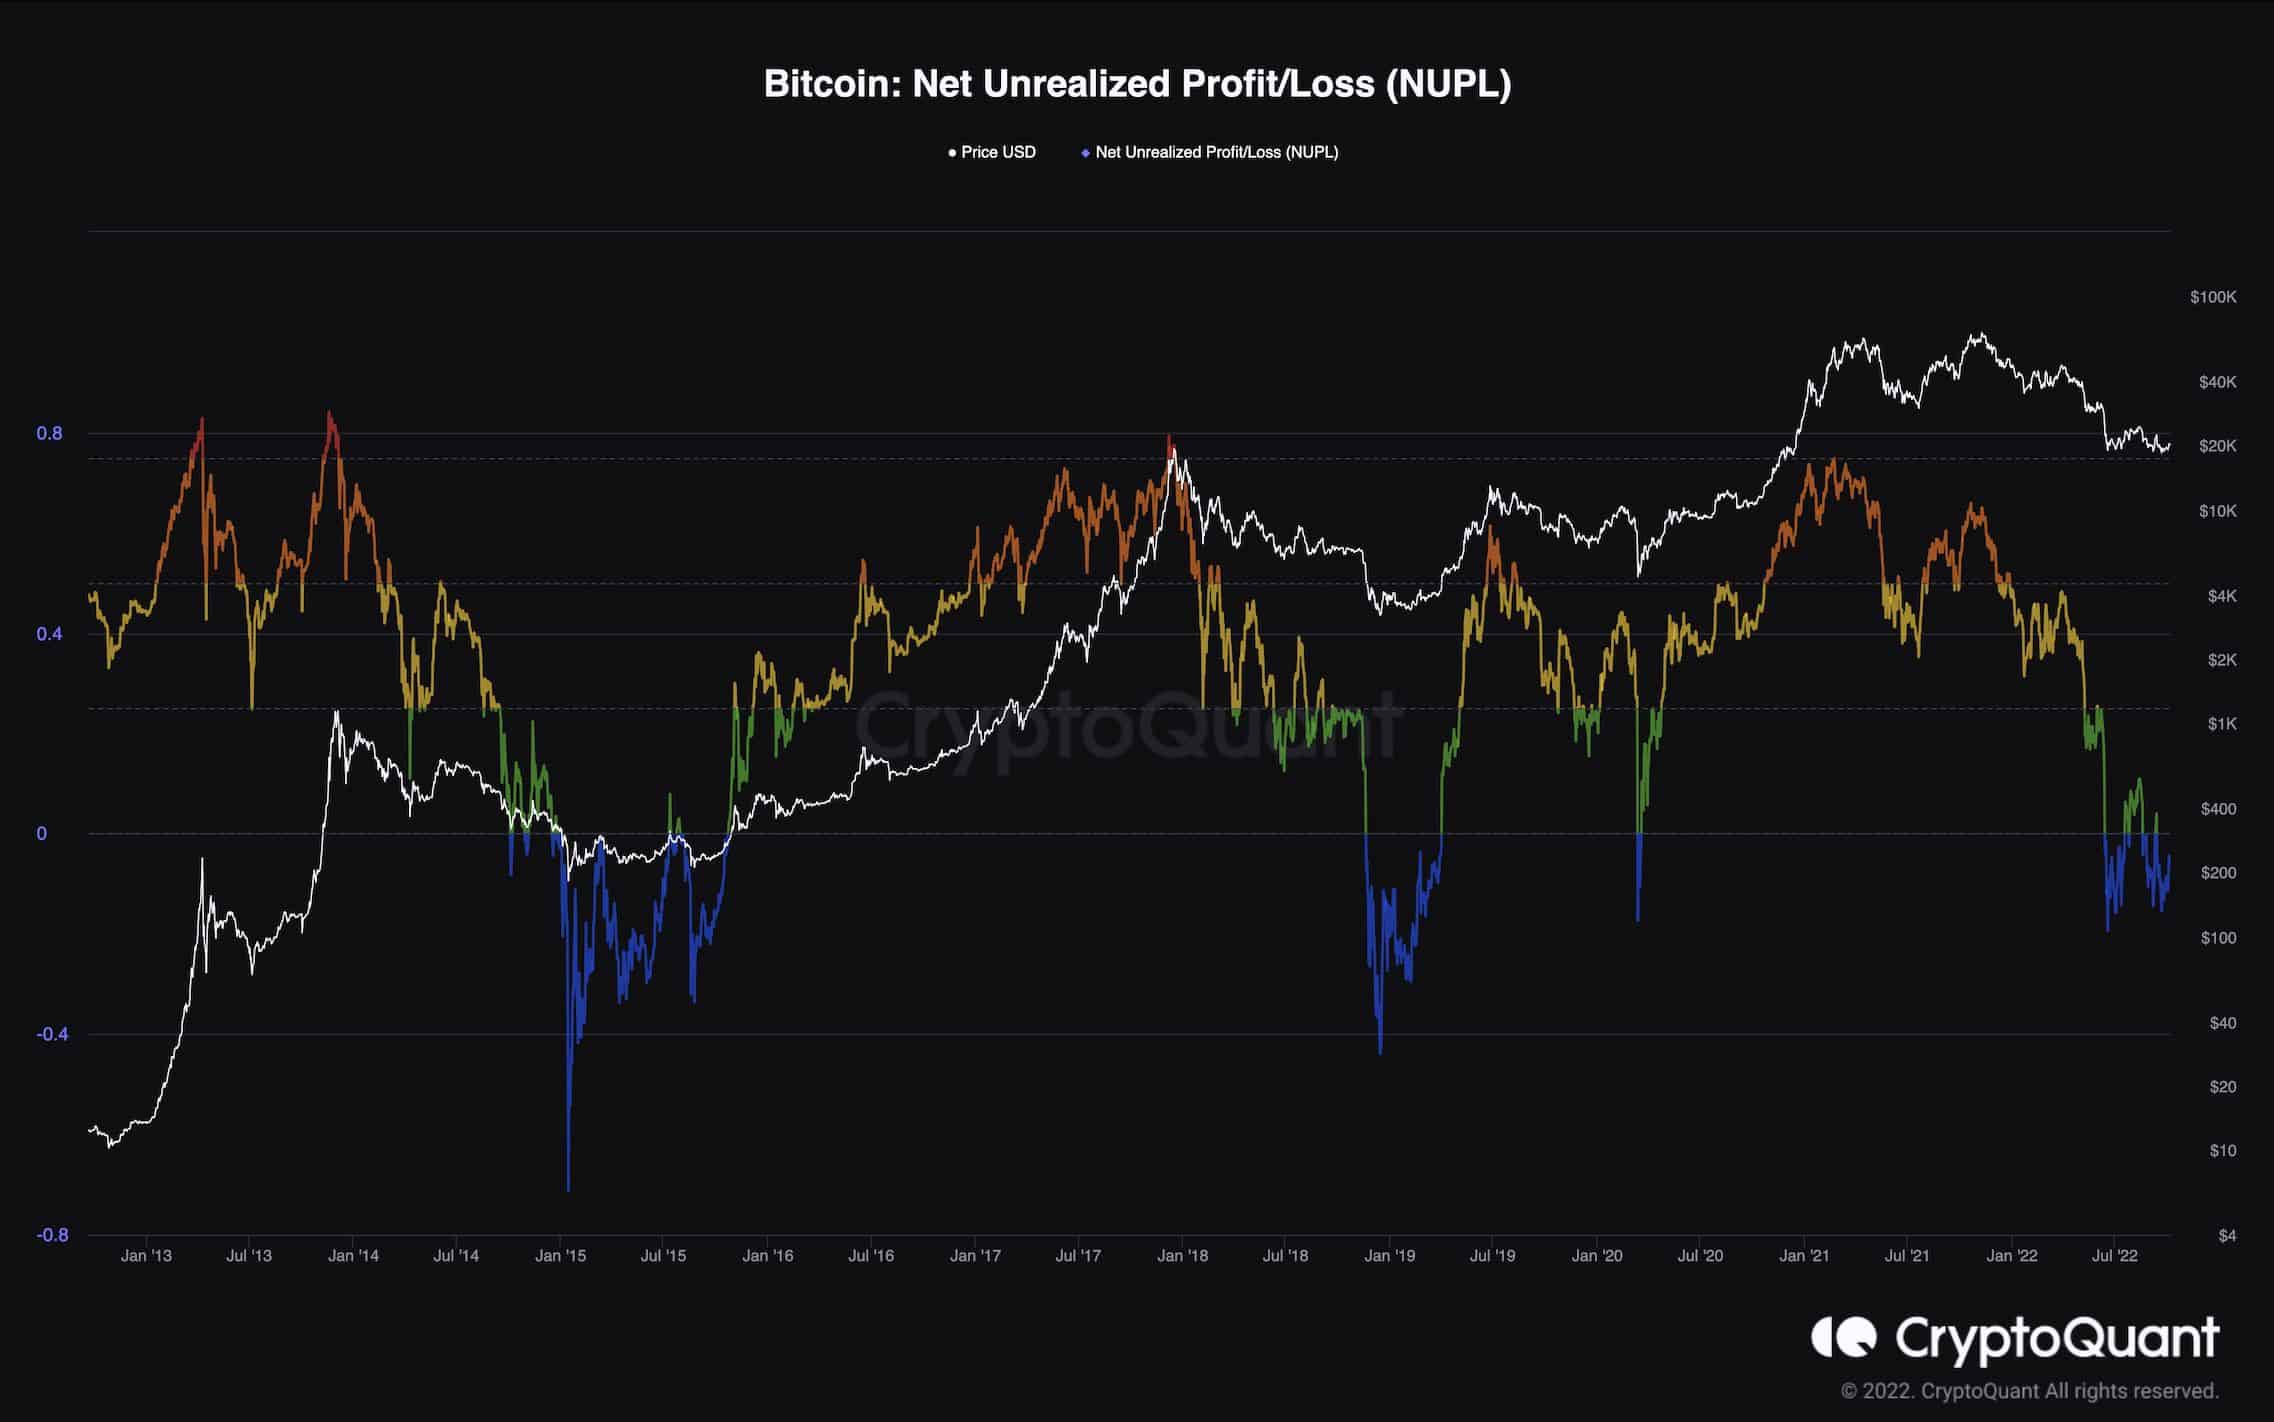
Bitcoin Net Unrealized Profit/Loss
Bitcoin’s gruesome downtrend is pushing more and more holders underwater, as a very large number of investors are still holding on to their coins at a loss.
This psychological and financial pressure could force many hands to sell their assets at these low prices in order to prevent harsher losses. This would create an ideal scenario for smart money to accumulate Bitcoin at cheap prices and in large amounts. That is the reason bear market bottoms form, where the majority of the market participants are at a loss.
The NUPL metric is one of the key indicators to evaluate the unrealized profits and losses of the investors and could be useful to determine the potential price range for the bottom to form. According to the chart, NUPL is currently in a zone where previous bear market bottoms formed.
The price could still drop deeper, but the NUPL metric is suggesting that the bottom could be close.