The technical indicators are showing weakness in the short term. The onchian activity of retailers as a reaction to volatile market is still rising. This can be translated to the high probability of a side chopping market in the mid-term. In a low trade volume phase, such as the current market condition, capitulation events are expected more than ever. Technical Analysis By: Grizzley Long-Term: On the daily timeframe, the recent uptrend was stopped by touching the low band of Bollinger Bands (BB) and a long candlestick was formed. Although the RSI indicator broke above its downtrend line, the safer strategy would be to wait for the price crossing BB baseline. Then market participants can be confident that the buyer’s side is more powerful in the order book. Source:
Topics:
CryptoVizArt considers the following as important: Bitcoin (BTC) Price, BTC Analysis, BTCEUR, BTCGBP, btcusd, btcusdt
This could be interesting, too:
Chayanika Deka writes XRP, SOL, and ADA Inclusion in US Crypto Reserve Pushes Traders on Edge
Chayanika Deka writes Why Arthur Hayes Is Bullish on Bitcoin Under Trump’s Economic Strategy
Mandy Williams writes Why the Bitcoin Market Is Stuck—and the Key Metric That Could Change It: CryptoQuant CEO
Wayne Jones writes Metaplanet Acquires 156 BTC, Bringing Total Holdings to 2,391
The technical indicators are showing weakness in the short term. The onchian activity of retailers as a reaction to volatile market is still rising. This can be translated to the high probability of a side chopping market in the mid-term. In a low trade volume phase, such as the current market condition, capitulation events are expected more than ever.
Technical Analysis
By: Grizzley
Long-Term:
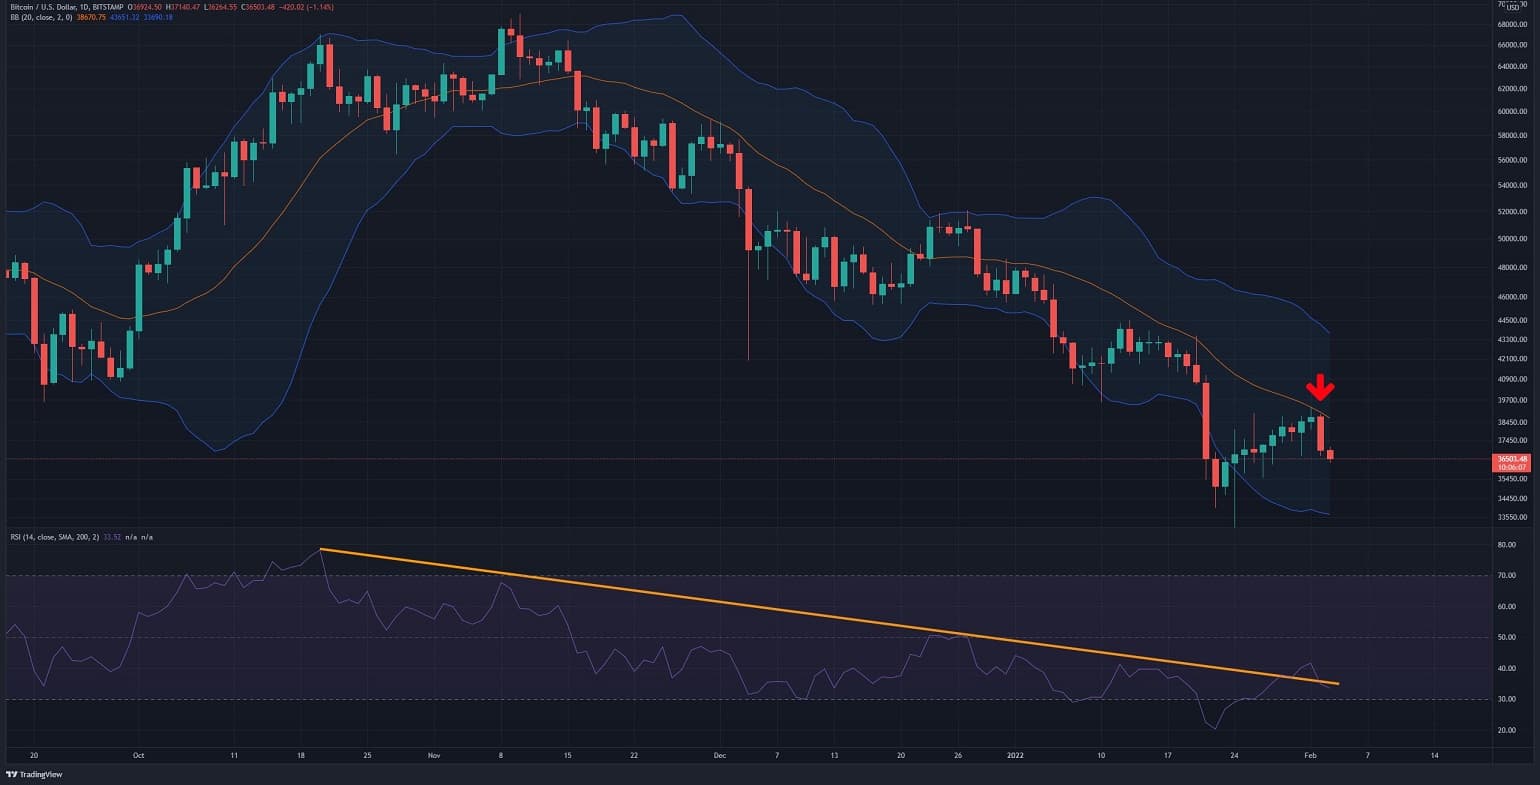
On the daily timeframe, the recent uptrend was stopped by touching the low band of Bollinger Bands (BB) and a long candlestick was formed. Although the RSI indicator broke above its downtrend line, the safer strategy would be to wait for the price crossing BB baseline. Then market participants can be confident that the buyer’s side is more powerful in the order book.
Short-Term:
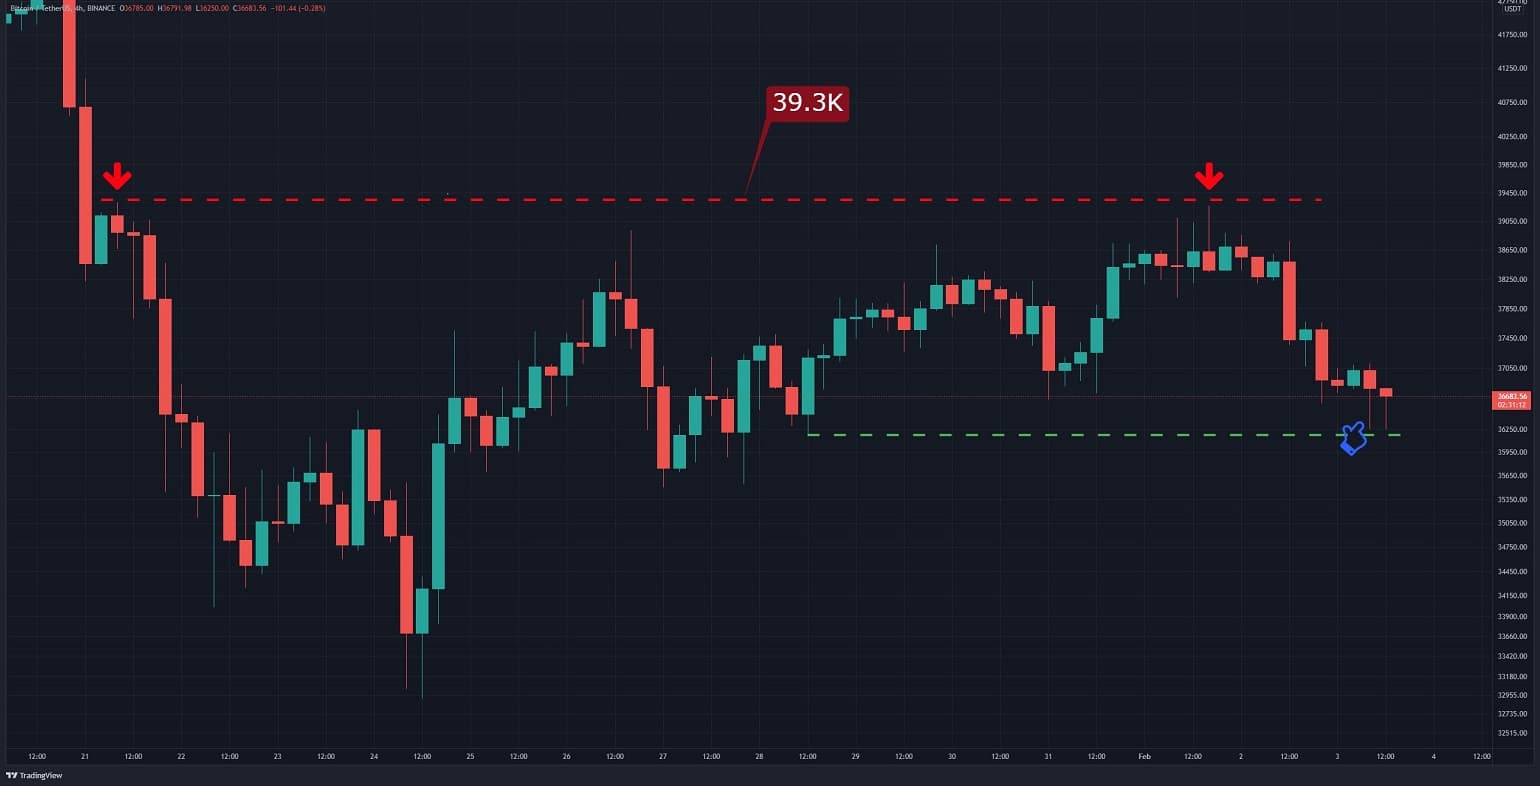
Bitcoin was rejected by the formed supply zone at $39.3K leading to a correction on the 4H timeframe. The first support at $36.2K has held the price so far, and the lower shadows on the candlesticks indicate buying orders in this area. The next support is at $35.5K while crossing the supply zone ($39.3K) is vital for continuing the upward trend.
Onchain Analysis
By: CryptoVizArt
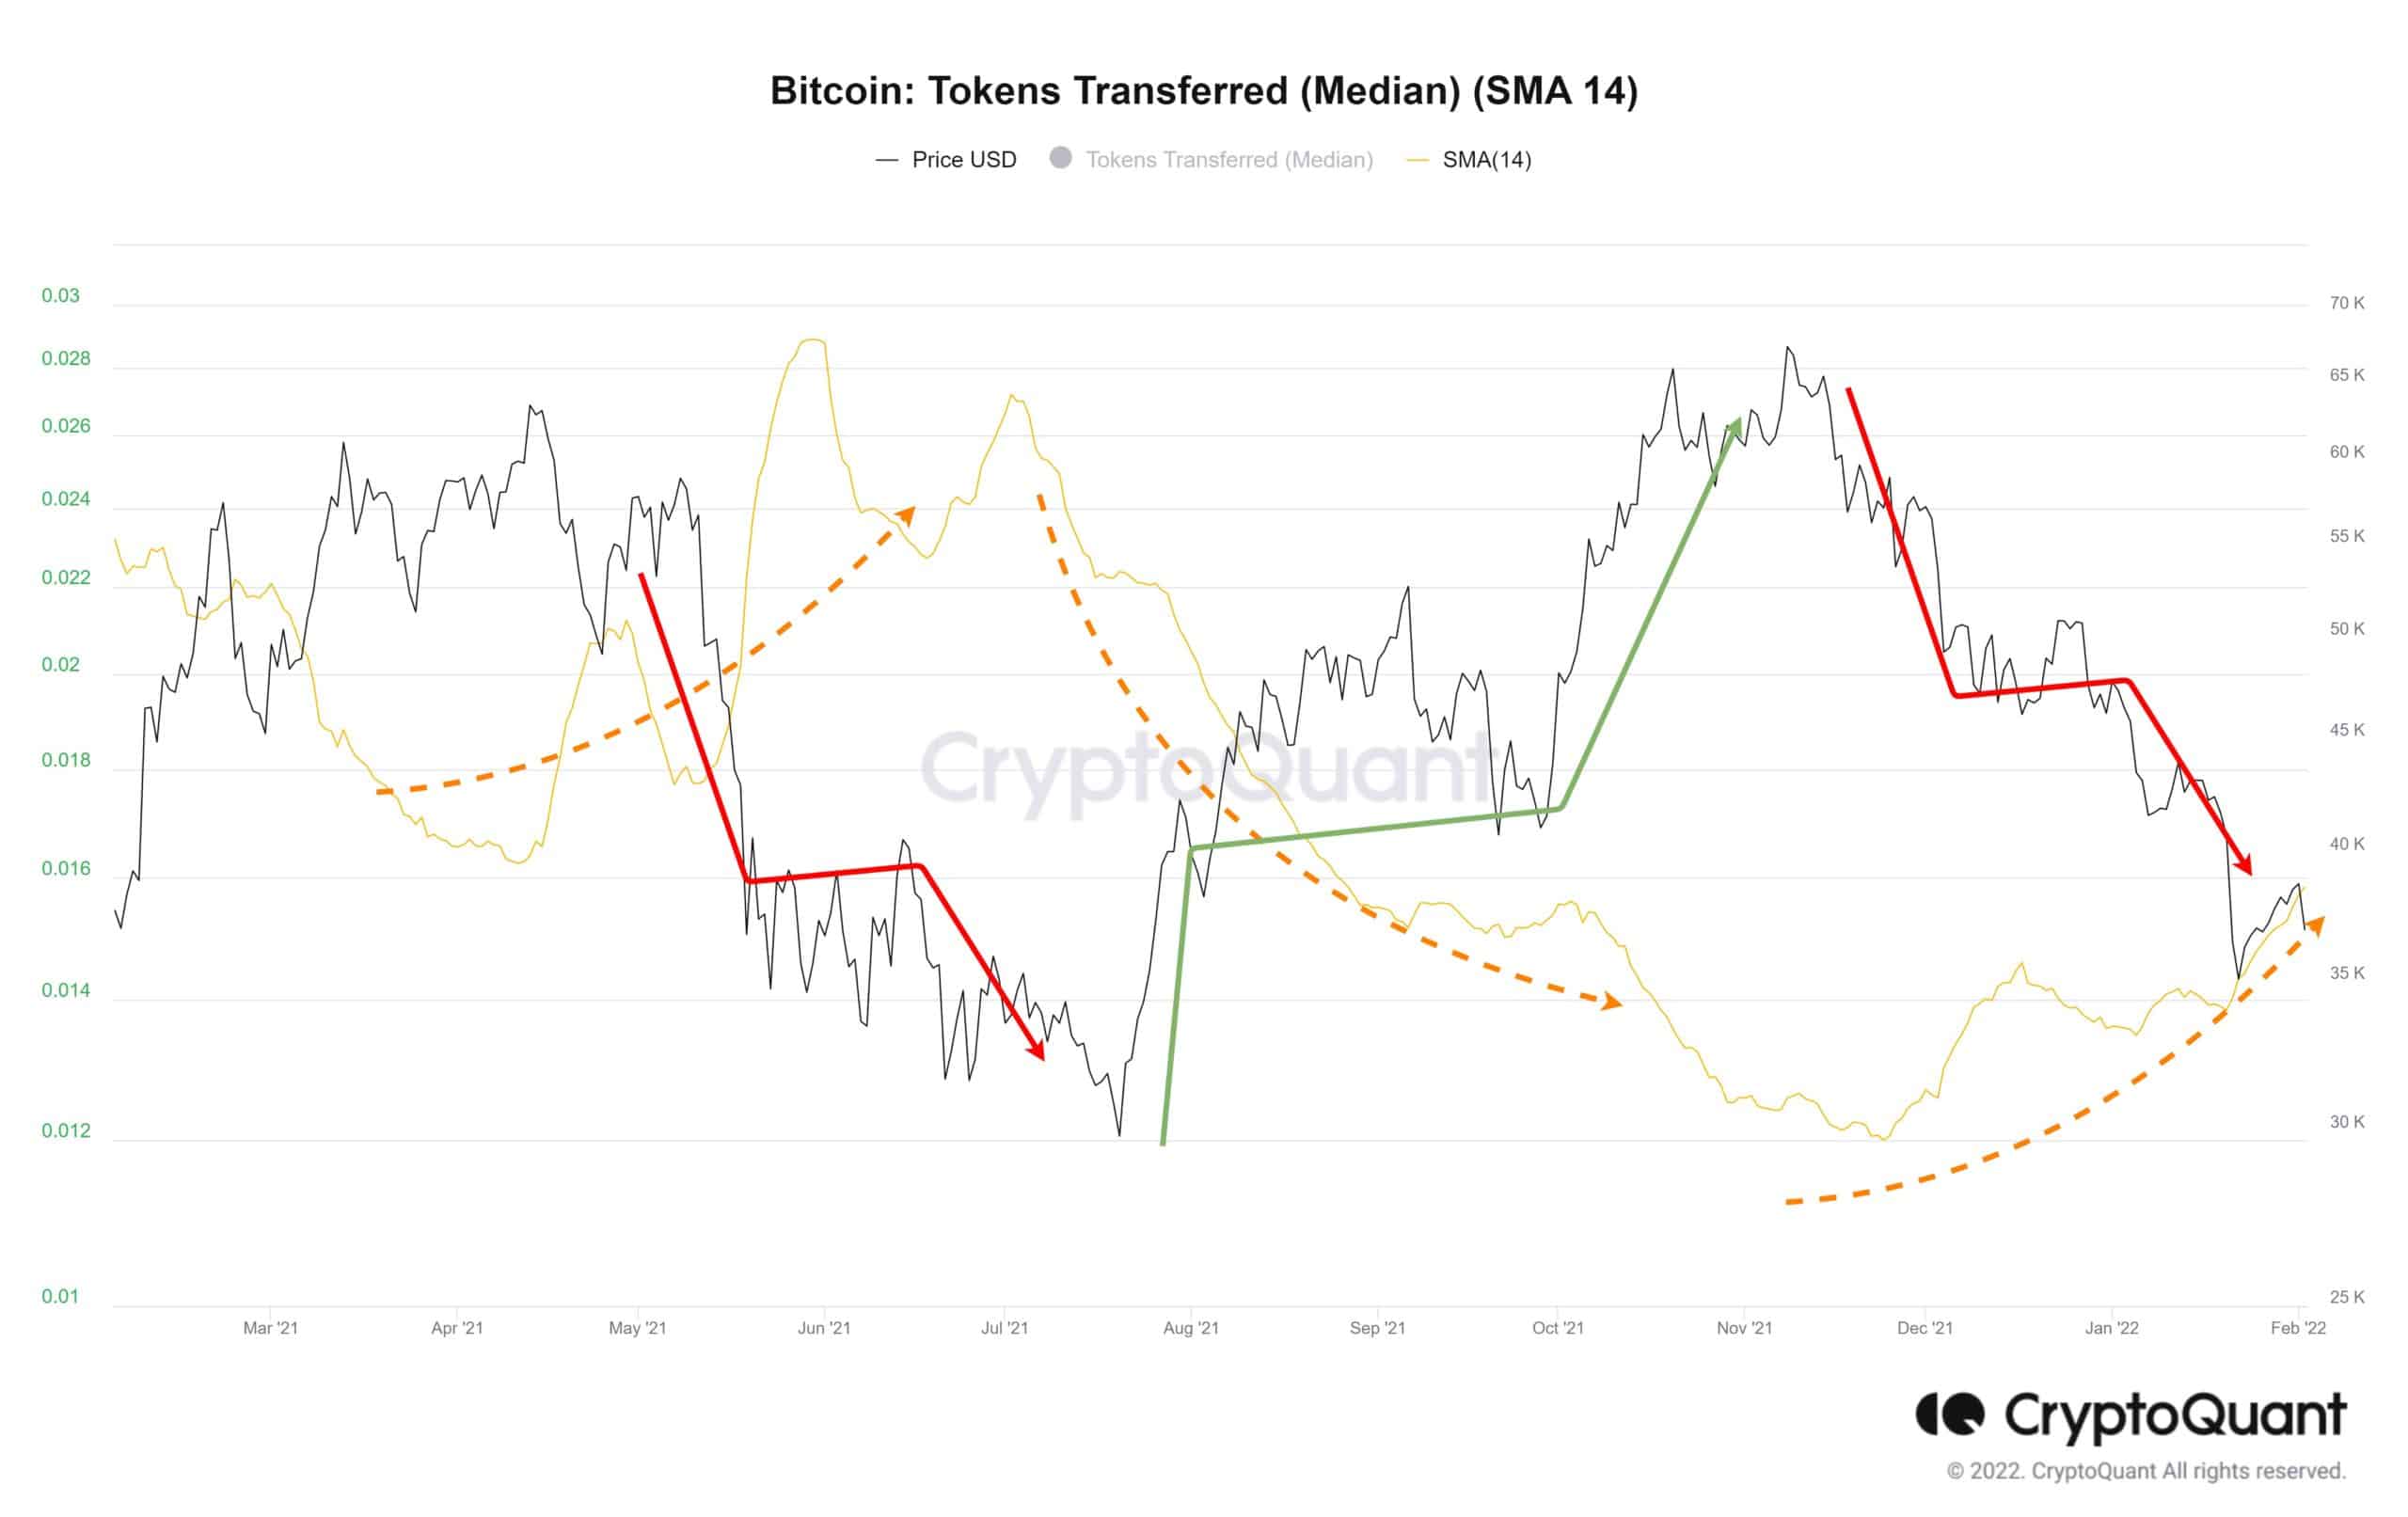
The activity of retailers on bitcoin’s network can be mapped with many metrics. Among the simplest but most powerful ones that analysts can utilize to estimate the intensity of the small investor’s activity is the Median Size of the Transferred Token per transaction.
The 14D SMA of this metric is demonstrated in the above chart. The evident divergence between price and the 14D SMA of this metric in the following image is a sign that retailers are still reacting to the fear in the market. A trend reversal would be a sign that paper hand investors are flushed out of the market and a price recovery would be feasible in mid-term