Since early 2022, Bitcoin has been in a ranging phase, resulting in two crucial supply and demand levels. There seems to be a lot of demand in the form of bids and stop-losses above K, making it a significant level to watch. Technical Analysis The Daily Chart: Technical Analysis By Shayan As the daily chart illustrates, the price has been supported by the significant support level at K, which has led to a break out of the RSI’s resistance trendline and now is attempting the 100-day moving average. This is a significant resistance on Bitcoin’s route towards the range’s top. The K supply zone is unavoidable if the moving average is exceeded. Source: TradingViewThe 4-Hour Chart: On the 4-hour time frame, the K support zone has served as a significant support level
Topics:
CryptoVizArt considers the following as important: Bitcoin (BTC) Price, BTC Analysis, BTCEUR, BTCGBP, btcusd, btcusdt
This could be interesting, too:
Chayanika Deka writes XRP, SOL, and ADA Inclusion in US Crypto Reserve Pushes Traders on Edge
Chayanika Deka writes Why Arthur Hayes Is Bullish on Bitcoin Under Trump’s Economic Strategy
Mandy Williams writes Why the Bitcoin Market Is Stuck—and the Key Metric That Could Change It: CryptoQuant CEO
Wayne Jones writes Metaplanet Acquires 156 BTC, Bringing Total Holdings to 2,391
Since early 2022, Bitcoin has been in a ranging phase, resulting in two crucial supply and demand levels. There seems to be a lot of demand in the form of bids and stop-losses above $45K, making it a significant level to watch.
Technical Analysis
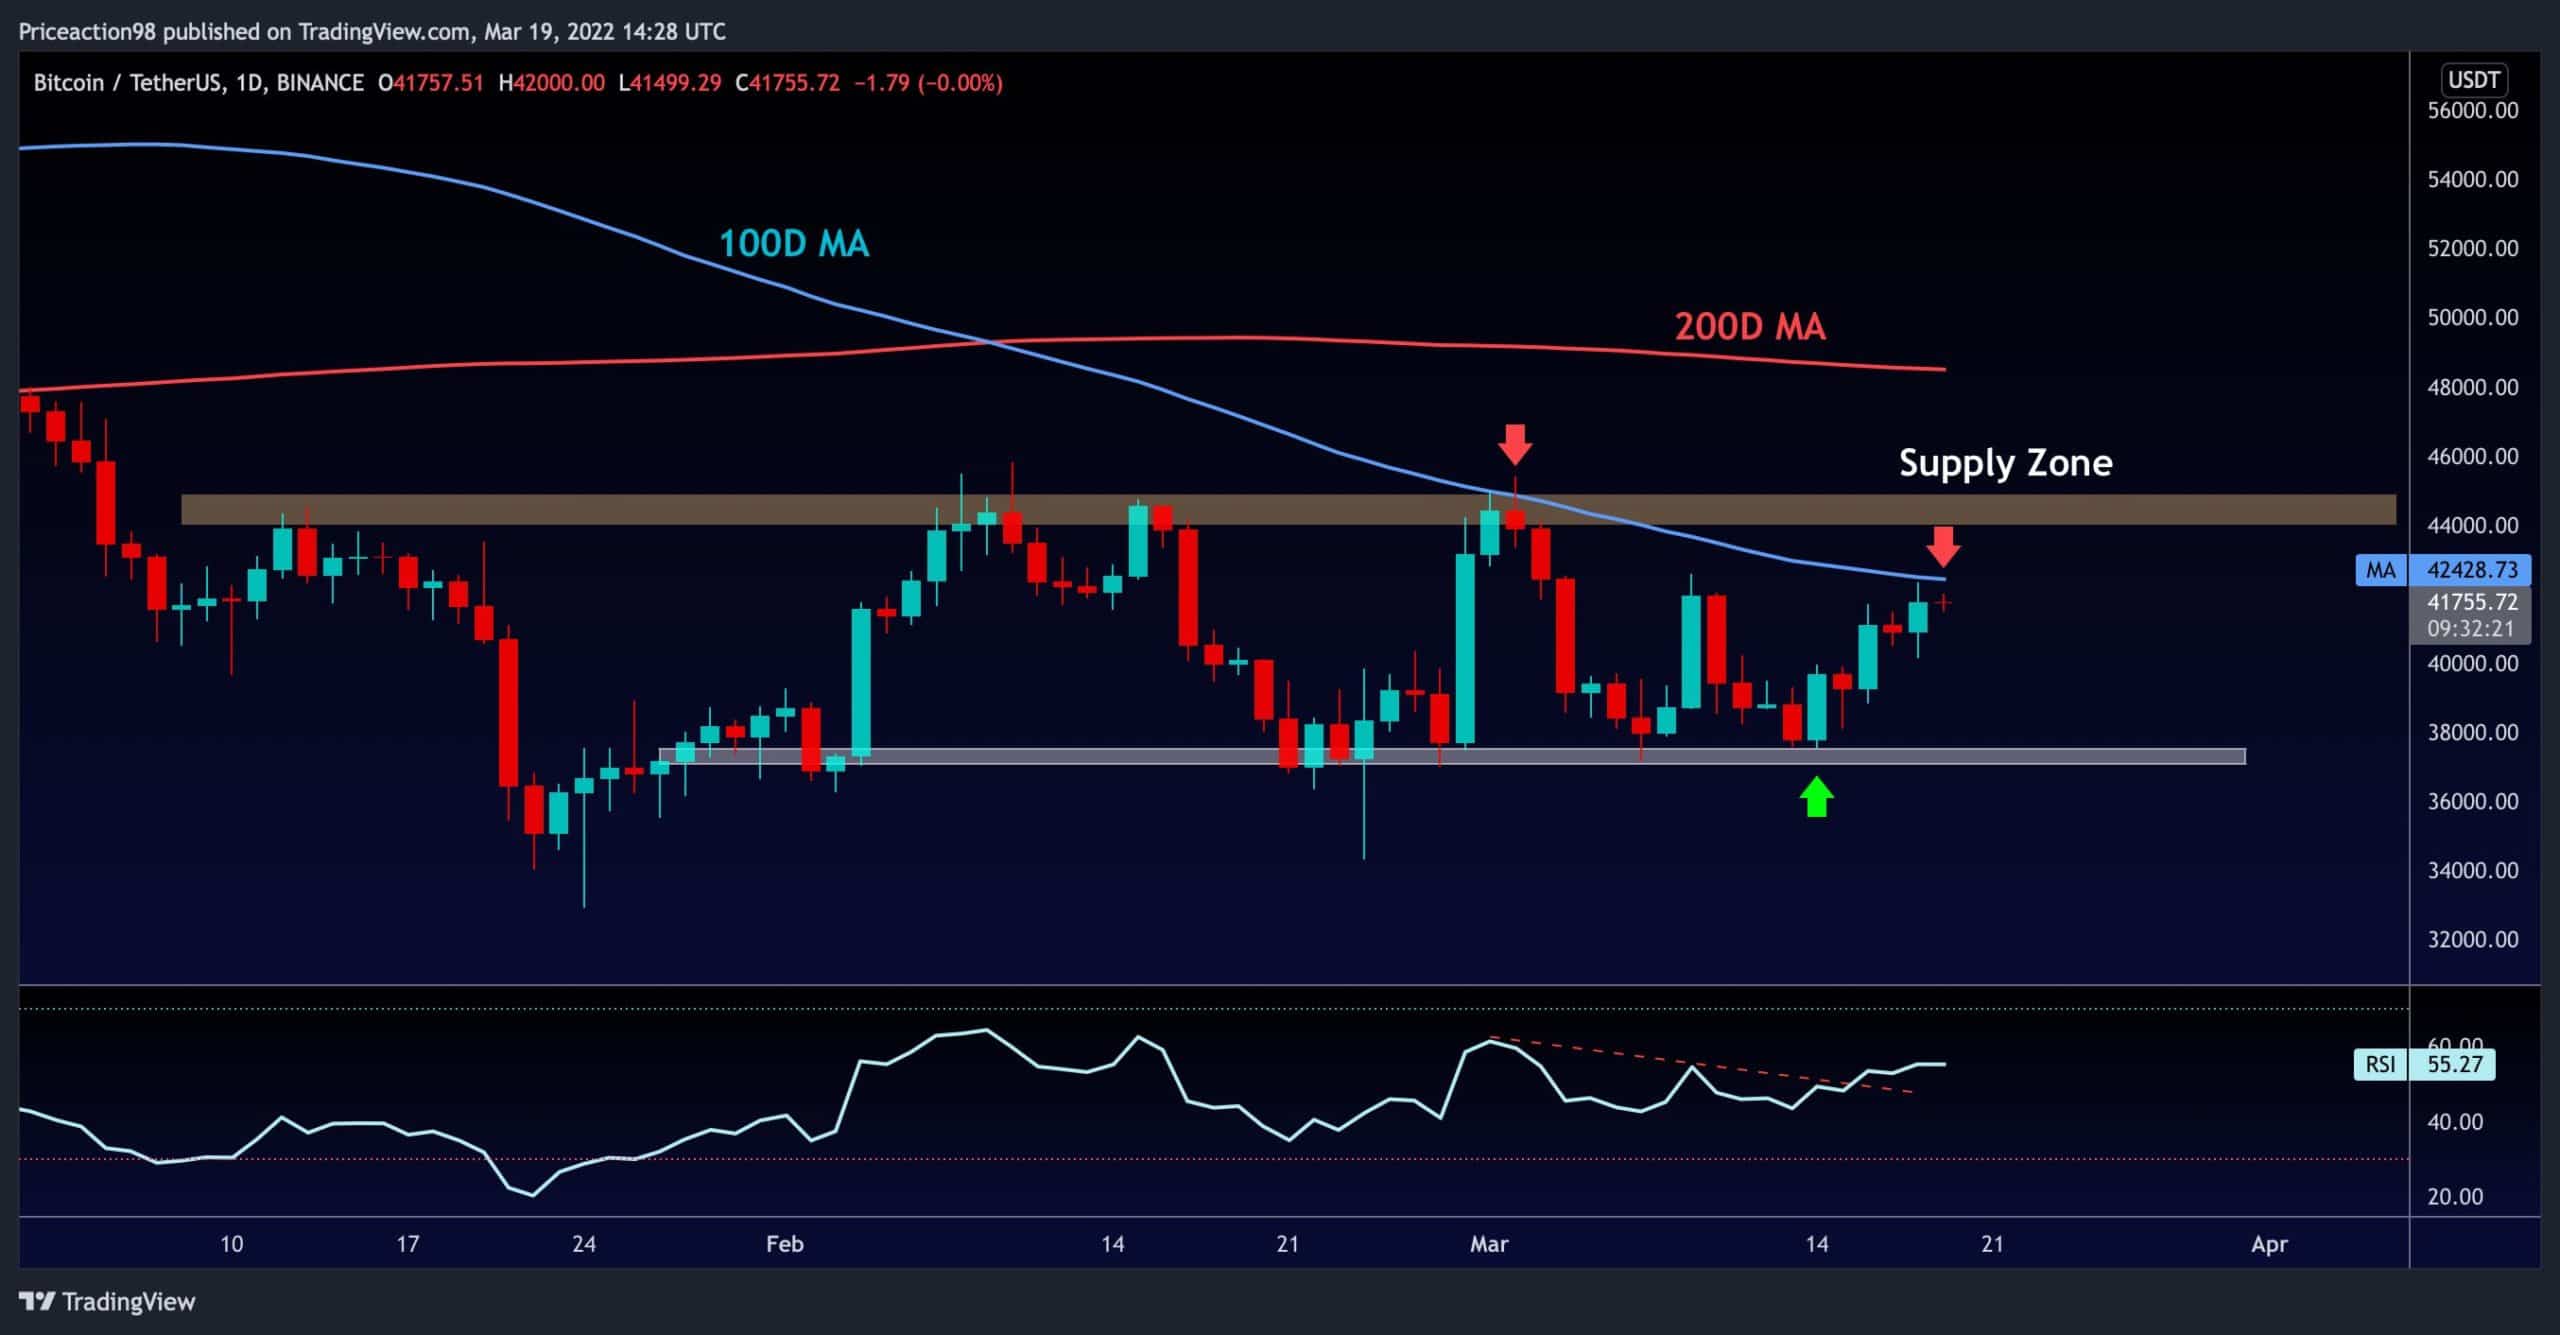
The Daily Chart:
Technical Analysis By Shayan
As the daily chart illustrates, the price has been supported by the significant support level at $37K, which has led to a break out of the RSI’s resistance trendline and now is attempting the 100-day moving average. This is a significant resistance on Bitcoin’s route towards the range’s top. The $45K supply zone is unavoidable if the moving average is exceeded.
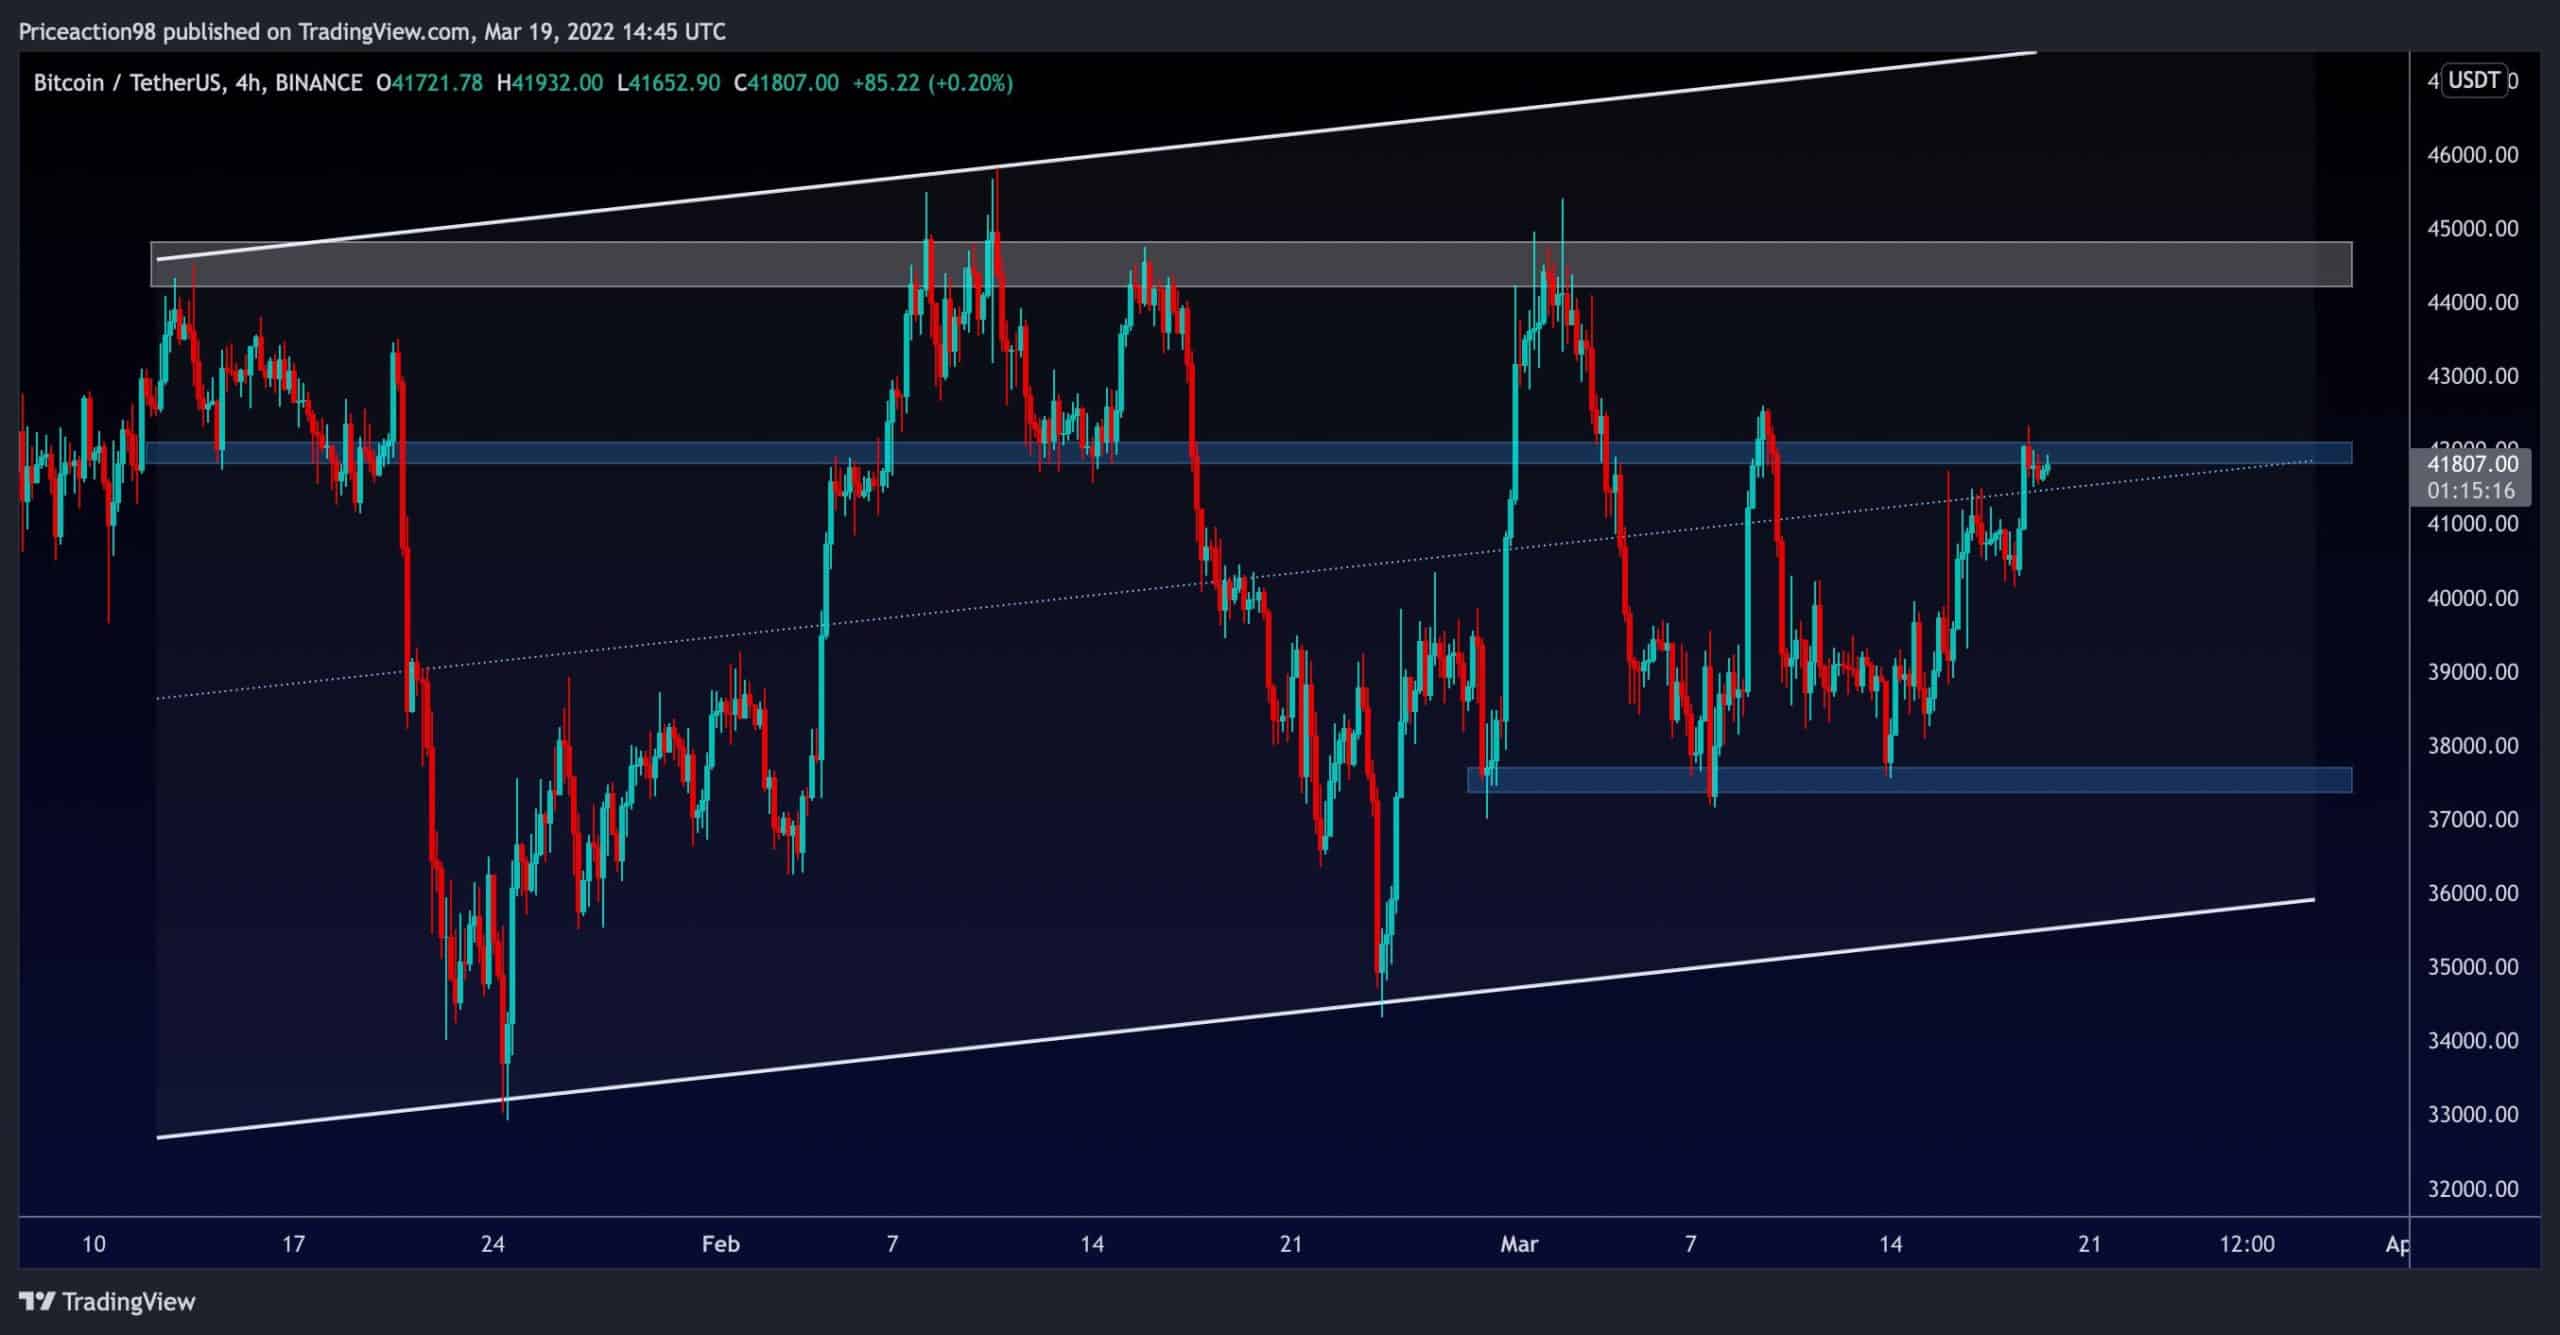
The 4-Hour Chart:
On the 4-hour time frame, the $37K support zone has served as a significant support level for Bitcoin, preventing it from plummeting to lower levels. On the other hand, BTC has been moving within a clear ascending channel (white trendlines) and has now broken the channel’s mid trendline.
Furthermore, the price is near its previous pivot and below a short-term resistance level around $42K, increasing the chances of a double top pattern emerging. If the threshold is surpassed, Bitcoin will face no obstacles to the $45K supply zone.
On-chain Analysis
Onchain Analysis By Edris
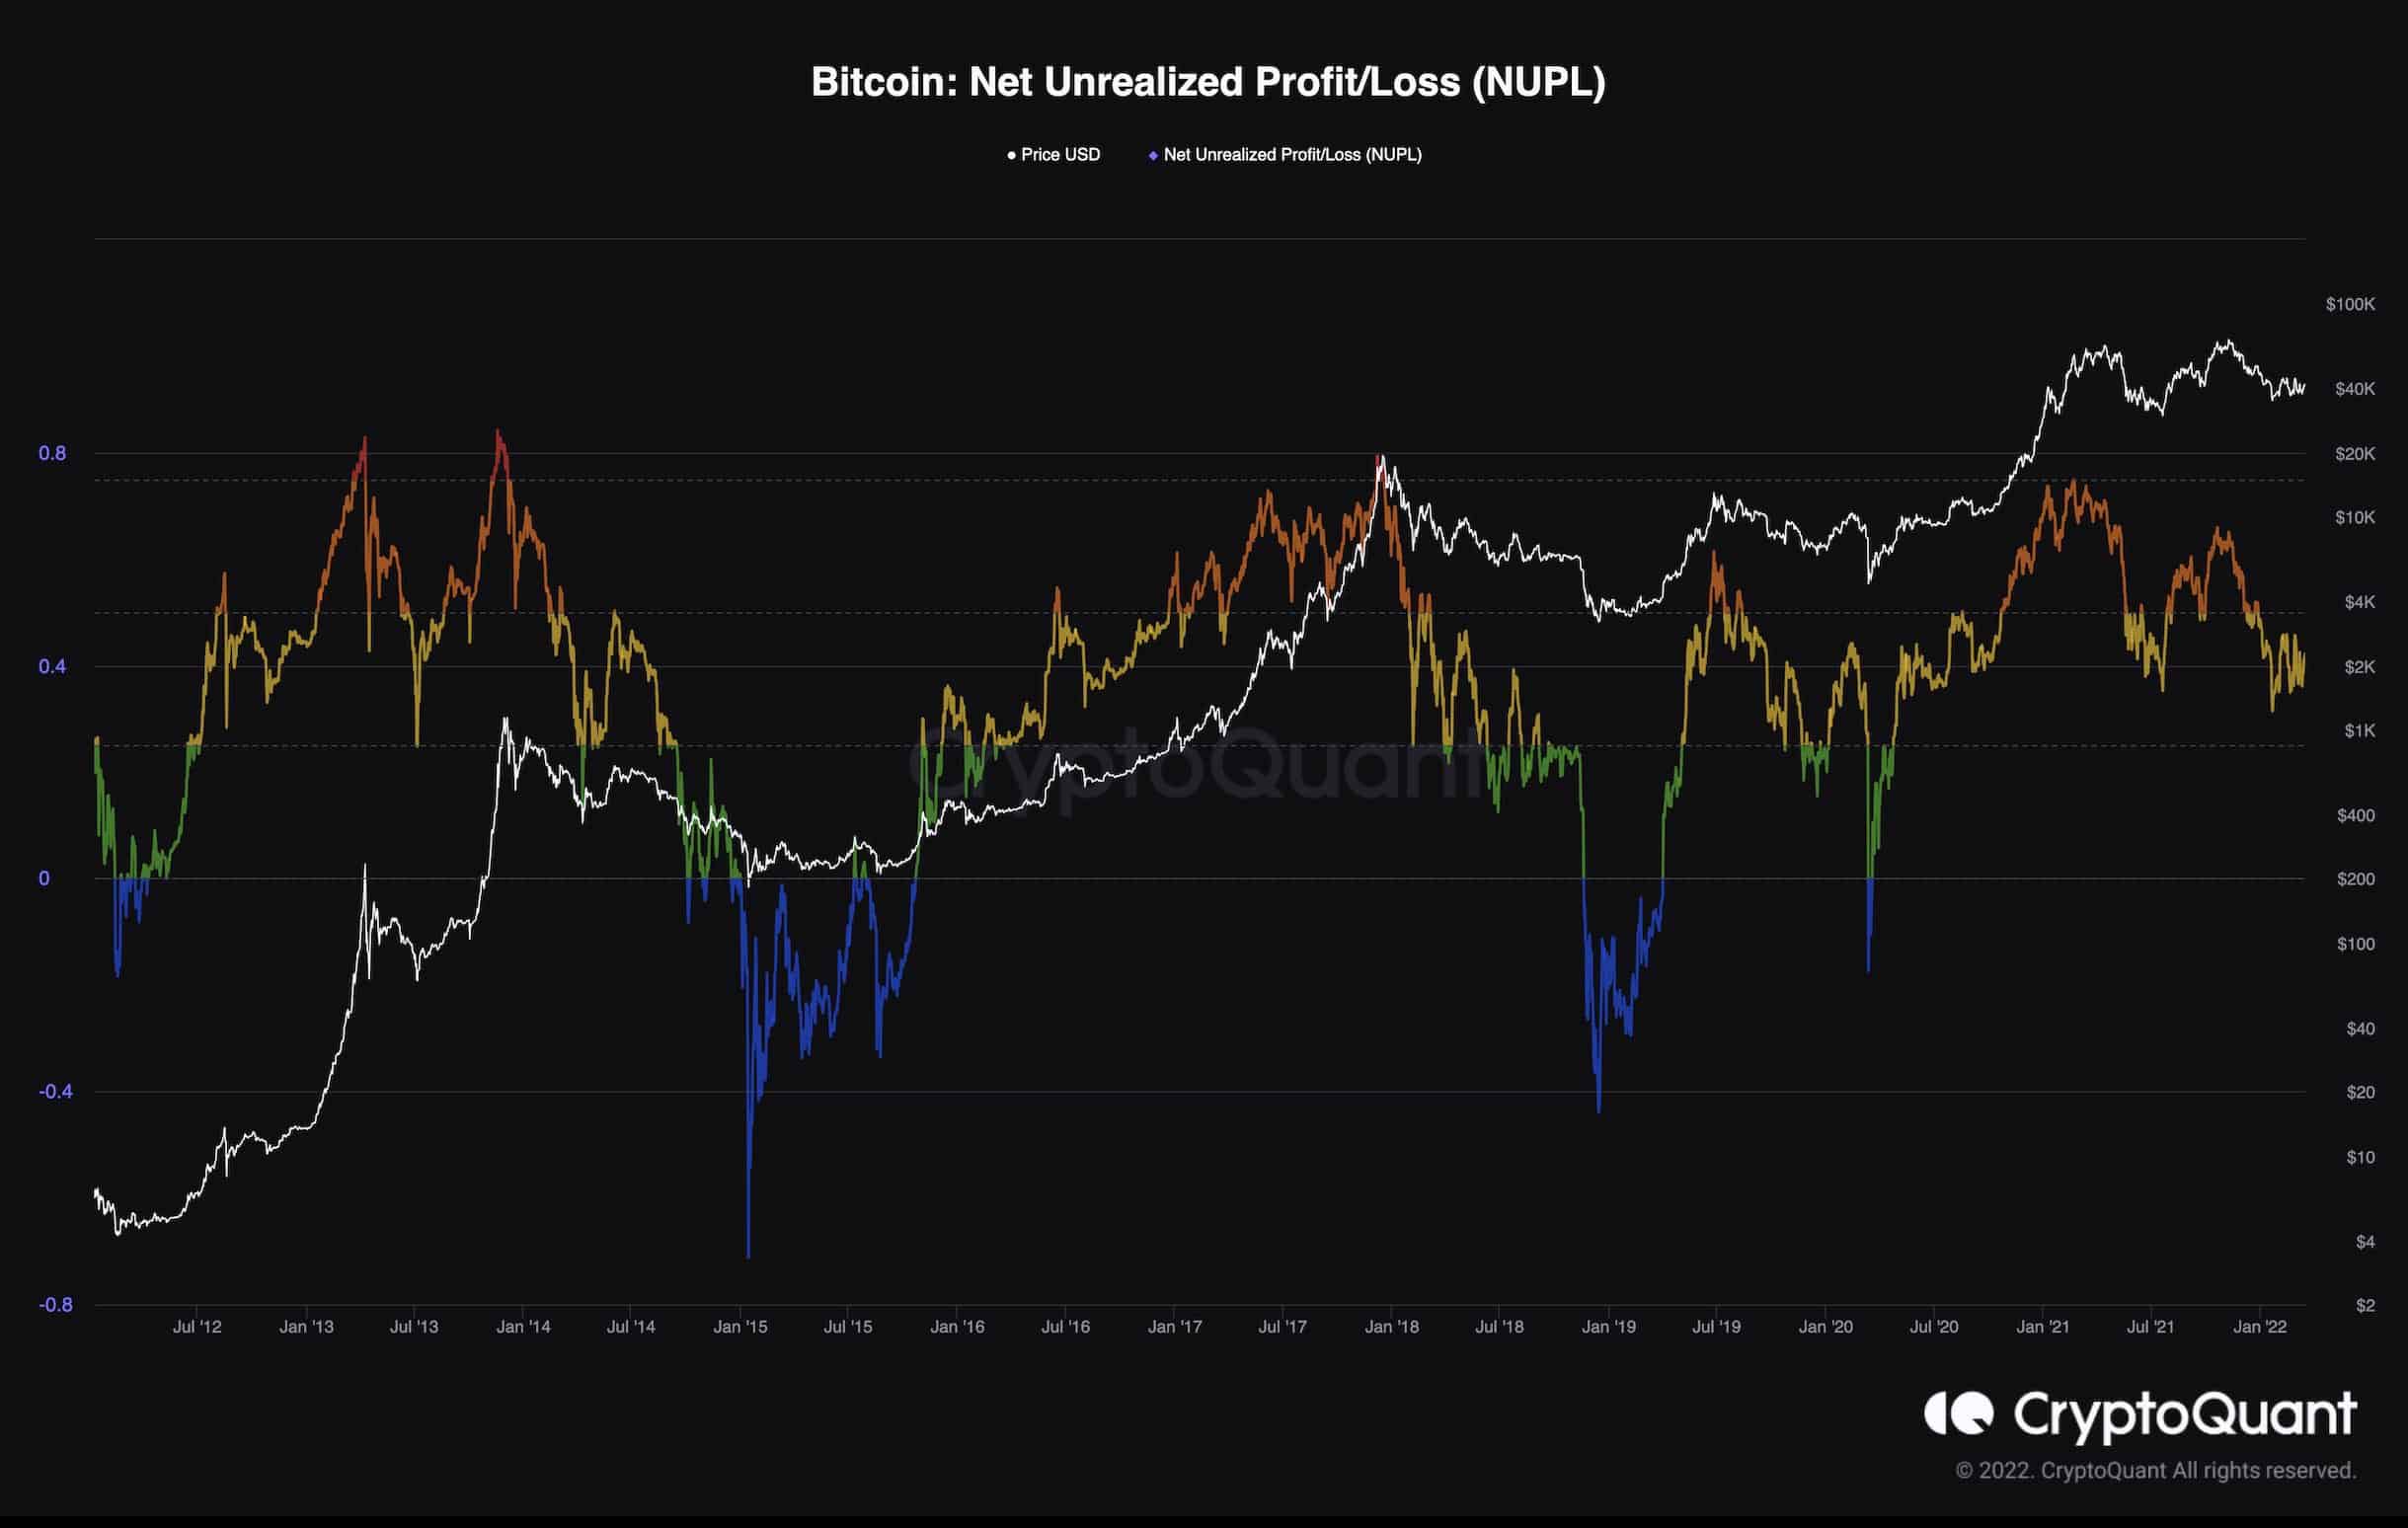
Bitcoin: Net Unrealized Profit/Loss (NUPL)
Analyzing the unrealized profits and losses of the market participants has proven to be helpful to determine the price tops and bottoms, and the NUPL metric is the most common indicator used for this goal. The chart demonstrates that the amount of losses has reached and even went below last year’s $28K bottom. However, it is nowhere near the previous bear market bottoms.
If a bear market scenario is assumed, the market is yet to go through the final capitulation phase, which occurs at the absolute bottom. During this capitulation event, even the most patient retail investors begin panic selling, and the smart money comes in to buy these coins at a considerable discount. On the other hand, if a bull market is still in play, current levels of NUPL have historically coincided with mid-term bottoms.