The past hours saw a massive sell-off, causing an unexpected and enormous plunge to sub-K in the price of Bitcoin. The onchain data is showing an absolute capitulation phase in the market, which was intensified by long-term holders just before the crashing to K. Long Term Analysis: The Daily Chart Yesterday, Bitcoin lost a critical support range at K – K. As shown in the chart below, before the price decline beneath K, both 50-DMA and 100-DMA lines have crossed the 200-DMA to the downside, indicating further bearish momentum incoming. Possible support levels are the current price area at K followed by K (May – July 2021 lows). On the other hand, the former support area (K) had turned into significant resistance if the price made a pullback from
Topics:
CryptoVizArt considers the following as important: Bitcoin (BTC) Price, BTC Analysis, BTCEUR, BTCGBP, btcusd, btcusdt
This could be interesting, too:
Chayanika Deka writes XRP, SOL, and ADA Inclusion in US Crypto Reserve Pushes Traders on Edge
Chayanika Deka writes Why Arthur Hayes Is Bullish on Bitcoin Under Trump’s Economic Strategy
Mandy Williams writes Why the Bitcoin Market Is Stuck—and the Key Metric That Could Change It: CryptoQuant CEO
Wayne Jones writes Metaplanet Acquires 156 BTC, Bringing Total Holdings to 2,391
The past hours saw a massive sell-off, causing an unexpected and enormous plunge to sub-$40K in the price of Bitcoin. The onchain data is showing an absolute capitulation phase in the market, which was intensified by long-term holders just before the crashing to $35K.
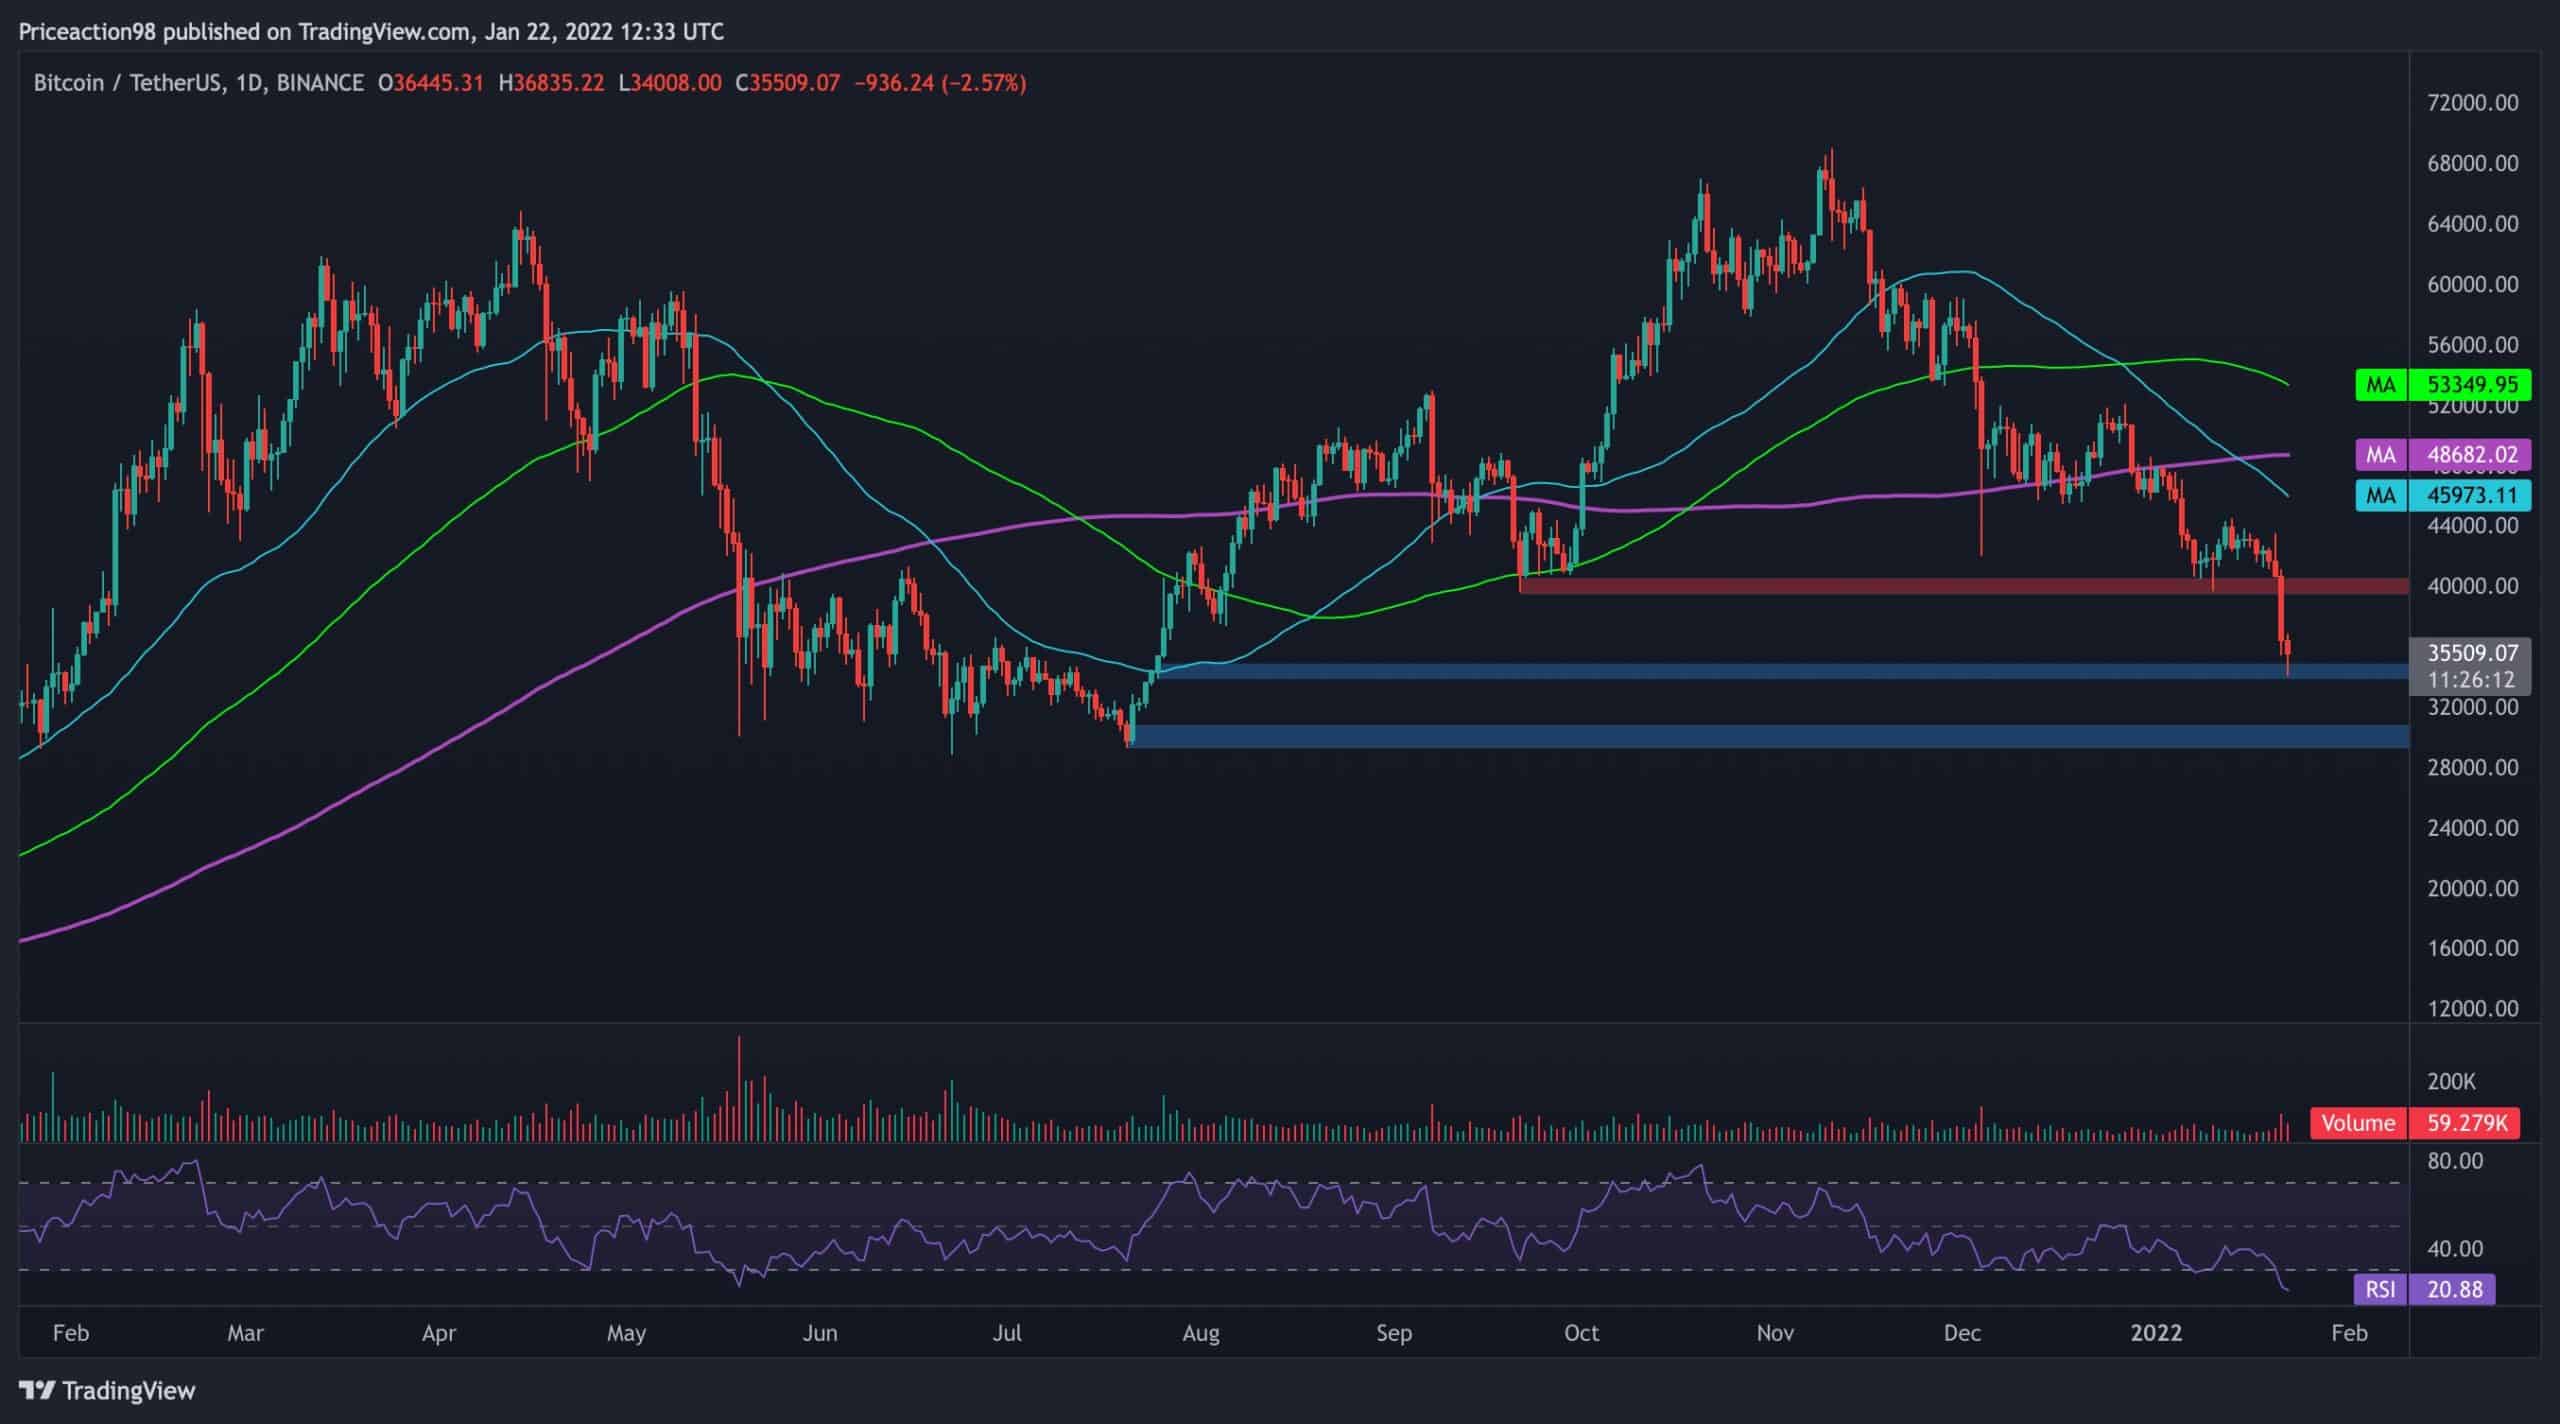
Long Term Analysis: The Daily Chart
Yesterday, Bitcoin lost a critical support range at $37K – $40K. As shown in the chart below, before the price decline beneath $40K, both 50-DMA and 100-DMA lines have crossed the 200-DMA to the downside, indicating further bearish momentum incoming.
Possible support levels are the current price area at $35K followed by $30K (May – July 2021 lows). On the other hand, the former support area ($40K) had turned into significant resistance if the price made a pullback from either of the two support areas mentioned. The daily RSI also indicates on massively oversold, currently sitting at the 20% mark, suggesting that a bullish pullback is possible over the short term.
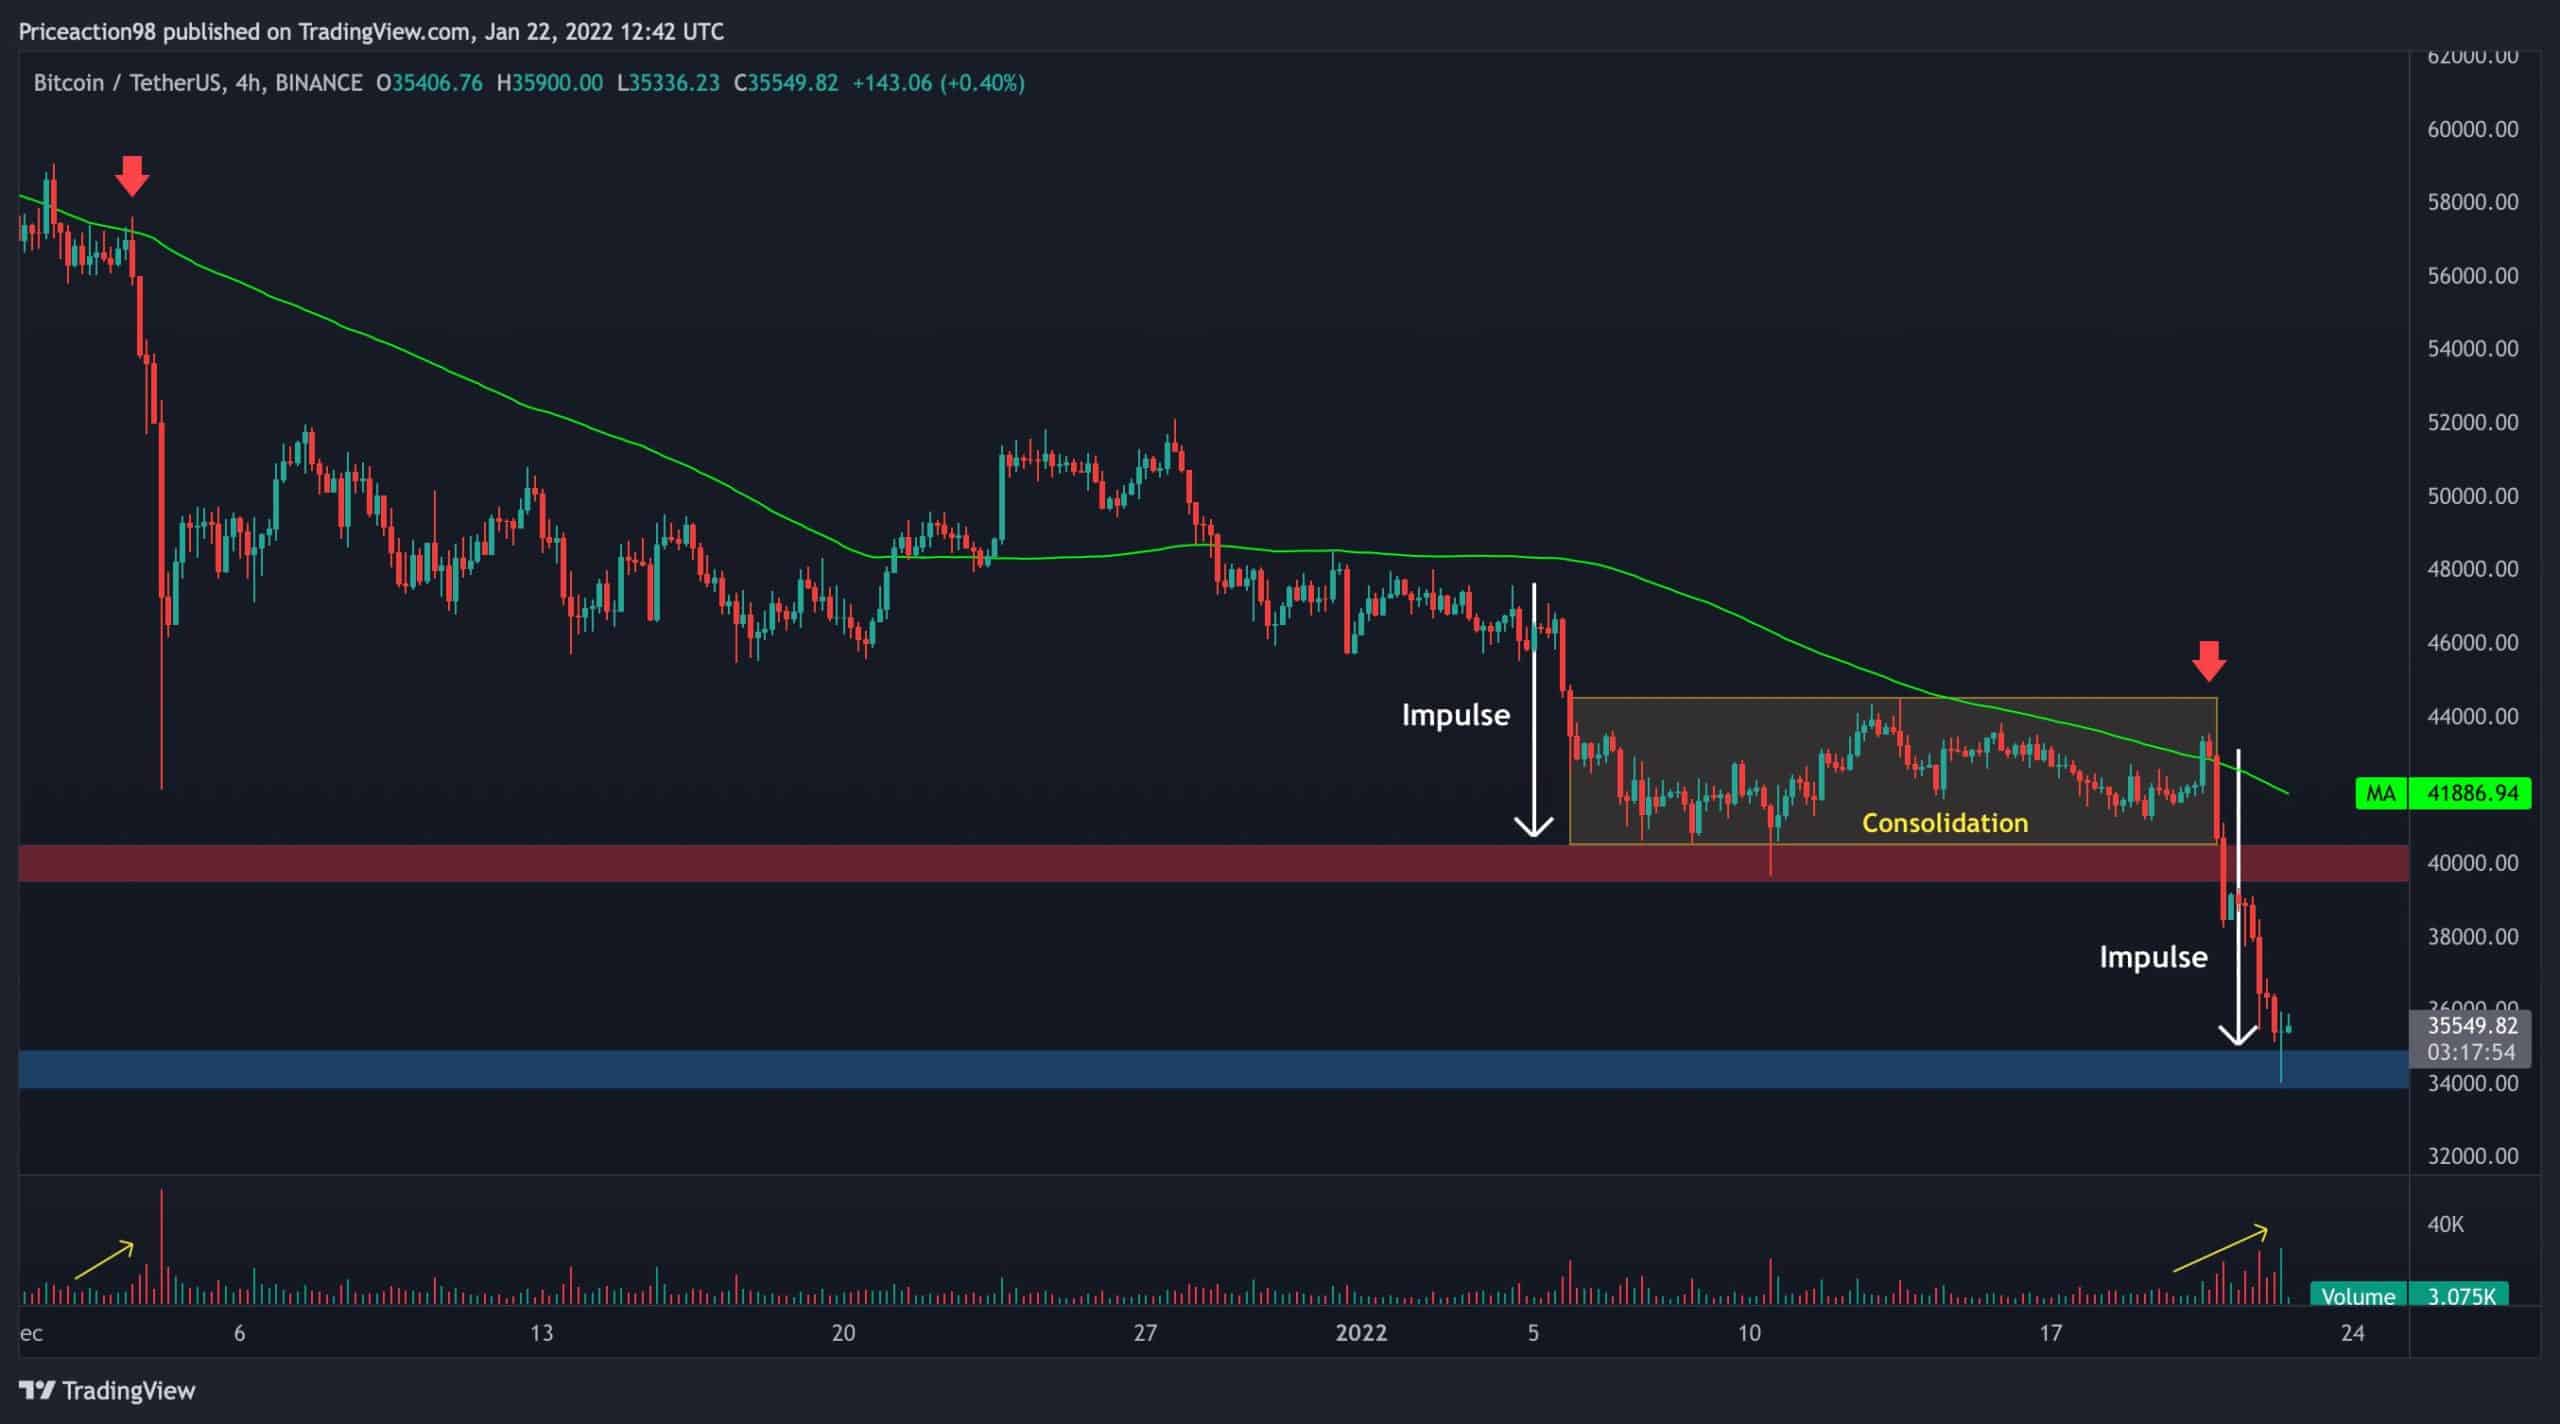
Short Term Analysis: The 4-Hour Chart
Evaluating the last week’s price action on the 4-hour timeframe, it is evident that the price was under a heavy downtrend and got rejected at the 100-MA several times.
This time was no different, as the price dropped impulsively from $48K to $40K, went through a consolidation phase, and once again, got rejected at the 100-MA. This rejection triggered the next bearish leg down.
With the considerable spike in trading volume and the last couple of candles around the $35k support, we can expect another phase of consolidation before the market decides its next direction.
Onchain Analysis
Spent output profit ratio (SOPR) is a well-known on-chain metric that can map the “Capitulation” phase in a bear market.
The short-term holders have been selling or moving their coins after Bitcoin registered the recent November ATH at $69K. During the recent bloody days, short-term holders were panic-selling and realizing their losses. As you can see, the STH_SOPR metric has dropped to 0.95 during the last shakeout, which is a perfect explanation for the “Capitulation” event.

An interesting piece of data that completes the puzzle was the sudden spike in the LTH-SOPR before the recent price drop. This means some long-term holders may have tried to exit the market before the crash and by doing so, they intensified the negative momentum in the market.