Considering the technical and on-chain data, a possible bounce back in the short term is possible. Though, in an uncertain environment from the macro perspective, a strong price recovery seems less likely. Technical Analysis By: Edris Daily timeframe: The downtrend in Bitcoin’s continues as we approach the bulls’ last stronghold. The daily chart shows that the price has been consolidating extensively over the previous year. We are currently moving down towards the lower band of this range, and there is a high chance that the price bounces and starts a short-term rally, also known as the “Dead Cat Bounce” scenario. Moreover, the daily RSI suggests an oversold sentiment in the market and is currently trying to break above the 30% level. Technically speaking, like Feb 2021,
Topics:
CryptoVizArt considers the following as important: Bitcoin (BTC) Price, BTC Analysis, BTCEUR, BTCGBP, btcusd, btcusdt
This could be interesting, too:
Chayanika Deka writes XRP, SOL, and ADA Inclusion in US Crypto Reserve Pushes Traders on Edge
Chayanika Deka writes Why Arthur Hayes Is Bullish on Bitcoin Under Trump’s Economic Strategy
Mandy Williams writes Why the Bitcoin Market Is Stuck—and the Key Metric That Could Change It: CryptoQuant CEO
Wayne Jones writes Metaplanet Acquires 156 BTC, Bringing Total Holdings to 2,391
Considering the technical and on-chain data, a possible bounce back in the short term is possible. Though, in an uncertain environment from the macro perspective, a strong price recovery seems less likely.
Technical Analysis
By: Edris
Daily timeframe:
The downtrend in Bitcoin’s continues as we approach the bulls’ last stronghold. The daily chart shows that the price has been consolidating extensively over the previous year. We are currently moving down towards the lower band of this range, and there is a high chance that the price bounces and starts a short-term rally, also known as the “Dead Cat Bounce” scenario.
Moreover, the daily RSI suggests an oversold sentiment in the market and is currently trying to break above the 30% level. Technically speaking, like Feb 2021, an accumulation phase is in progress, leading to a short-term uptrend. However, one should consider the risk imposed by the macro-level factors, and if the price breaks below the lower band, things might get very ugly.

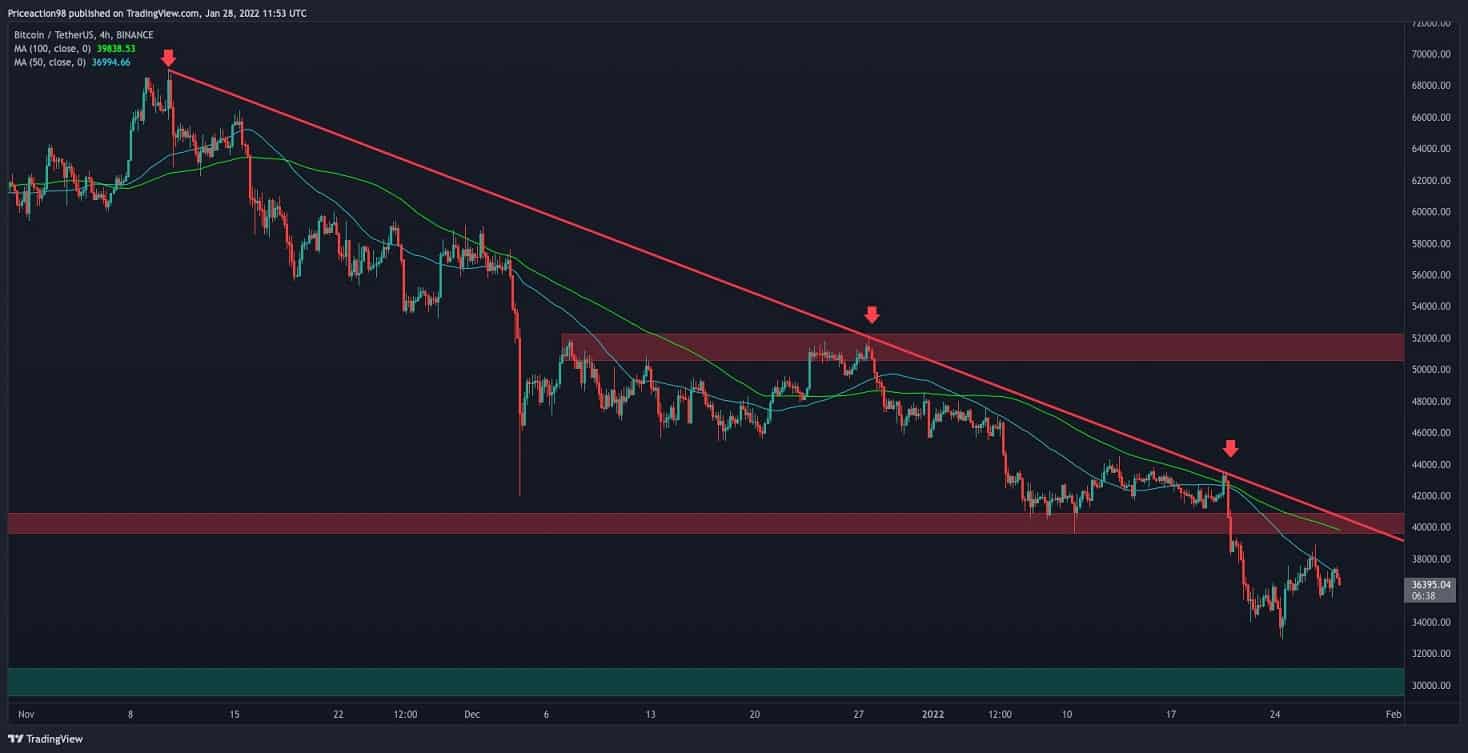
4-hour timeframe:
On a 4-hour timeframe, the price has been rejected by the 50 MA and 100 MA multiple times. The rejection of the price by the significant declining trendline confirms this bearish momentum. To anticipate a bullish reversal, the price needs to break above these dynamic resistances. For now, the most probable scenario is a consolidation phase in the $30k to $40k range.
Onchian Analysis:
By: CryptoVizArt
The most telling on-chain metric that can map the current market status might be the MVRV – the ratio of coins Market Cap to its Realized Cap, which indicates whether the price is overvalued or not.
Historically, values over ‘3.7’ pointed price top and values below ‘1’ indicated price bottom. Currently, the MVRV is 1.5 and the market’s momentum is not promising. Therefore, the probability of reaching an MVRV of 1 or lower is high in the mid-term. Unless a macro catalyst stimulates the demand side and price start to gain a moment, even as a short-term recovery, like early 2018.
