After almost three months of consolidation, Bitcoin’s price finally broke out of the – K range. The Daily Timeframe Technical Analysis By: Edris The price has broken above the K resistance zone following a parabolic move and is currently testing the 200-day moving average line (MA) amid K. This moving average is a significant trend indicator and if the price breaks above it, the trend would be considered bullish again. The next key resistance lies at the K area, which is a key level and might be the last obstacle before a new Bitcoin all-time high. However, if BTC gets rejected at the 200-day moving average line, the K area should be considered as a support and turning point if a pullback takes place. Another interesting observation is that the 50-day MA
Topics:
CryptoVizArt considers the following as important: Bitcoin (BTC) Price, BTC Analysis, BTCEUR, BTCGBP, btcusd, btcusdt
This could be interesting, too:
Chayanika Deka writes XRP, SOL, and ADA Inclusion in US Crypto Reserve Pushes Traders on Edge
Chayanika Deka writes Why Arthur Hayes Is Bullish on Bitcoin Under Trump’s Economic Strategy
Mandy Williams writes Why the Bitcoin Market Is Stuck—and the Key Metric That Could Change It: CryptoQuant CEO
Wayne Jones writes Metaplanet Acquires 156 BTC, Bringing Total Holdings to 2,391
After almost three months of consolidation, Bitcoin’s price finally broke out of the $33 – $46K range.
The Daily Timeframe
Technical Analysis By: Edris
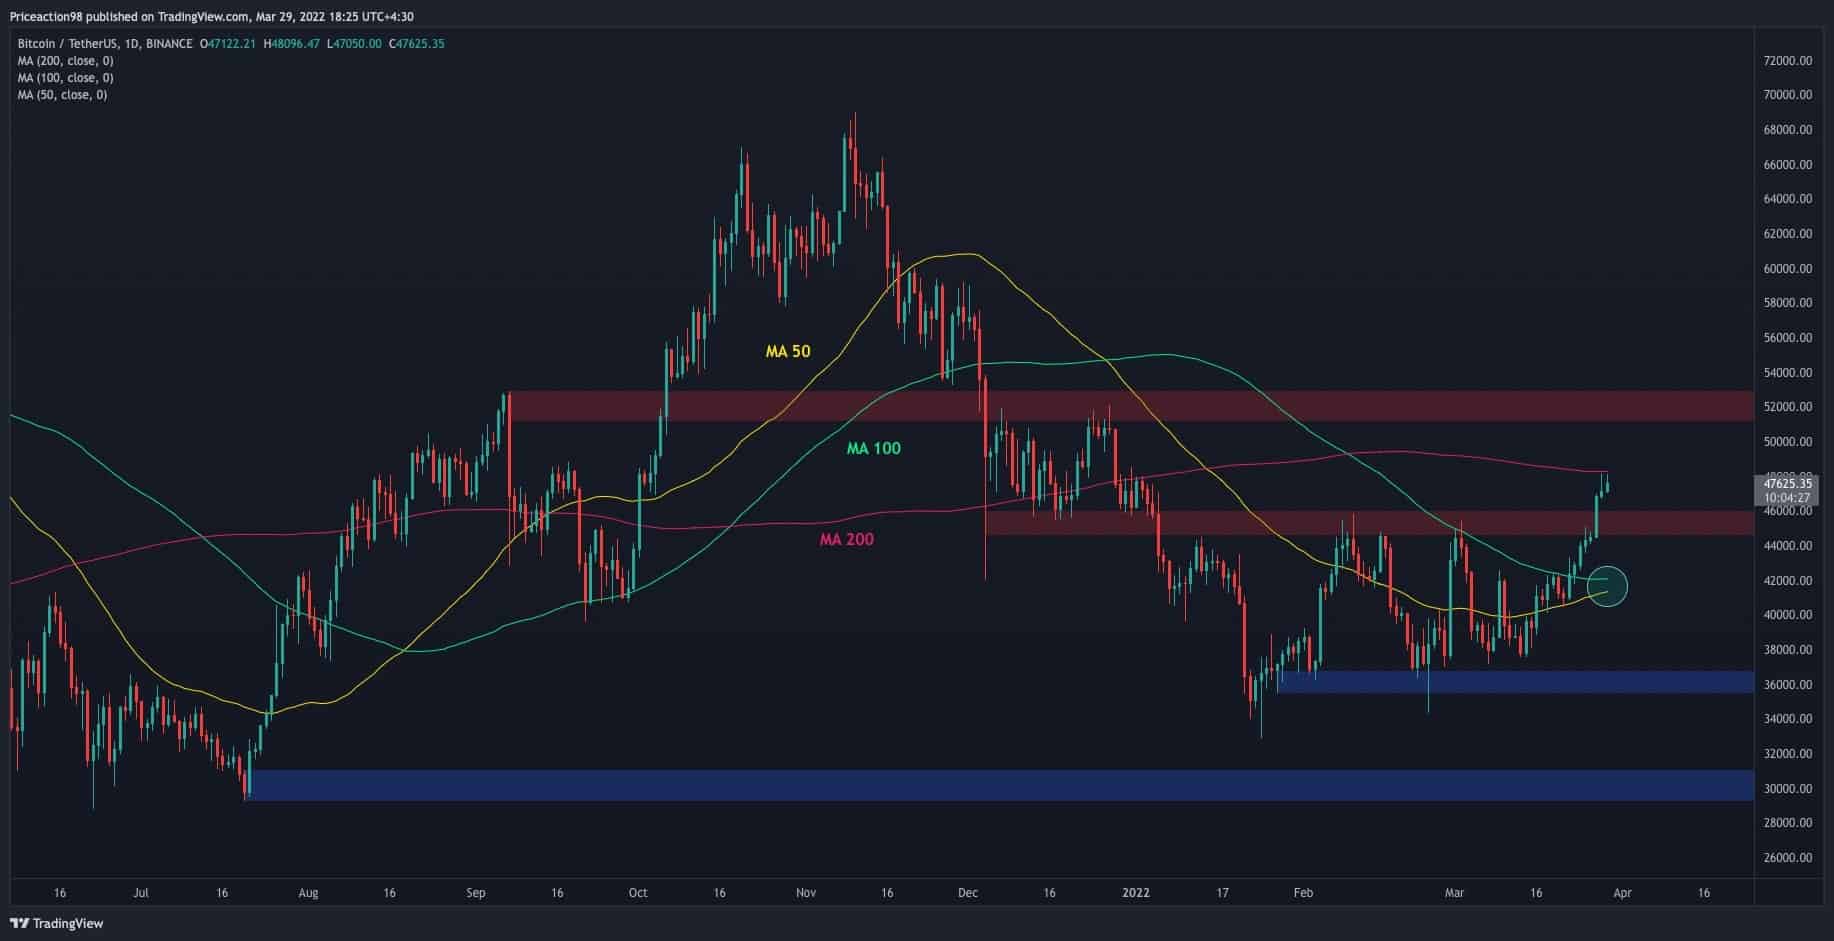
The price has broken above the $46K resistance zone following a parabolic move and is currently testing the 200-day moving average line (MA) amid $48K. This moving average is a significant trend indicator and if the price breaks above it, the trend would be considered bullish again.
The next key resistance lies at the $52K area, which is a key level and might be the last obstacle before a new Bitcoin all-time high.
However, if BTC gets rejected at the 200-day moving average line, the $46K area should be considered as a support and turning point if a pullback takes place.
Another interesting observation is that the 50-day MA is about to cross above the 100-day MA line, which is considered a bullish signal.
The 4-Hour Timeframe
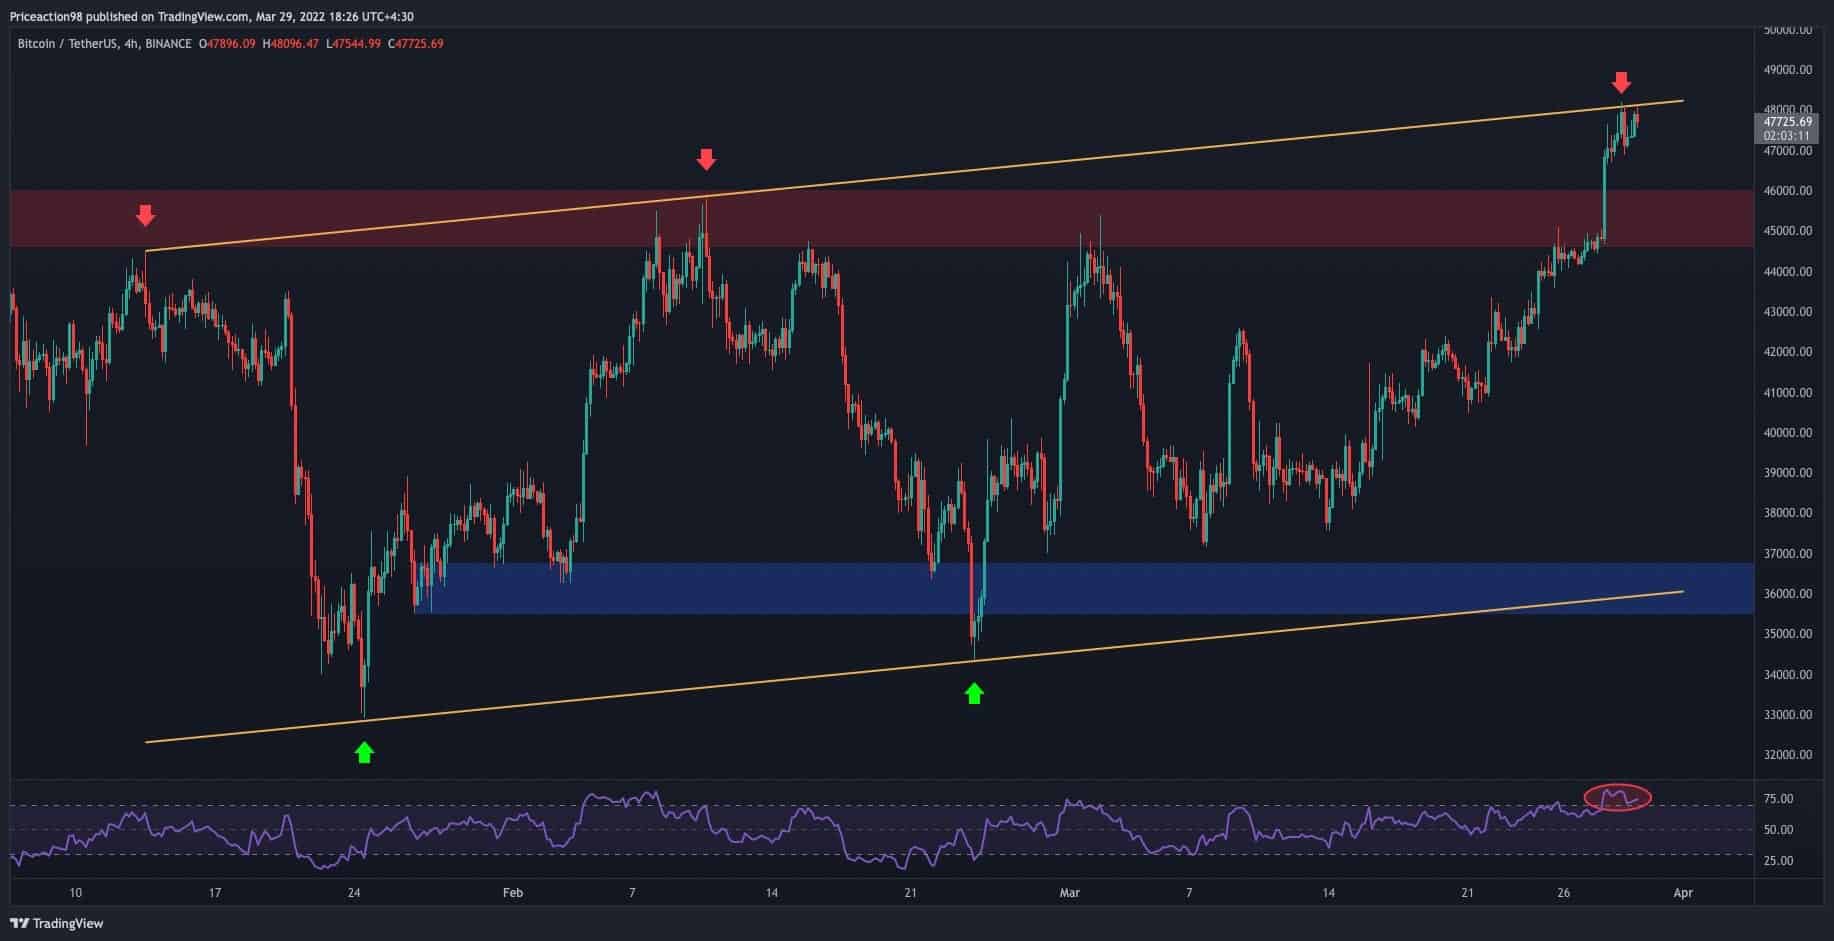
On the 4-hour time frame, things get a bit more complicated. The price is struggling at an ascending trend-line compiling a large bearish flag, and this is the third attempt to break above it.
Only in case of a bullish breakout, this pattern will get invalidated, and then a surge to $50-52K is likely imminent. However, a rejection here could lead to a retest of the lower boundary of the flag at $36K level, and in case of a break below – new lows can form.
The RSI is also signaling potential correction as its value is above 70 which is considered an overbought territory, so this adds to the probability of a bearish reversal or correction towards the lower range of the flag.
Onchain Analysis
By Shayan
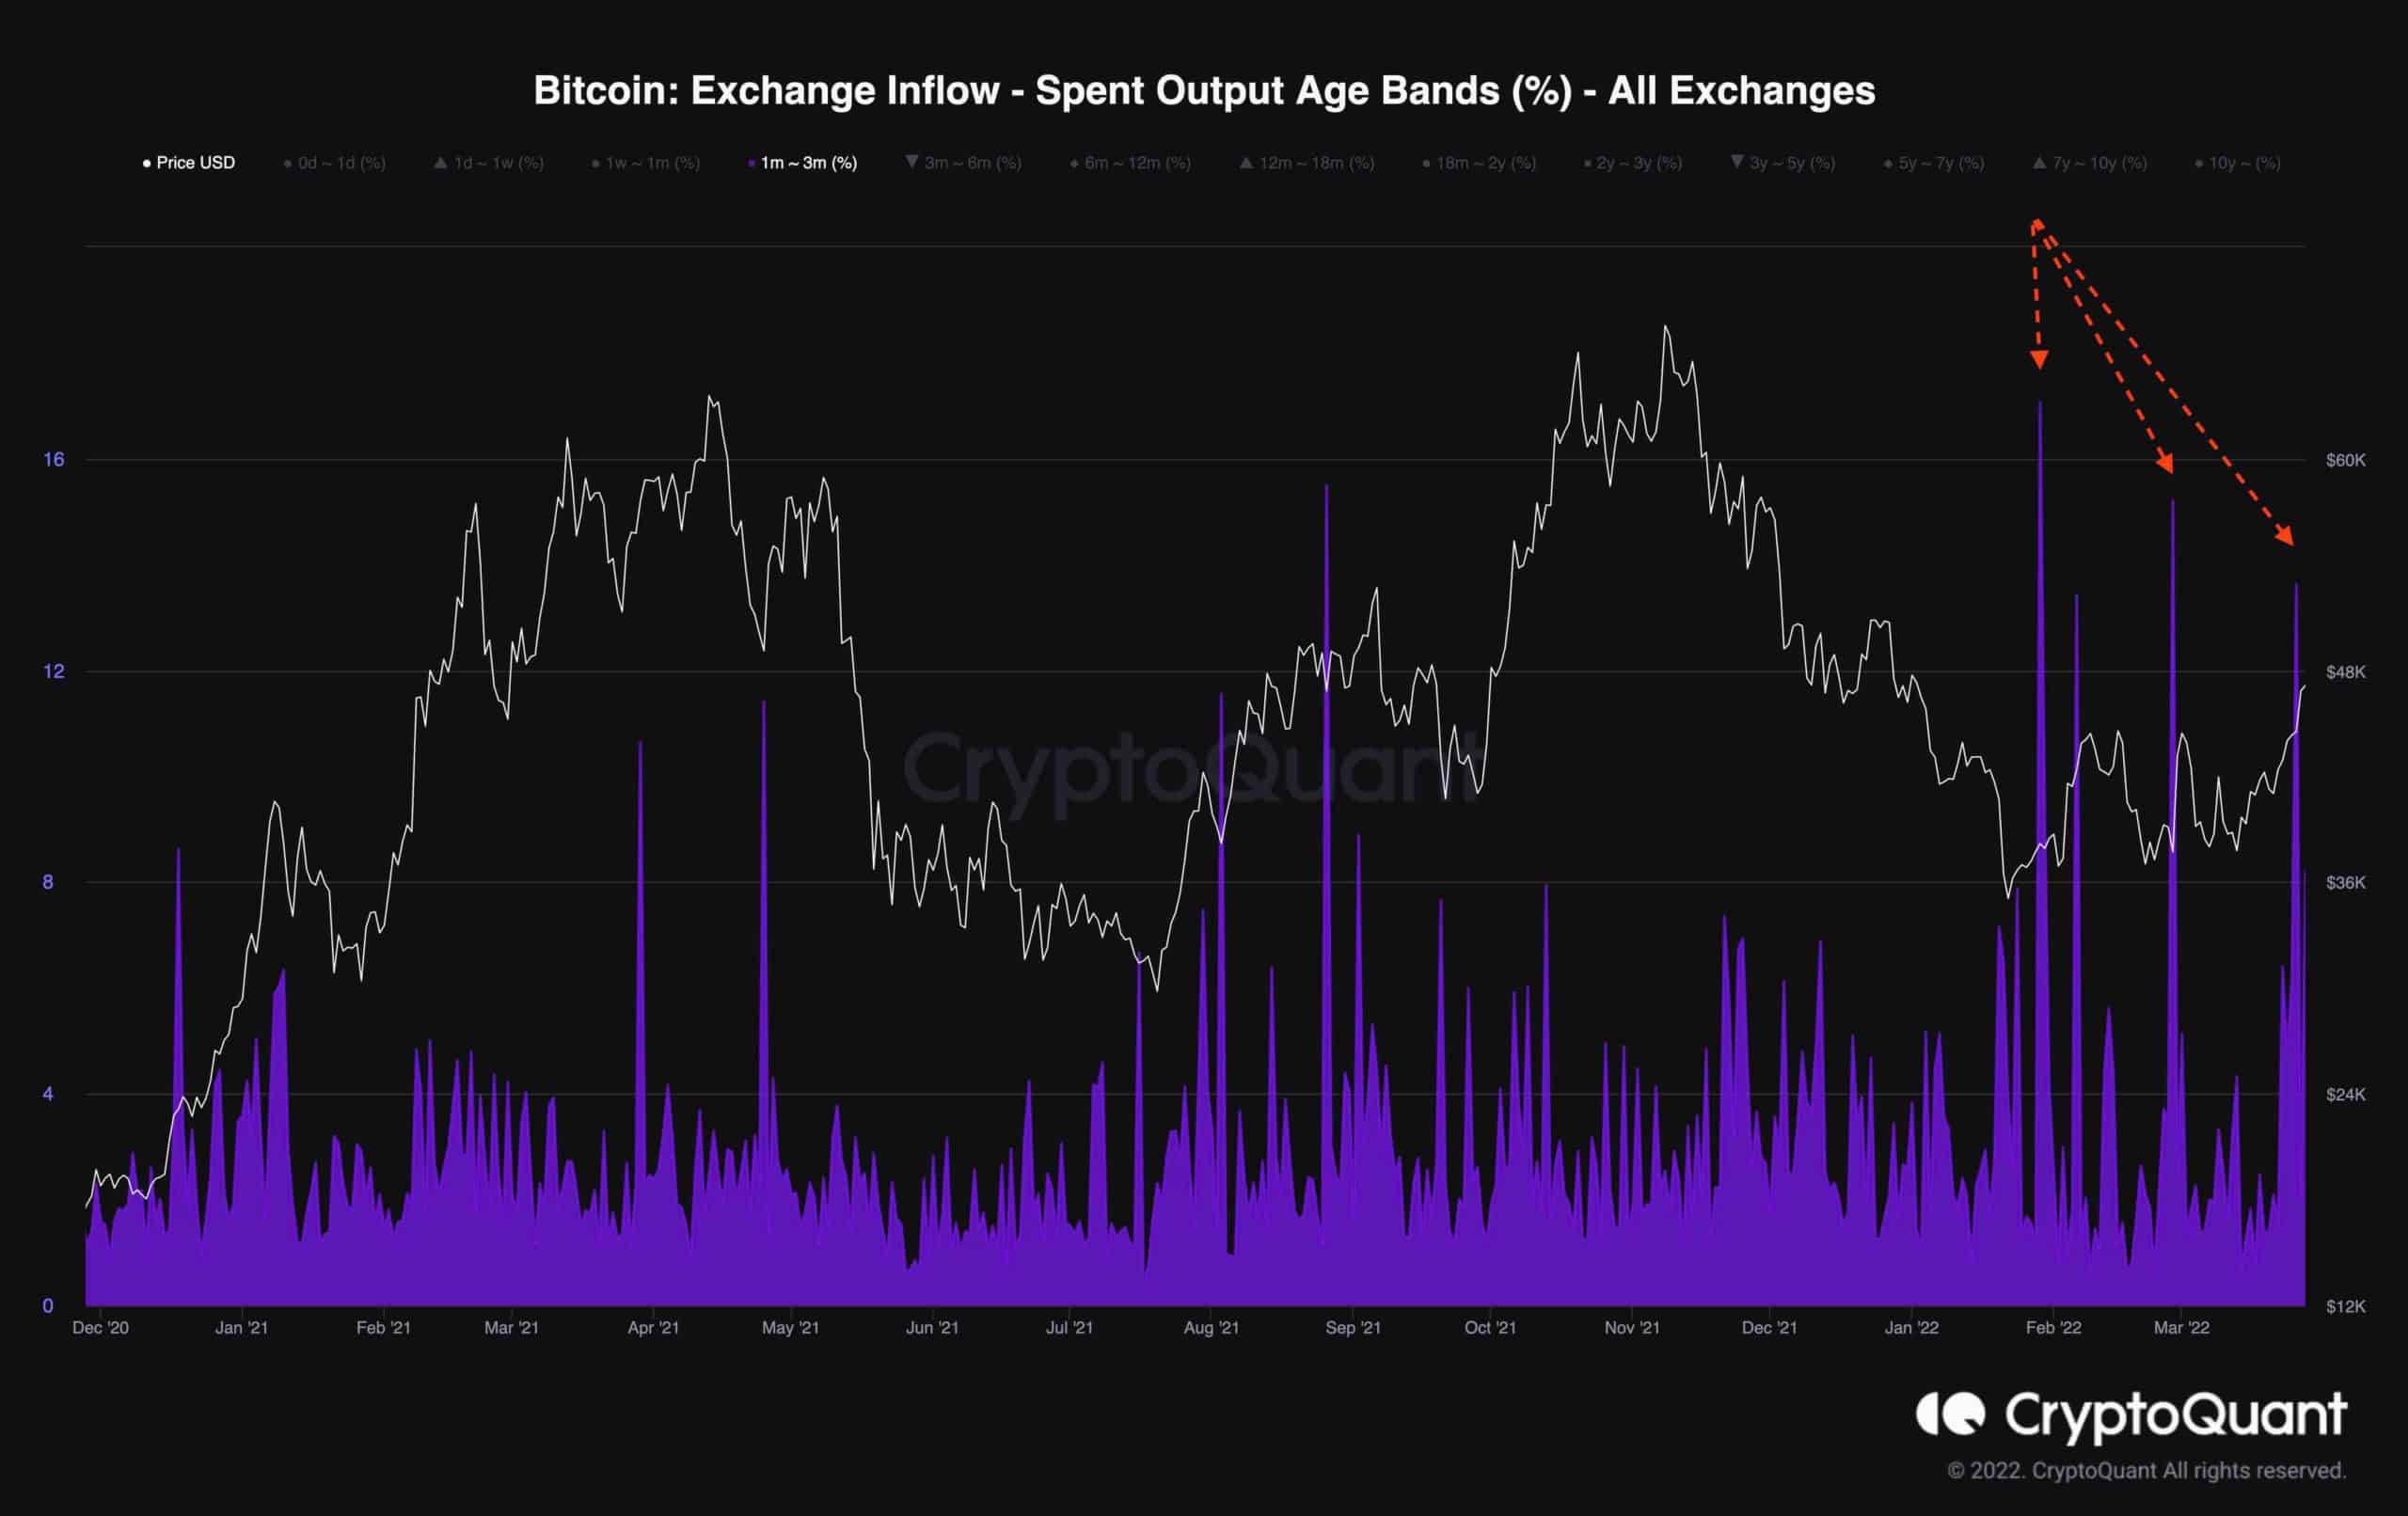
Based on data by CryptoQuant, the exchange inflow – SOAB measure for one to three month old coins – it is clear that short-term holders who have entered the market in the last few months are actively depositing their coins into exchanges. They are selling into the strength, as the price continues to move higher.
Furthermore, this is not the first time a similar behavior has been observed during this drop, as the chart shows three significant prior peaks.
These peaks might indicate either capitulation or the realization of marginal profit. Speculators who tried to buy the dip during the collapse usually gave up and sold at a loss as the market continued to drop. However, some may have accurately detected the bottom and accumulated at lower prices, and they now realize profits.