Bitcoin’s price rally slowed down after getting rejected at the 200-day moving average line amid the K range. The 1-Day Timeframe Technical Analysis by Edris The price dropped lower since the MA200 rejection and is currently retesting the 50-day and 100-day moving average lines. These MAs have also printed a bullish cross recently, as the 50-day MA has crossed above the 100-day MA. The K level is currently holding the price, is also a significant horizontal support level. This level was a resistance turned into support after a bullish breakout a few weeks ago. However, if this area fails to hold the price, a retest of the K zone would be a likely scenario. On the other hand, if the price rebounds from this support level, the K zone and the 200-day moving
Topics:
CryptoVizArt considers the following as important: Bitcoin (BTC) Price, BTC Analysis, BTCEUR, BTCGBP, btcusd, btcusdt
This could be interesting, too:
Chayanika Deka writes XRP, SOL, and ADA Inclusion in US Crypto Reserve Pushes Traders on Edge
Chayanika Deka writes Why Arthur Hayes Is Bullish on Bitcoin Under Trump’s Economic Strategy
Mandy Williams writes Why the Bitcoin Market Is Stuck—and the Key Metric That Could Change It: CryptoQuant CEO
Wayne Jones writes Metaplanet Acquires 156 BTC, Bringing Total Holdings to 2,391
Bitcoin’s price rally slowed down after getting rejected at the 200-day moving average line amid the $48K range.
The 1-Day Timeframe
Technical Analysis by Edris
The price dropped lower since the MA200 rejection and is currently retesting the 50-day and 100-day moving average lines. These MAs have also printed a bullish cross recently, as the 50-day MA has crossed above the 100-day MA.
The $42K level is currently holding the price, is also a significant horizontal support level. This level was a resistance turned into support after a bullish breakout a few weeks ago.
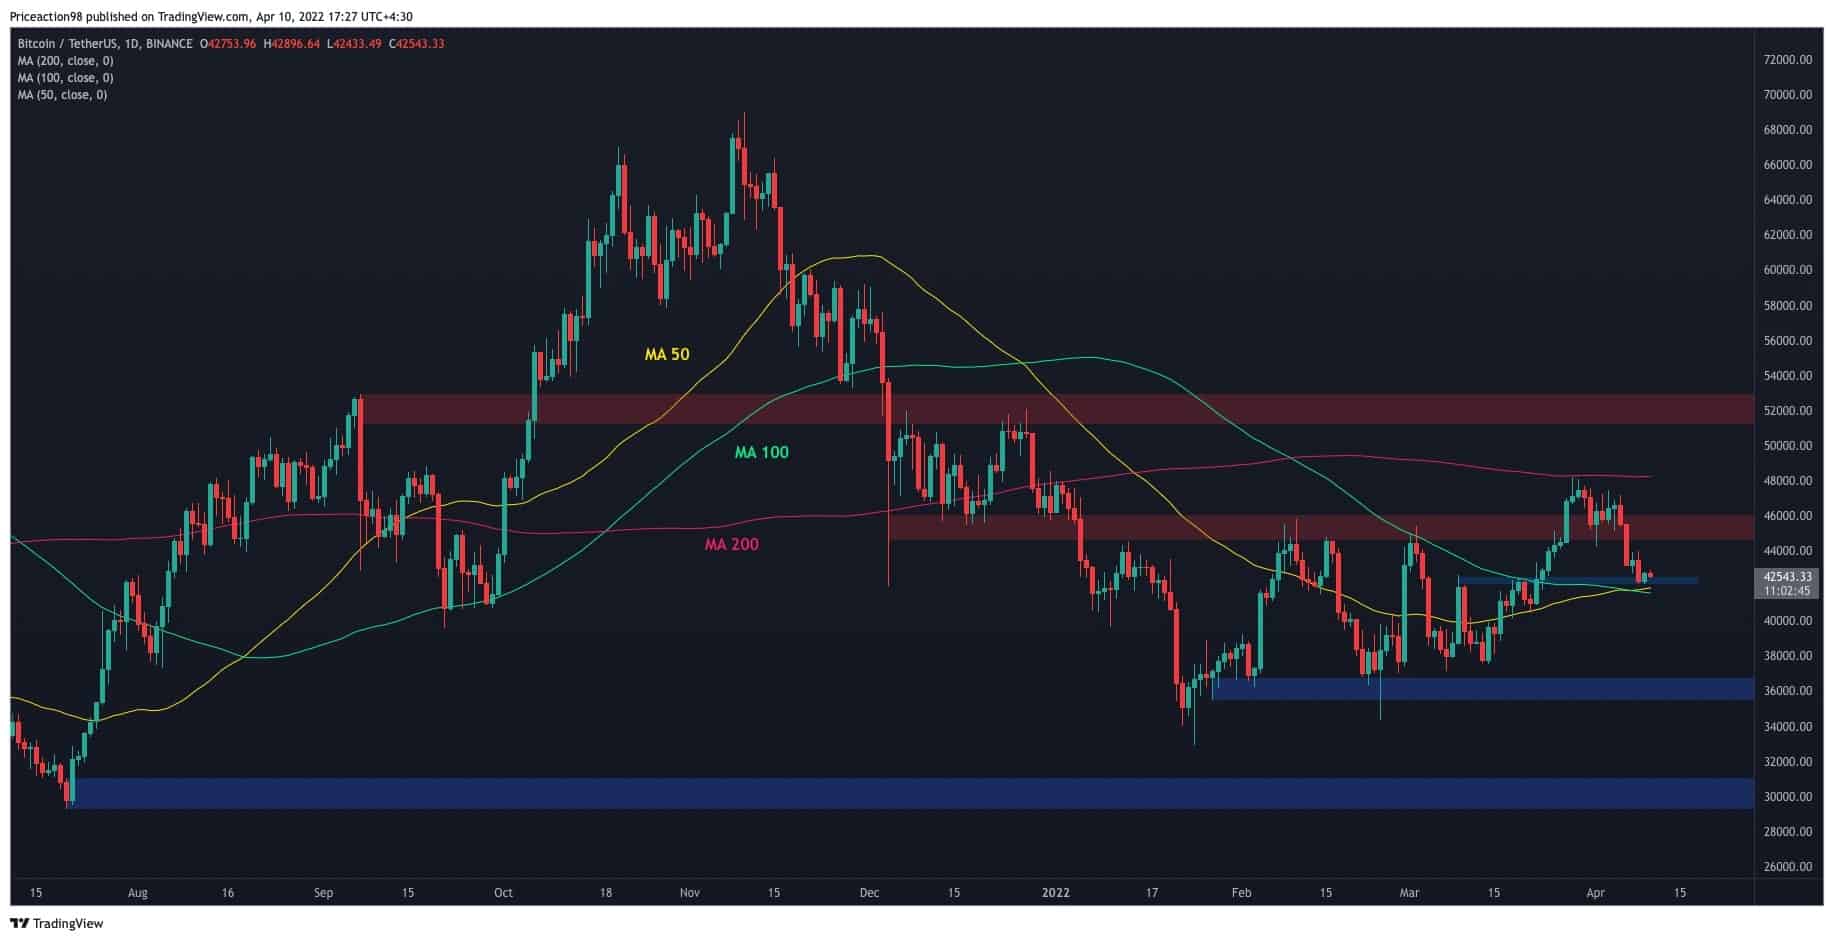
However, if this area fails to hold the price, a retest of the $36K zone would be a likely scenario.
On the other hand, if the price rebounds from this support level, the $48K zone and the 200-day moving average would be likely retested.
The 4-Hour Timeframe
On the 4-hour timeframe, it is evident that after the price has reached the top of the large bearish flag pattern, it has been rejected to the downside and made a lower high and a lower low.
This price action indicates that the bears are now controlling the market, and a new downtrend could be on the horizon.
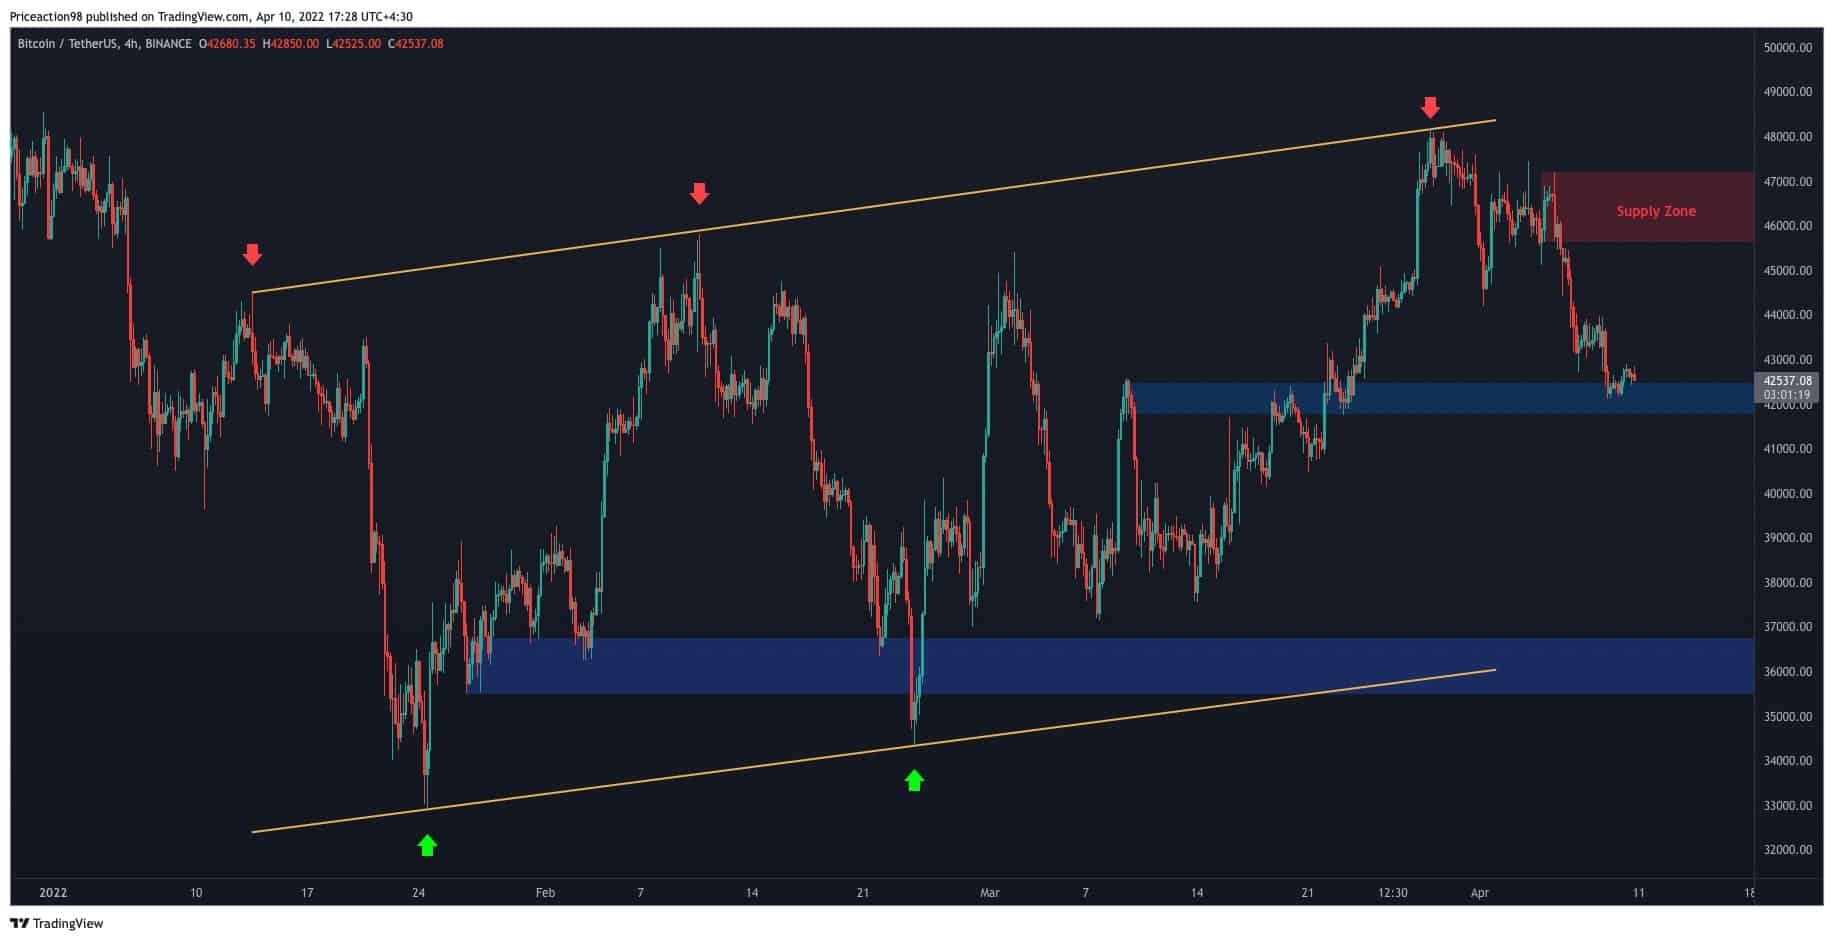
However, the $42K level might serve as solid support. From the bullish side – the critical supply zone remains around the $47K level, which could initiate the next bearish leg and higher low.
In the bearish scenario, if the price loses the $42K support, a retest of the $36K level and the bottom of the bearish flag would be imminent. A bearish breakout from the base of the flag would validate it and form a bearish continuation and probably a new lower low below the $33K bottom – the lowest level for the past months.