The recent unexpected price action in the market has led to some positive changes in the sentiment. However, there are many analysts that remained skeptical because of the uncertainty at the macro level. Here, we discuss the important technical confirmations for a mid-term trend reversal and investigate the holders’ behavior during the recent price downfall to .9K. Technical Analysis By: Grizzley Long Term Most technical analysts believe that consolidating the price below the weekly Ichimoku cloud is the end of the bitcoin bull run, or it will not be easy to recover to the levels above in the short term. A weekly candlestick closed under the cloud two weeks ago. But then the uptrend began, which did not allow the price to remain below the cloud longer. Therefore the
Topics:
CryptoVizArt considers the following as important: Bitcoin (BTC) Price, BTC Analysis, BTCEUR, BTCGBP, btcusd, btcusdt
This could be interesting, too:
Chayanika Deka writes XRP, SOL, and ADA Inclusion in US Crypto Reserve Pushes Traders on Edge
Chayanika Deka writes Why Arthur Hayes Is Bullish on Bitcoin Under Trump’s Economic Strategy
Mandy Williams writes Why the Bitcoin Market Is Stuck—and the Key Metric That Could Change It: CryptoQuant CEO
Wayne Jones writes Metaplanet Acquires 156 BTC, Bringing Total Holdings to 2,391
The recent unexpected price action in the market has led to some positive changes in the sentiment. However, there are many analysts that remained skeptical because of the uncertainty at the macro level.
Here, we discuss the important technical confirmations for a mid-term trend reversal and investigate the holders’ behavior during the recent price downfall to $32.9K.
Technical Analysis
By: Grizzley
Long Term
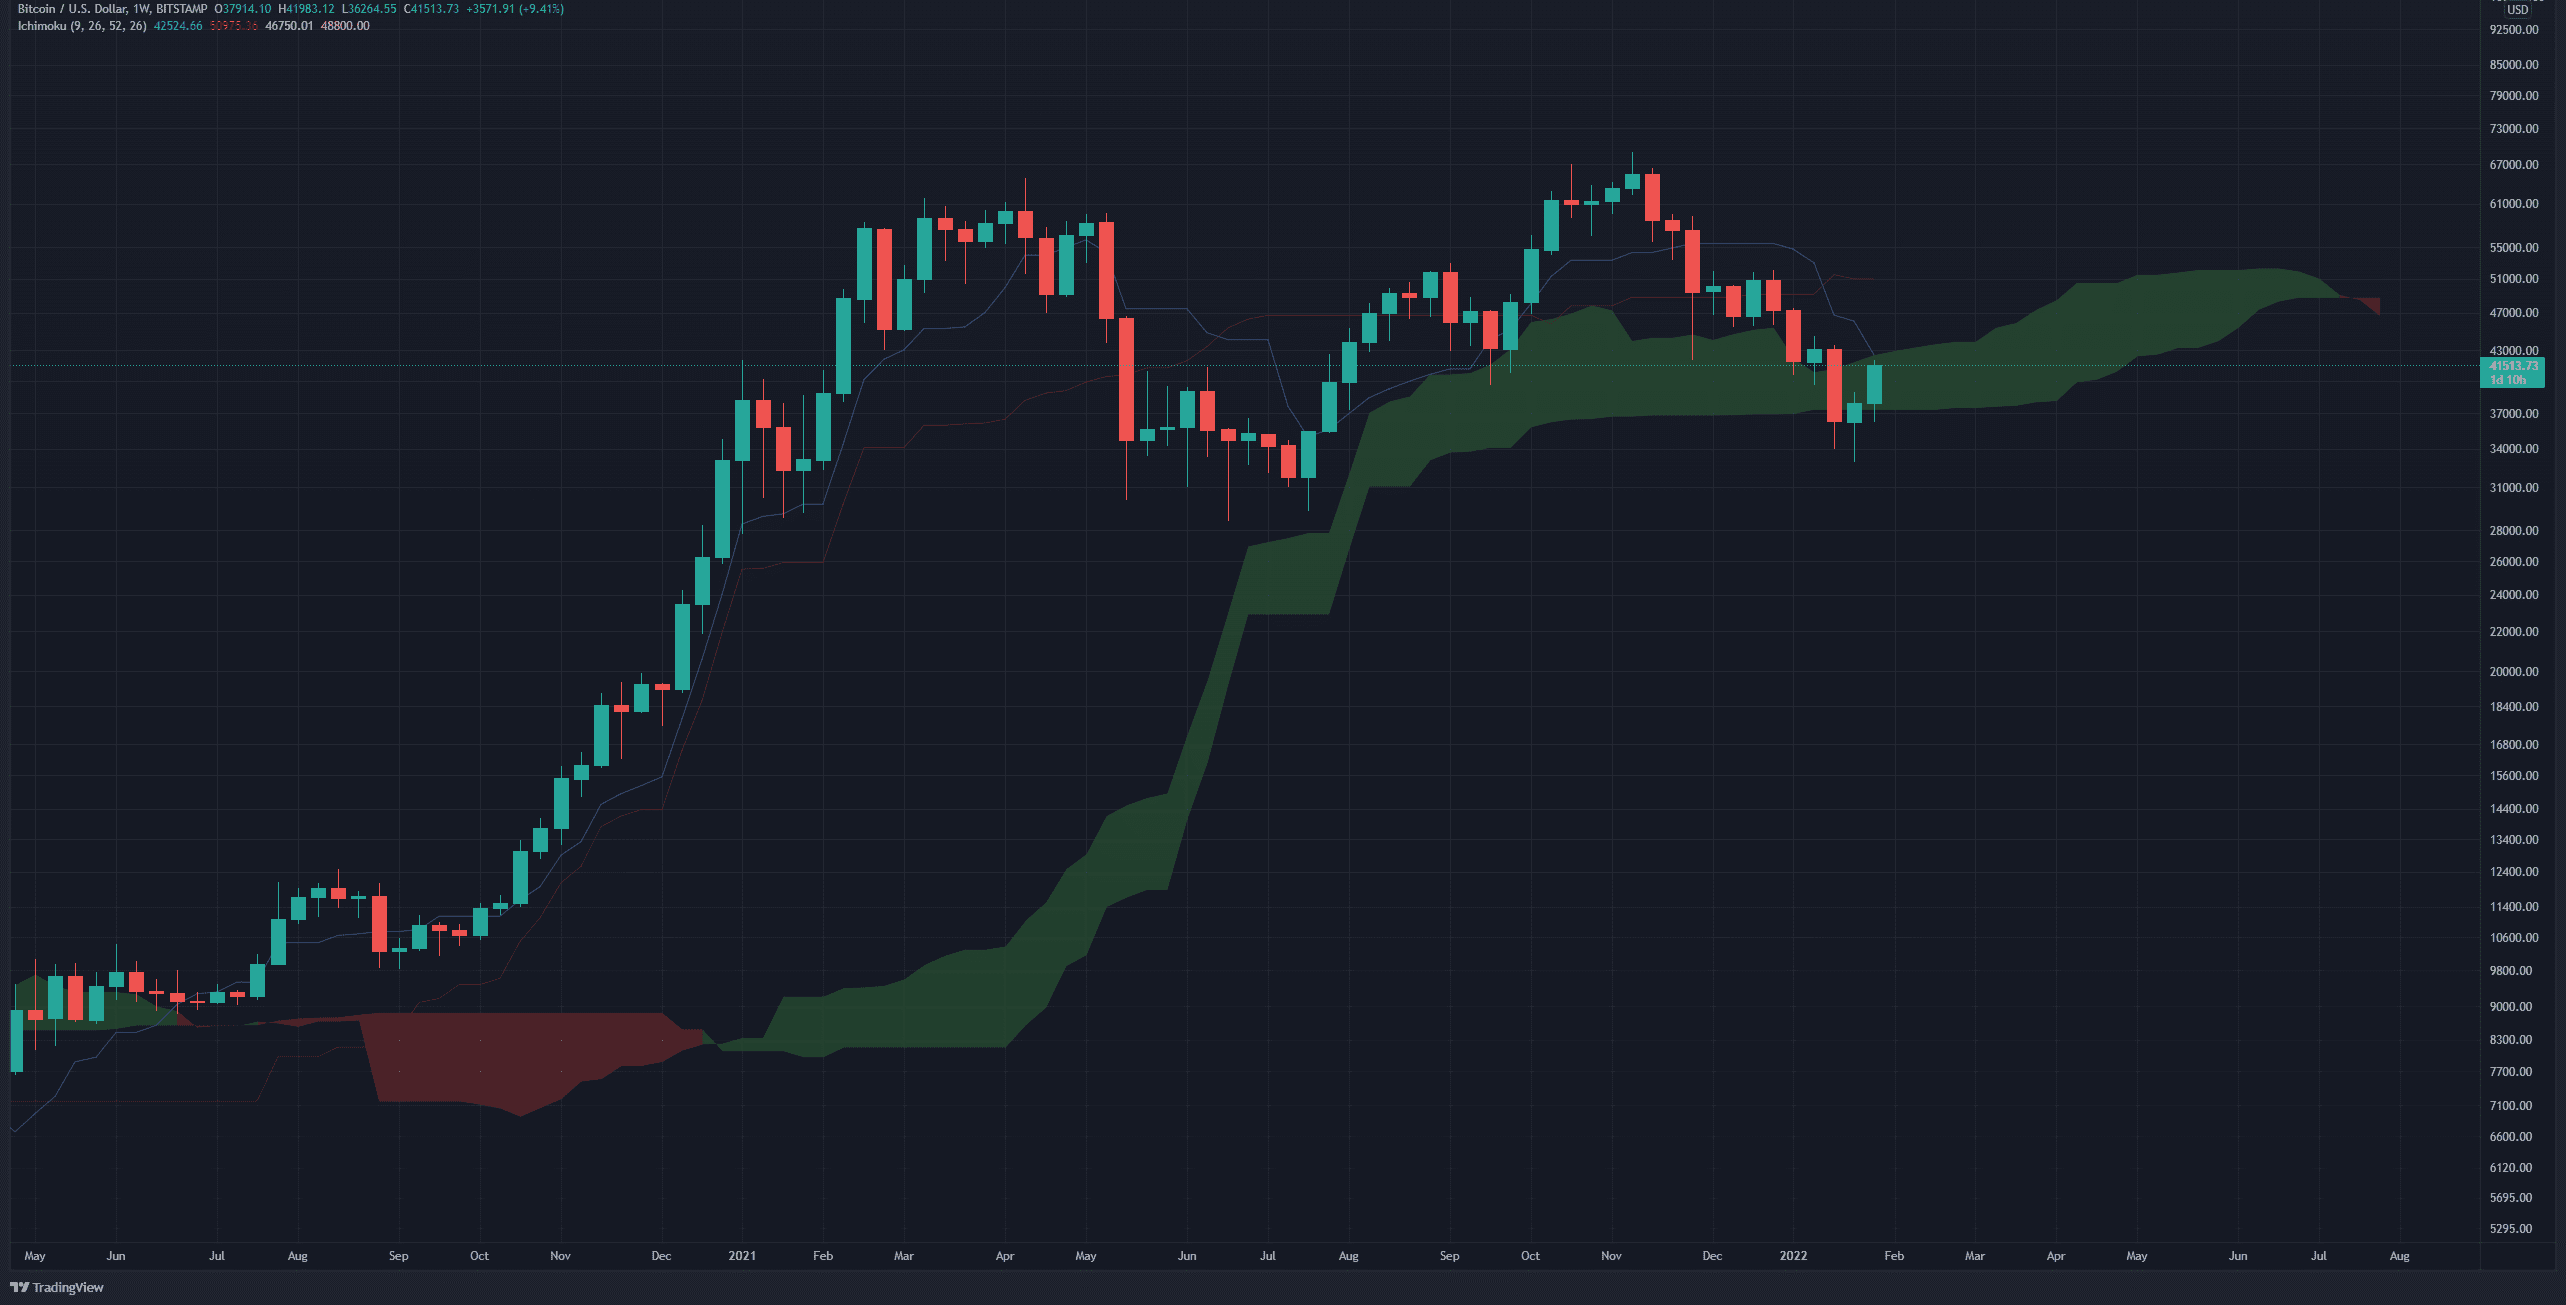
Most technical analysts believe that consolidating the price below the weekly Ichimoku cloud is the end of the bitcoin bull run, or it will not be easy to recover to the levels above in the short term. A weekly candlestick closed under the cloud two weeks ago. But then the uptrend began, which did not allow the price to remain below the cloud longer.
Therefore the uncertainty about the positive momentum is not over yet. At the moment, the price is struggling with the Kijensen, which frequently plays as resistance. Nevertheless, crossing above this dynamic resistance (~$43K) can send a positive signal to technical traders/analysts in the market.
Short term:
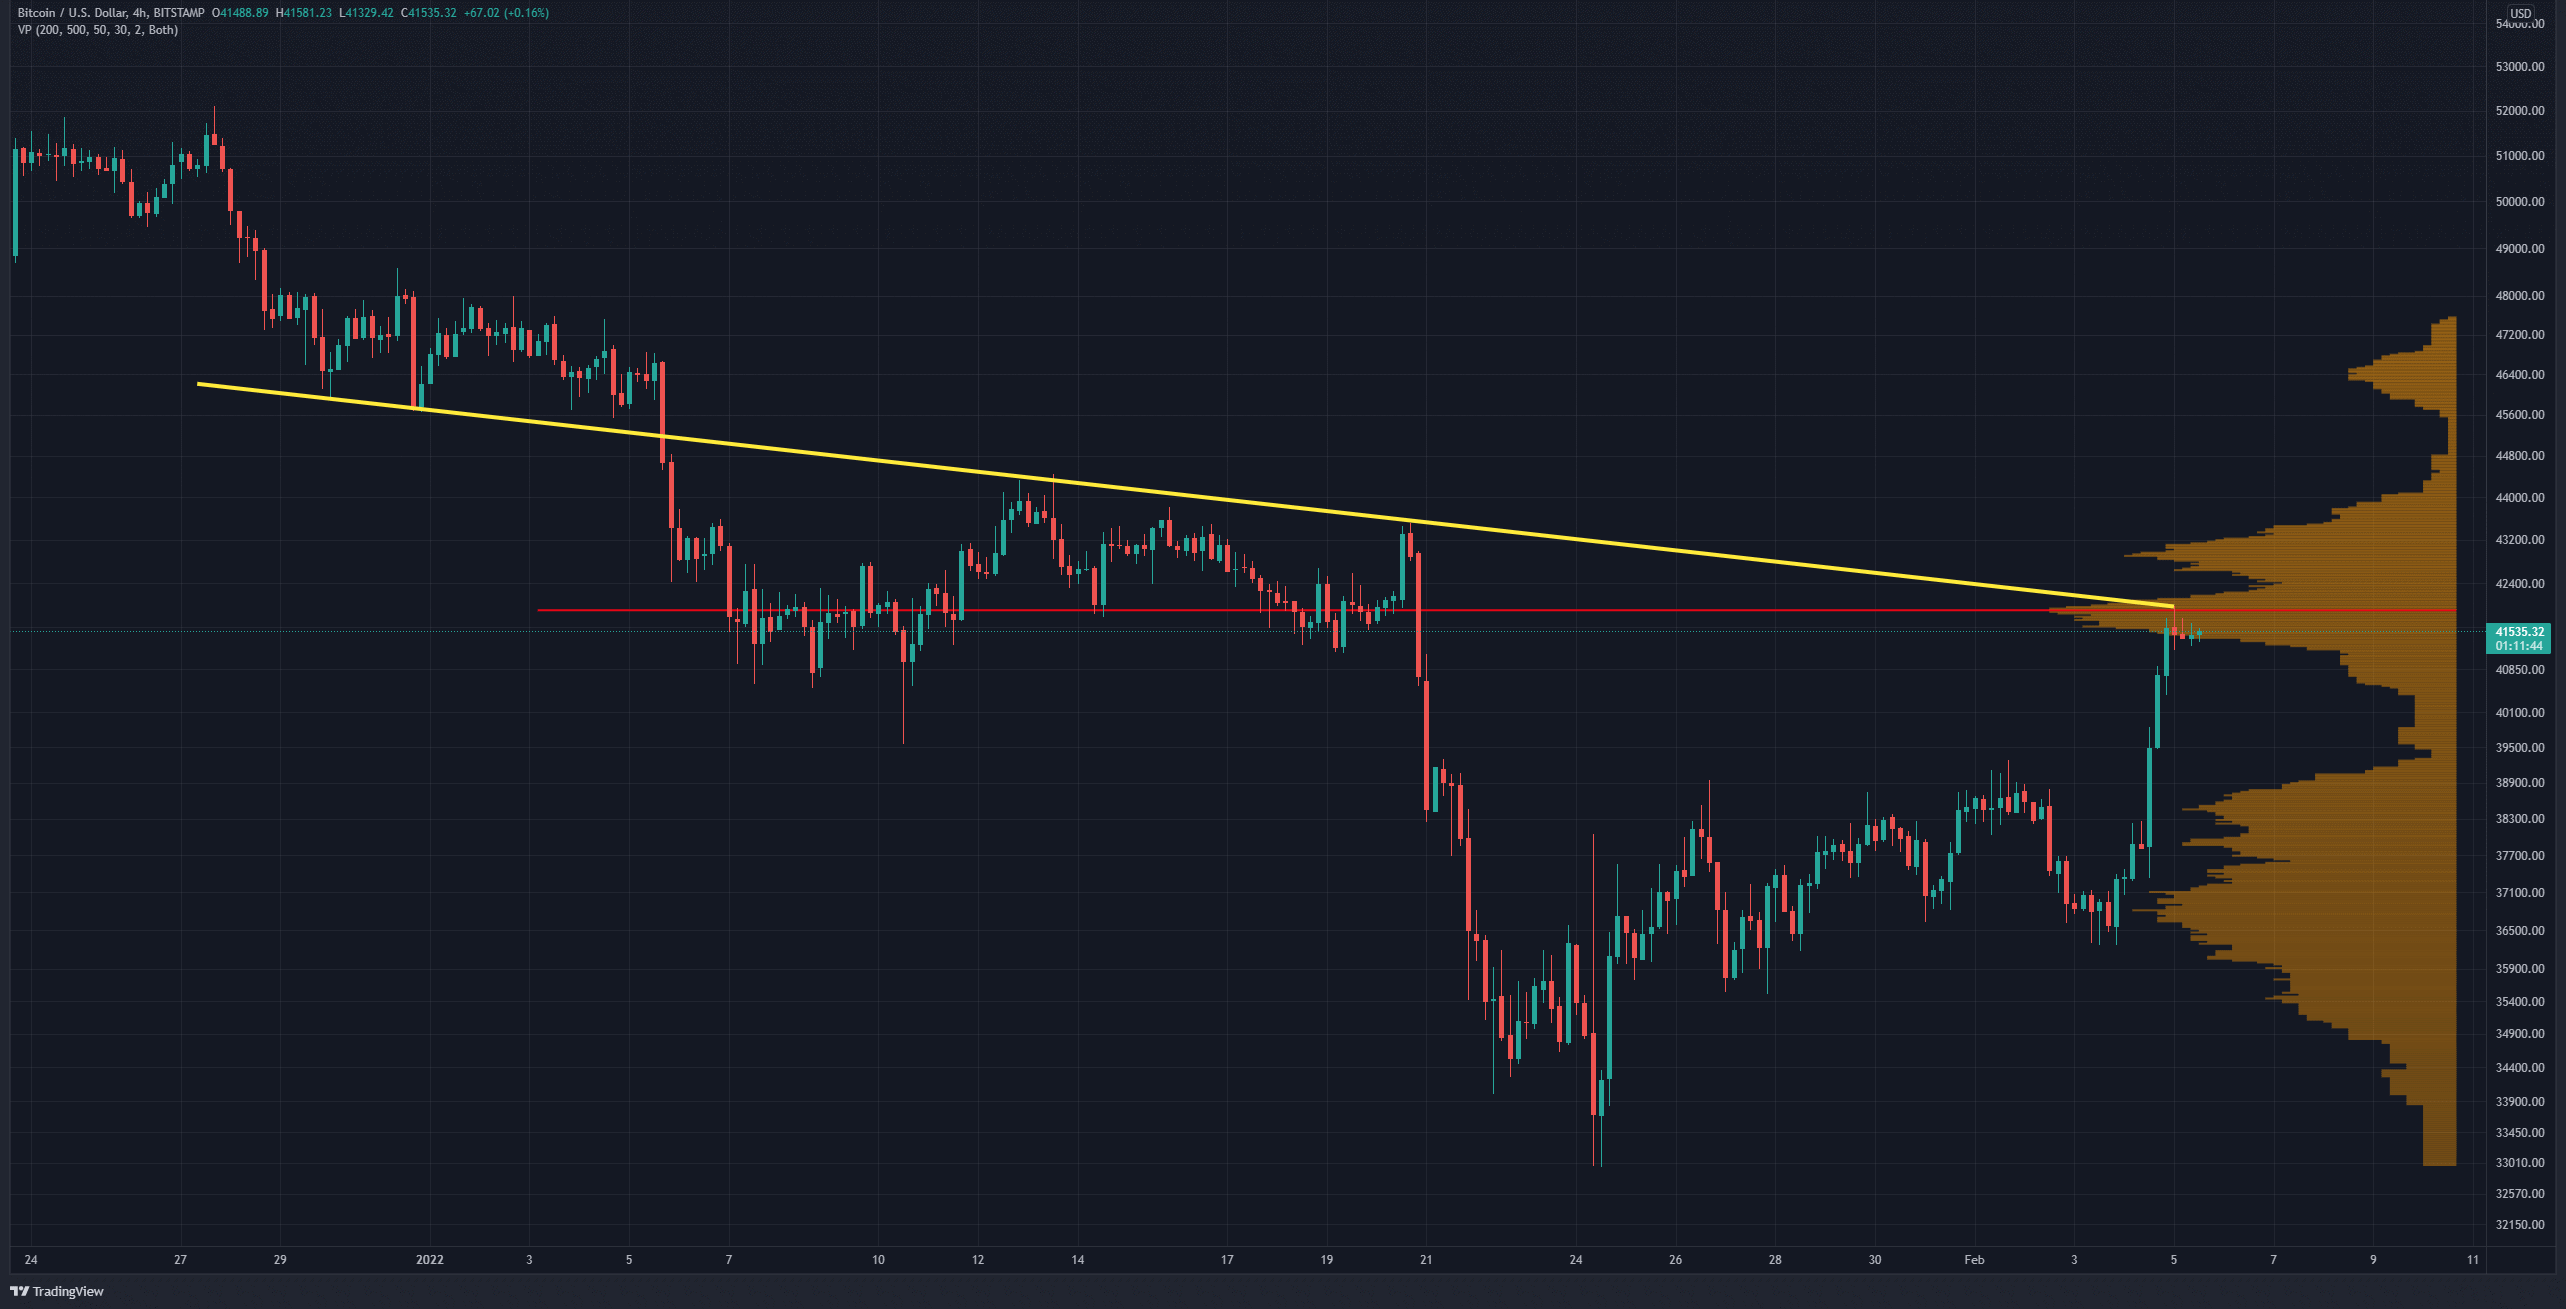
On the 4-hour timeframe, the intersection of the dynamic resistance (marked by the yellow line) and the POC line (highlighted by the red line) is interesting. The recent candlesticks show the weakness of the unexpected uptrend that started the day before. Bears tend to damp upward movements, and the bulls support retracted areas. The general rule is that crossing this zone and forming a higher high will usually be translated to confirming a downtrend’s reversal.
Onchain Analysis:
By: CryptoVizArt
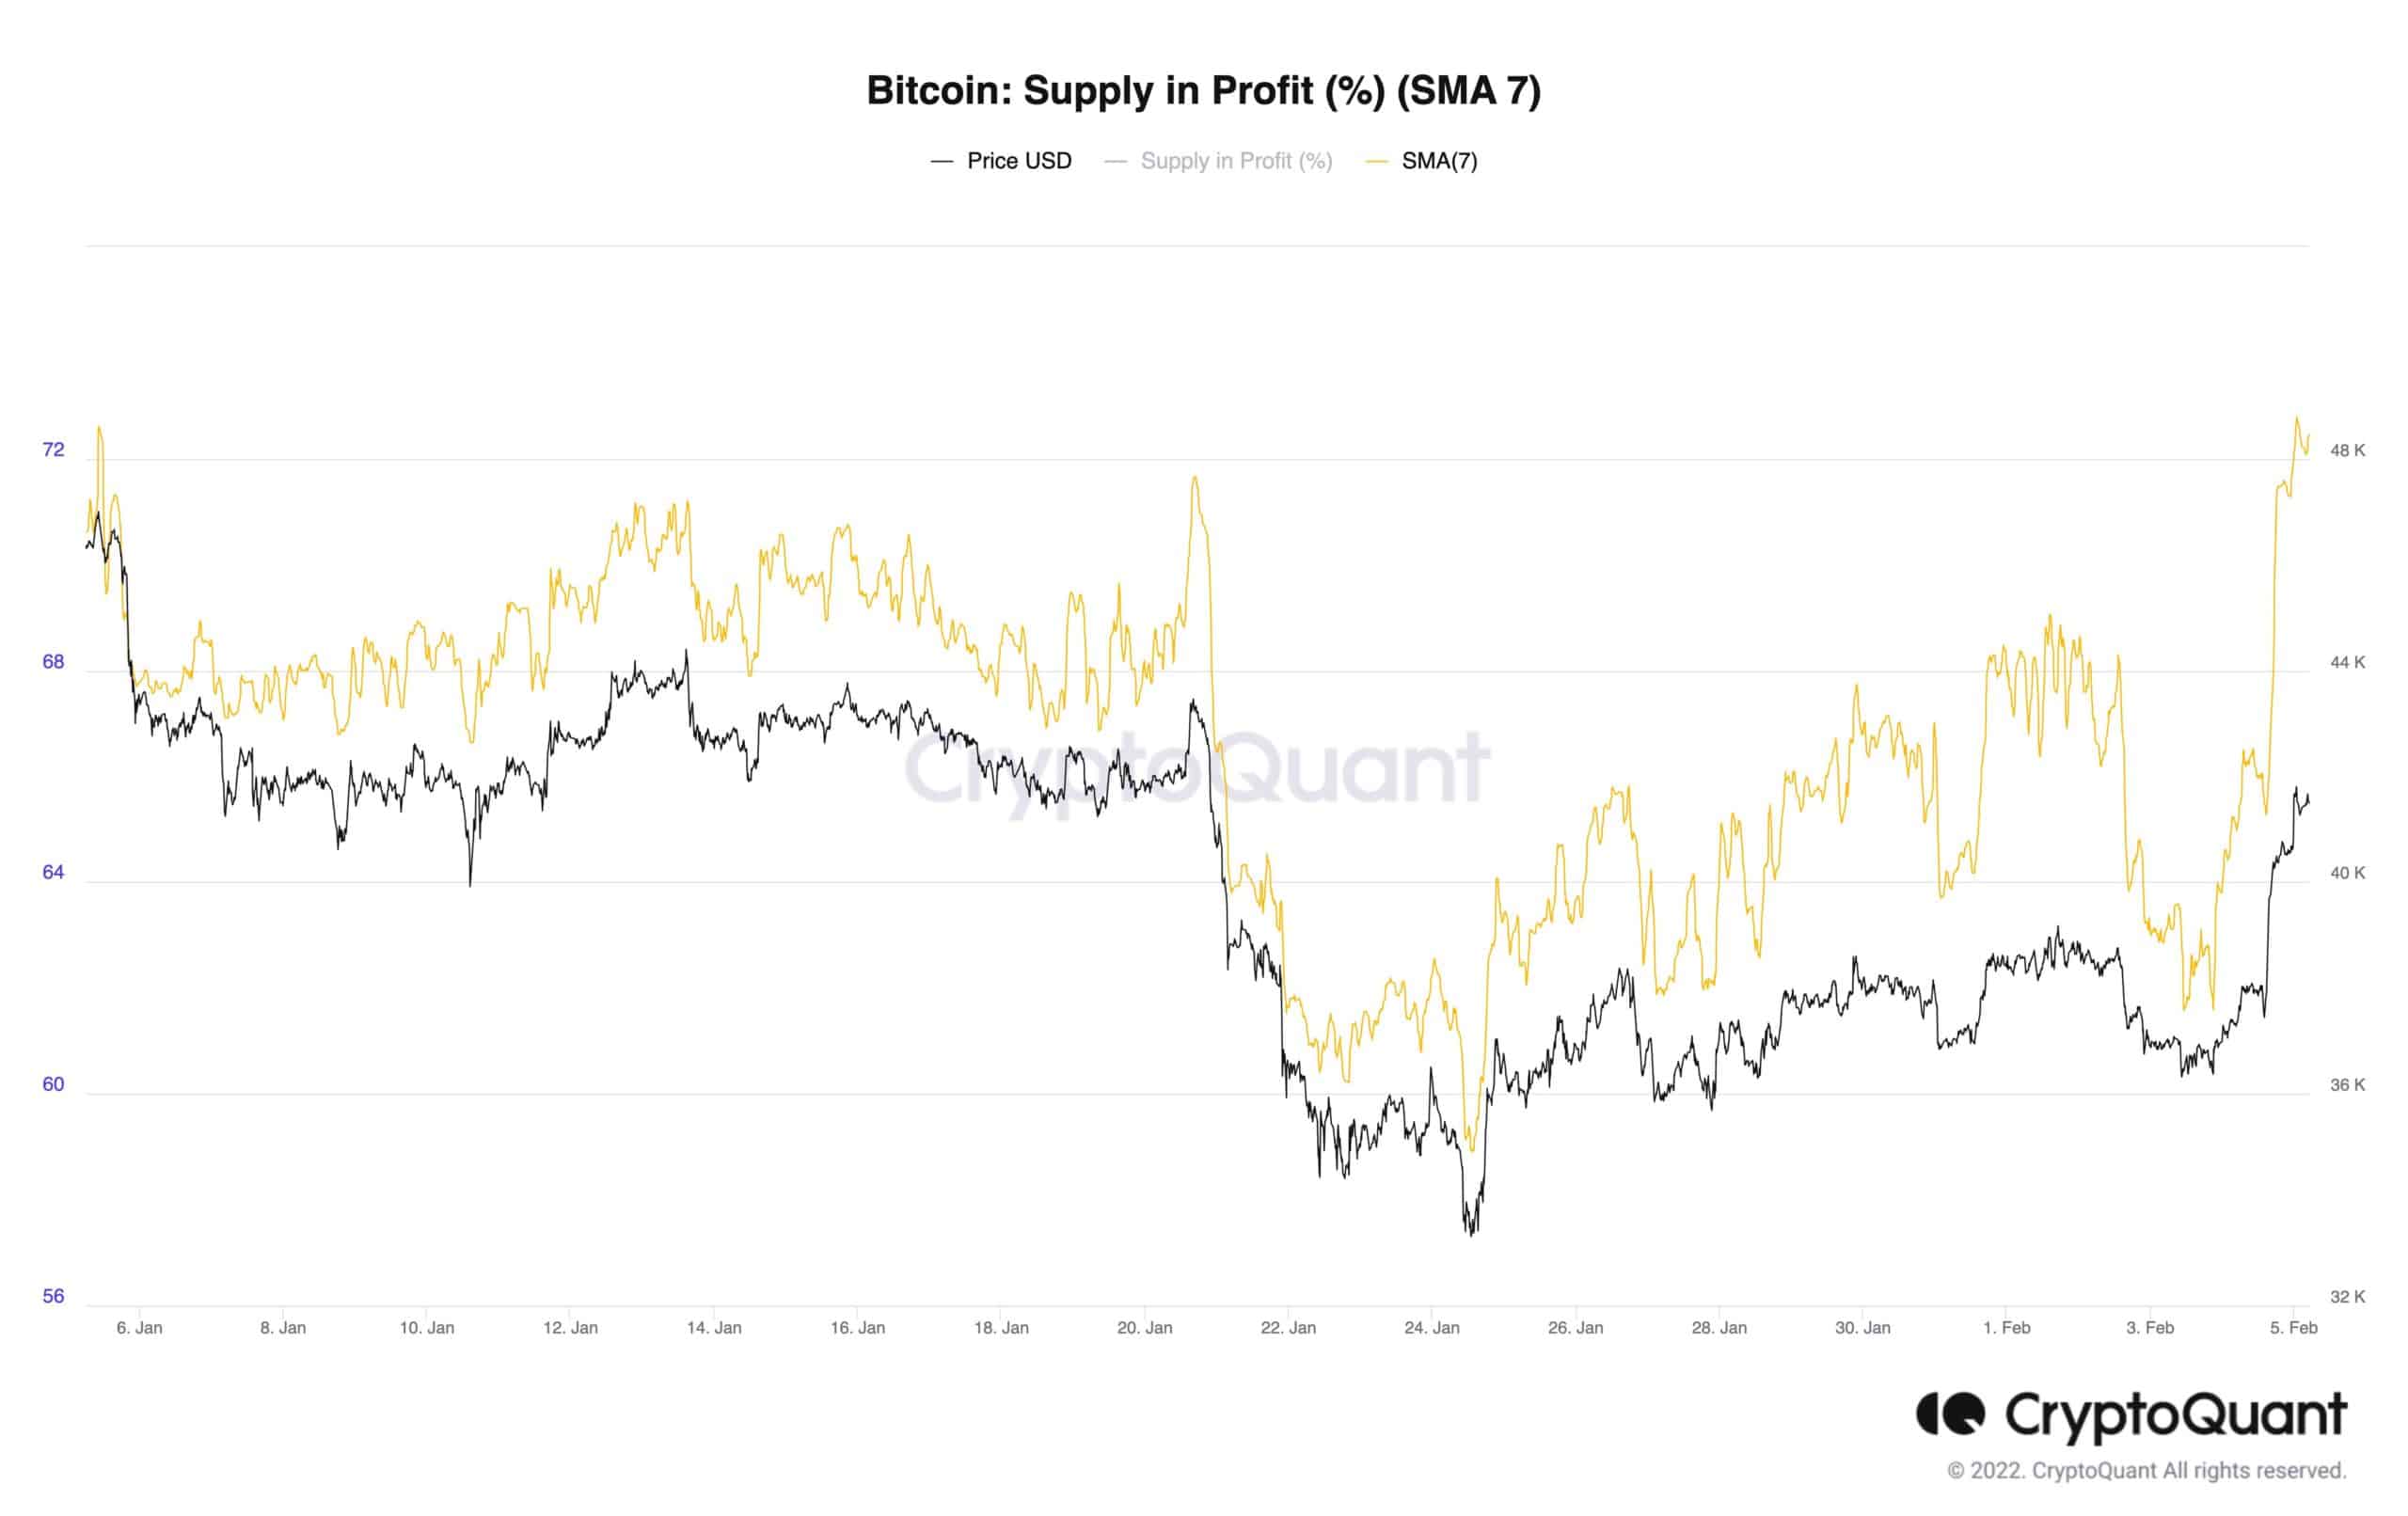
In light of the market structure, it took 14 days for bitcoin to reclaim the $41.3K level. Examining the percentage of supply-in-profit, during this correction down to $32.9K, only 6% of supply changes hand.
This small change in the percentage means the holding incentive has been dominant recently. This observation, compared to many former similar events, can confirm the illiquid supply in the market is unlikely to be deployed to exchanges because of short-term volatility. In other words, the identity of long-term holders, in this cycle, has changed significantly.