During the recent weeks, the cryptocurrency markets have plunged due to fear at the macro-level (risk off). In this analysis, we will take a closer look at the bitcoin price from the Technical, Onchain, and Options Markt standpoints and discuss the possible scenarios in the short and mid-term. Technical Analysis By: Shayan Long-Term Analysis We can observe how the price organically evolves into a larger corrective structure following the first bullish impulse phase. A few swing highs and lows appear, which assist in identifying a corrective structure. In the bigger picture, the BTC price made a double top, ascending channel, and Head and Shoulders pattern from the region of the all-time high (November 10, 2021), providing us with a sell confluence. Since November, the BTC
Topics:
CryptoVizArt considers the following as important: Bitcoin (BTC) Price, BTC Analysis, BTCEUR, BTCGBP, btcusd, btcusdt
This could be interesting, too:
Chayanika Deka writes XRP, SOL, and ADA Inclusion in US Crypto Reserve Pushes Traders on Edge
Chayanika Deka writes Why Arthur Hayes Is Bullish on Bitcoin Under Trump’s Economic Strategy
Mandy Williams writes Why the Bitcoin Market Is Stuck—and the Key Metric That Could Change It: CryptoQuant CEO
Wayne Jones writes Metaplanet Acquires 156 BTC, Bringing Total Holdings to 2,391
During the recent weeks, the cryptocurrency markets have plunged due to fear at the macro-level (risk off). In this analysis, we will take a closer look at the bitcoin price from the Technical, Onchain, and Options Markt standpoints and discuss the possible scenarios in the short and mid-term.
Technical Analysis
By: Shayan
Long-Term Analysis
We can observe how the price organically evolves into a larger corrective structure following the first bullish impulse phase. A few swing highs and lows appear, which assist in identifying a corrective structure.
In the bigger picture, the BTC price made a double top, ascending channel, and Head and Shoulders pattern from the region of the all-time high (November 10, 2021), providing us with a sell confluence.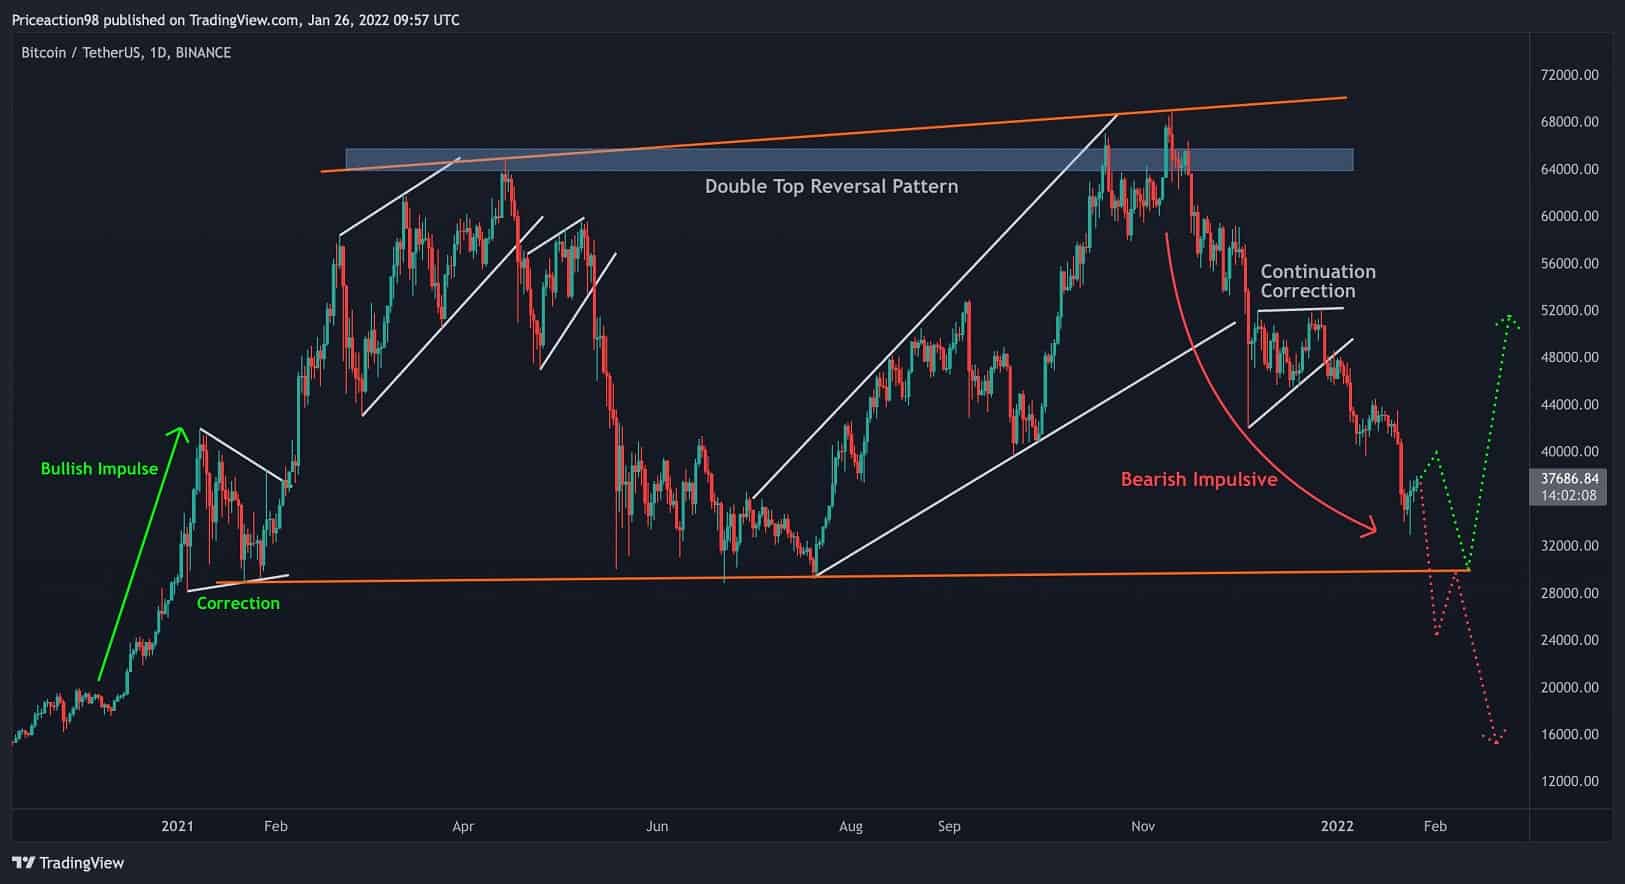
Since November, the BTC price has been in a downtrend, with smaller time frame’s corrections. A consolidation might occur because we haven’t reached the prior swing lows, pushing the price down to the previous higher time frame (HTF) lows and completing the whole pattern.
It’s critical to wait and watch whether any positive reversal price action forms until the price reaches the bottom region (marked by the orange line on the above chart). These confirmations are important in determining if the price can restart another bullish leg.
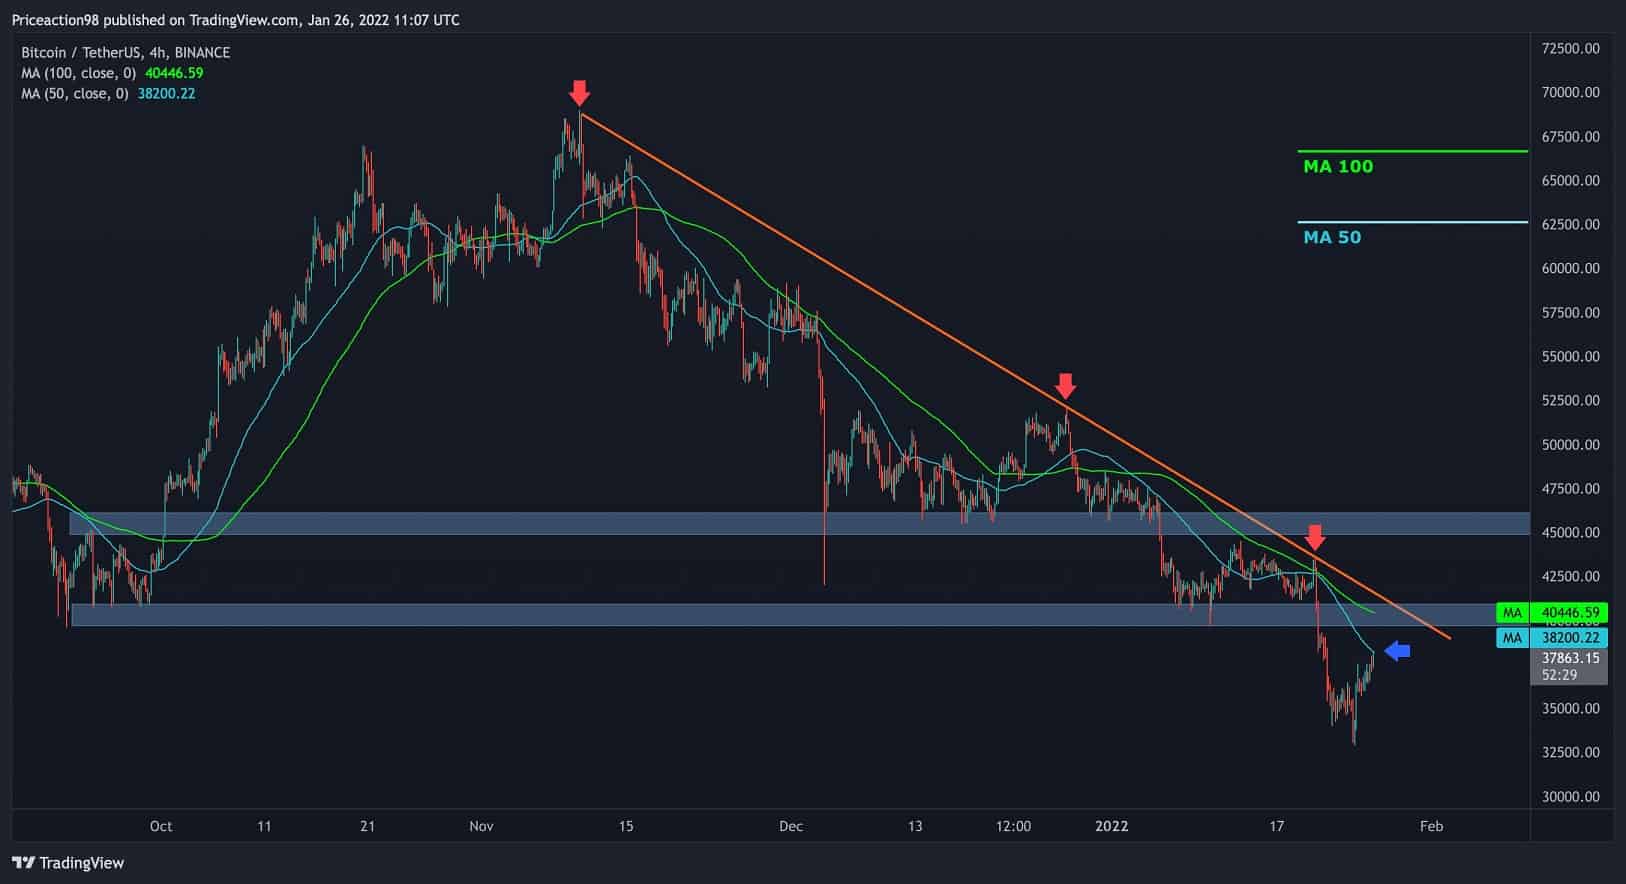
Short-Term Analysis
As shown in the following 4-hour time frame chart, the price is in a clear downtrend, which started since BTC hit ATH at $69K.
The marked ascending trendline has been acting as substantial resistance to the price. Bitcoin has many significant resistance levels on its way up to reclaim the $40-50K price range, so it has to form a higher high pattern to bounce back and start a fresh rally.
In case bears continue, then further support level is the previous low in the higher time frames, which is the $30K zone.
Onchain Analysis
By: Edris
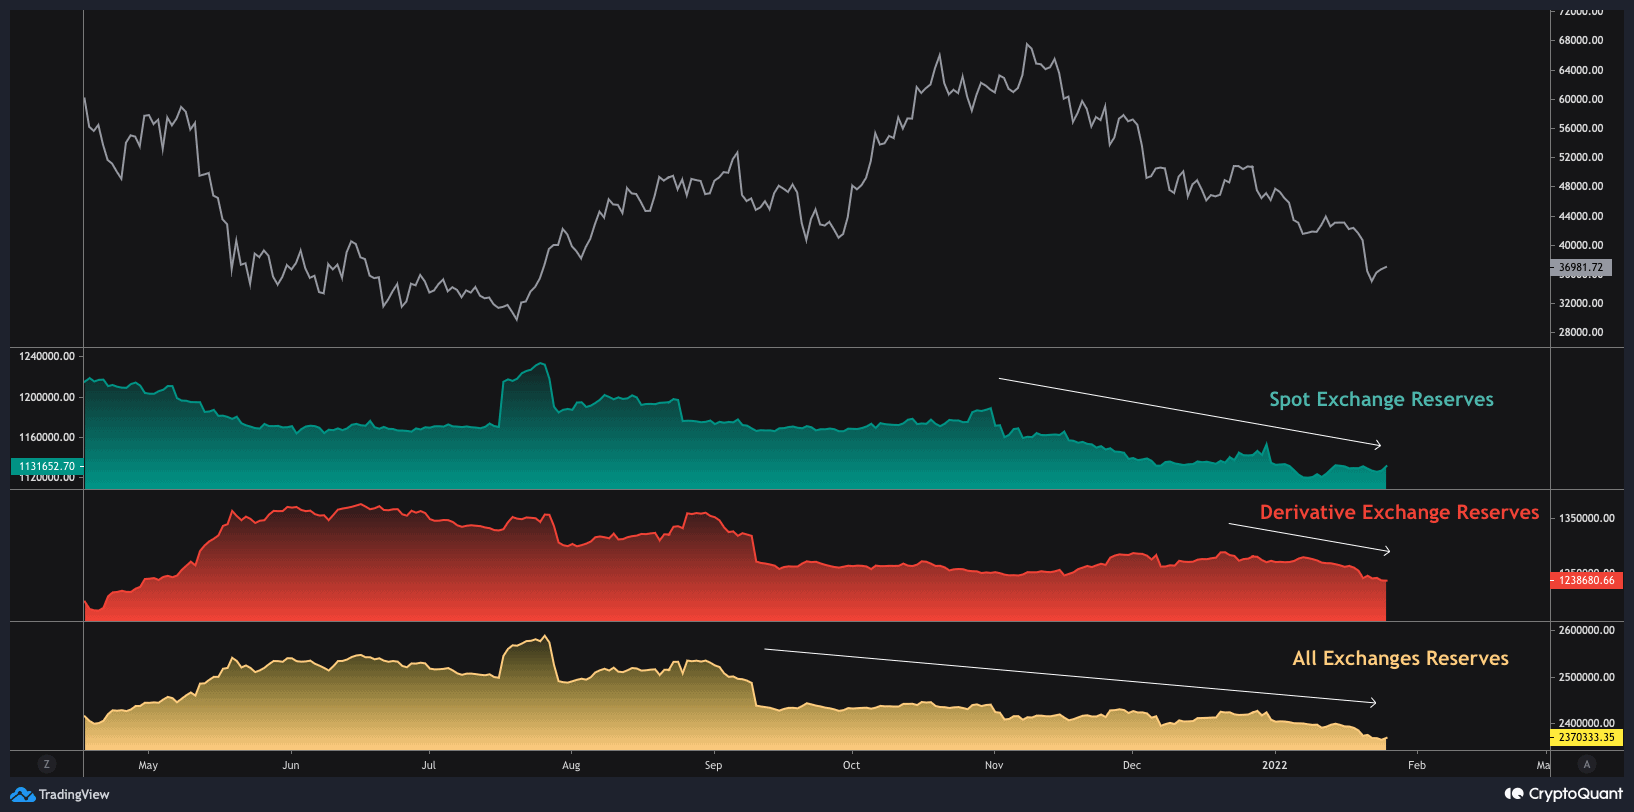
One of the key metrics signaling an imminent bearish momentum back in Q4 of 2021 was the rising Derivative Exchange Reserves.
Asymmetrically, the spot exchange reserves have been in a long-term depletion, and this contradiction indicates that the dips got quickly bought and withdrawn from the Spot exchanges. So, it is evident that we are in an accumulation phase, which is bullish for the mid to long term.
Options Market Analysis
By: NEDA
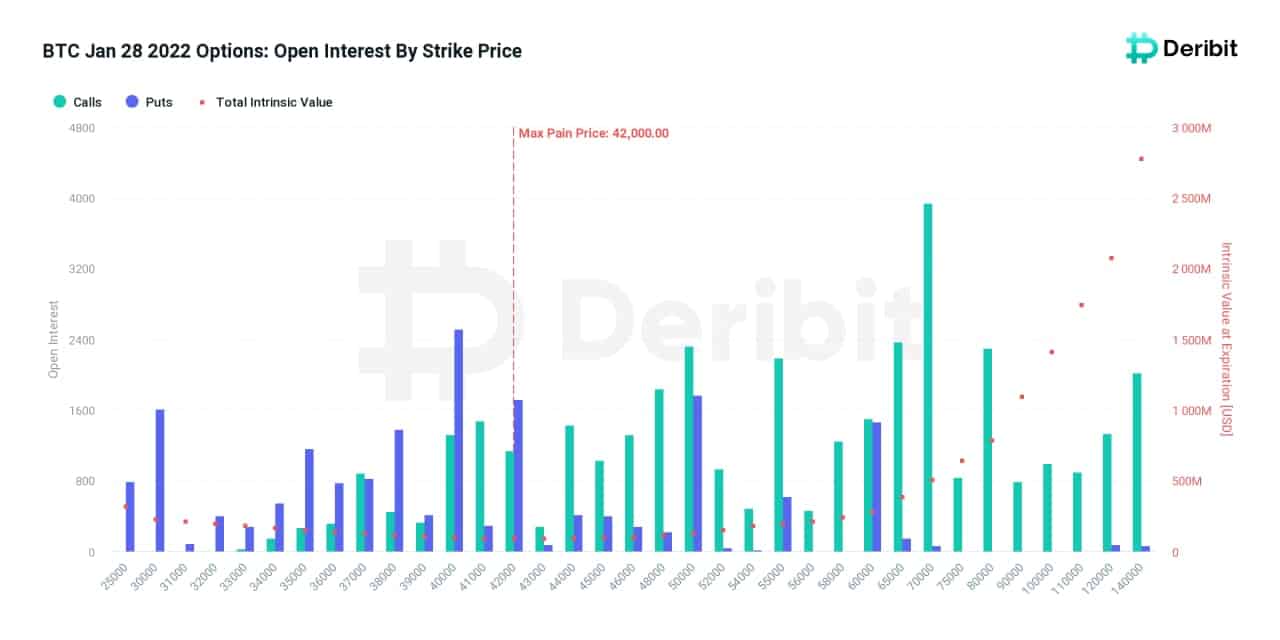
This Friday, January 28th, approximately $2.1B worth of bitcoin options contracts will expire on Deribit. This is the most important expiry for this month.
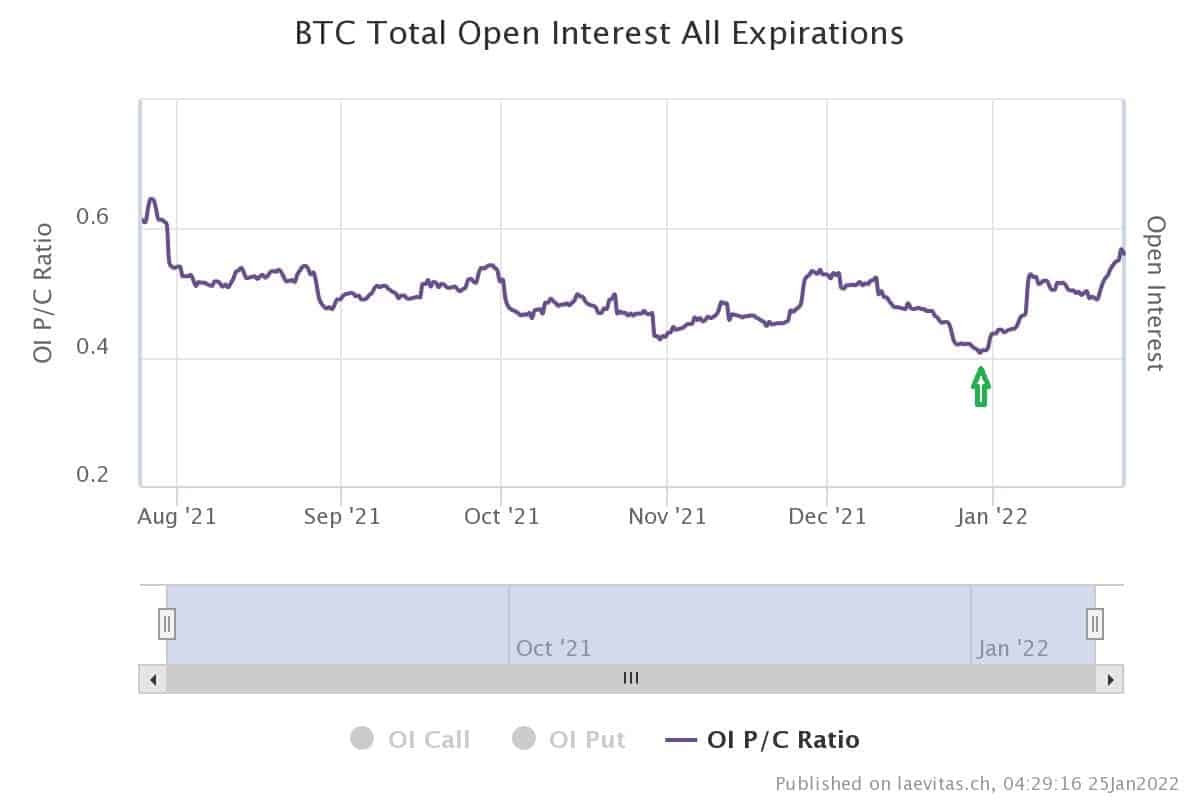
Max pain price is $42K, and the P/C Ratio is 0.5. According to extreme fear in the market and spot sell-off, options traders sold calls and bought puts in order to hedge any downside due to the upcoming Fed’s meeting (19:30 UTC on Wednesday). P/C Ratio has increased since January, indicating a bearish sentiment in the options market.