After getting rejected by the mid-term descending trendline for several months, Bitcoin finally broke above this obstacle and now attempting to surpass the 100-day moving average line. However, the momentum hasn’t turned bullish yet, whereas BTC had formed a bearish reversal pattern in the lower timeframes. As of yet, there is no sign of a trend reversal in the price action. Technical Analysis By Shayan The Daily Chart Bitcoin has formed a bearish triangle pattern and found support at the lower boundary near the K range until it recently broke above the triangle. Typically, a breakout from the upper edge of a bearish triangle is considered a bullish signal for the price. However, the market conditions are slightly different now, with some significant resistance levels
Topics:
CryptoVizArt considers the following as important: Bitcoin (BTC) Price, BTC Analysis, btcusd, btcusdt
This could be interesting, too:
Chayanika Deka writes XRP, SOL, and ADA Inclusion in US Crypto Reserve Pushes Traders on Edge
Chayanika Deka writes Why Arthur Hayes Is Bullish on Bitcoin Under Trump’s Economic Strategy
Mandy Williams writes Why the Bitcoin Market Is Stuck—and the Key Metric That Could Change It: CryptoQuant CEO
Wayne Jones writes Metaplanet Acquires 156 BTC, Bringing Total Holdings to 2,391
After getting rejected by the mid-term descending trendline for several months, Bitcoin finally broke above this obstacle and now attempting to surpass the 100-day moving average line.
However, the momentum hasn’t turned bullish yet, whereas BTC had formed a bearish reversal pattern in the lower timeframes. As of yet, there is no sign of a trend reversal in the price action.
Technical Analysis
By Shayan
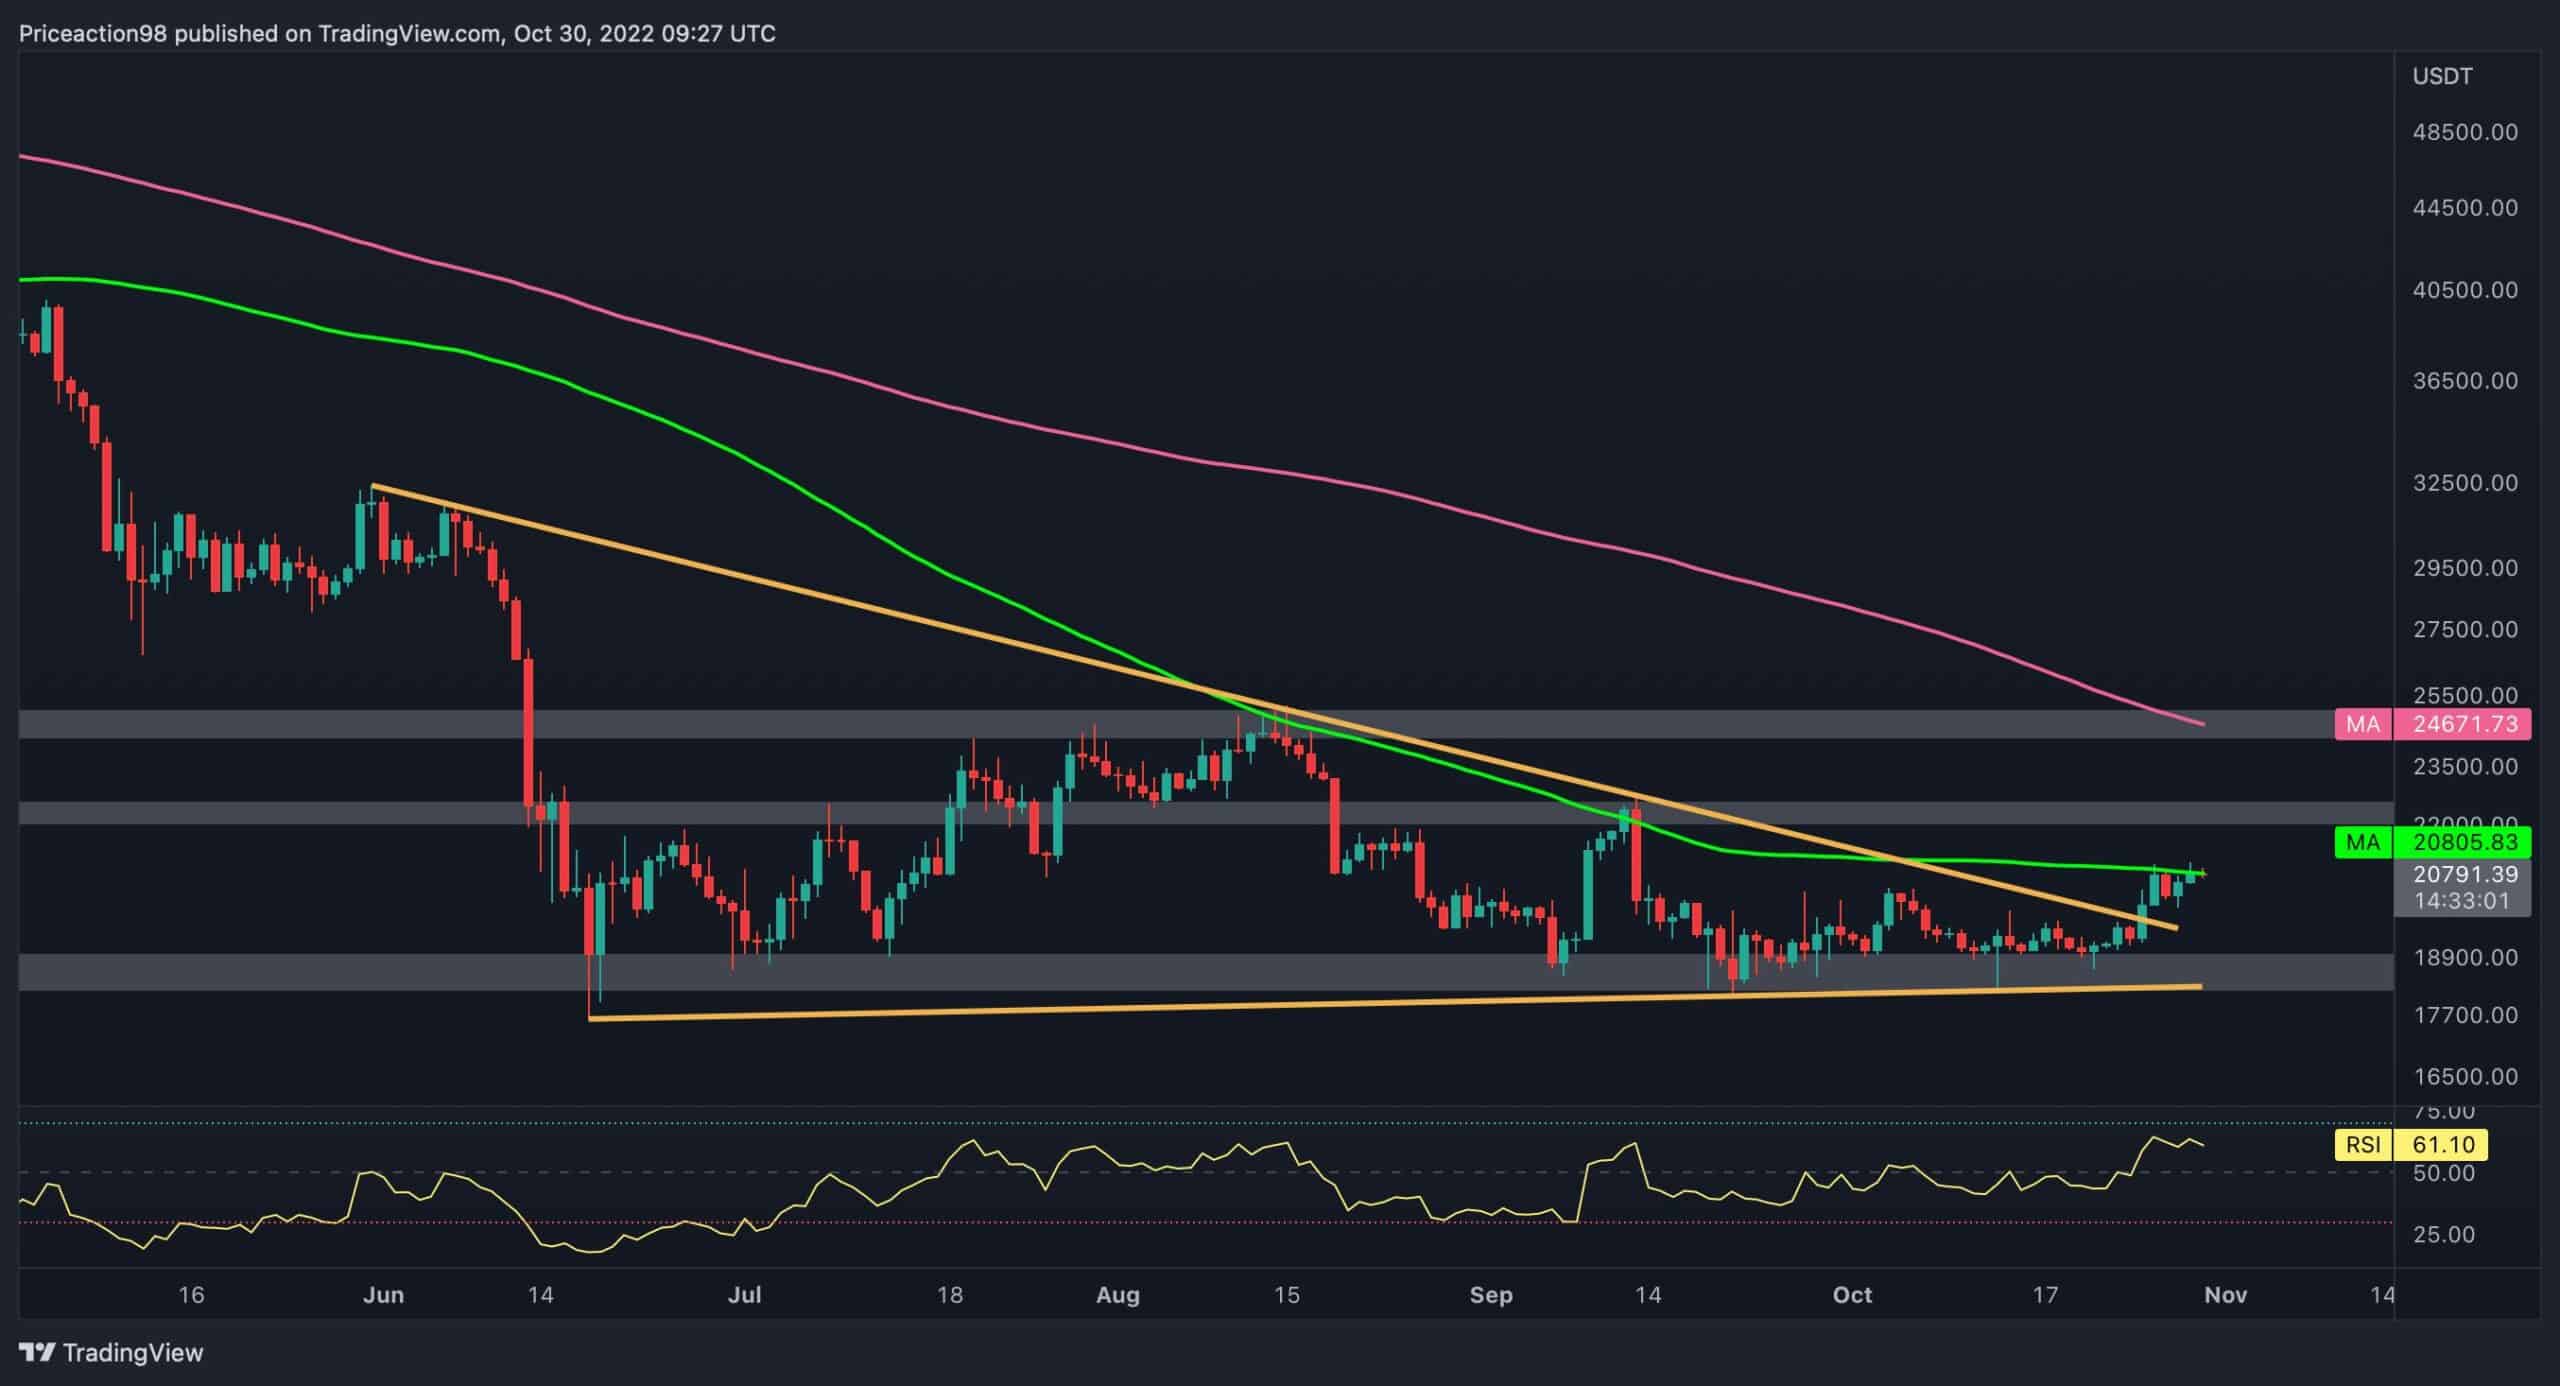
The Daily Chart
Bitcoin has formed a bearish triangle pattern and found support at the lower boundary near the $18K range until it recently broke above the triangle.
Typically, a breakout from the upper edge of a bearish triangle is considered a bullish signal for the price. However, the market conditions are slightly different now, with some significant resistance levels over the near term.
The 100-day moving average of $20.8K is the main barrier for Bitcoin, as the price is struggling to hold above this level after a few failed attempts.
Optimism will likely return to the market if the price successfully exceeds this level. Nevertheless, there is a higher chance that Bitcoin will get rejected at this level and plummet based on the lower timeframe price action.
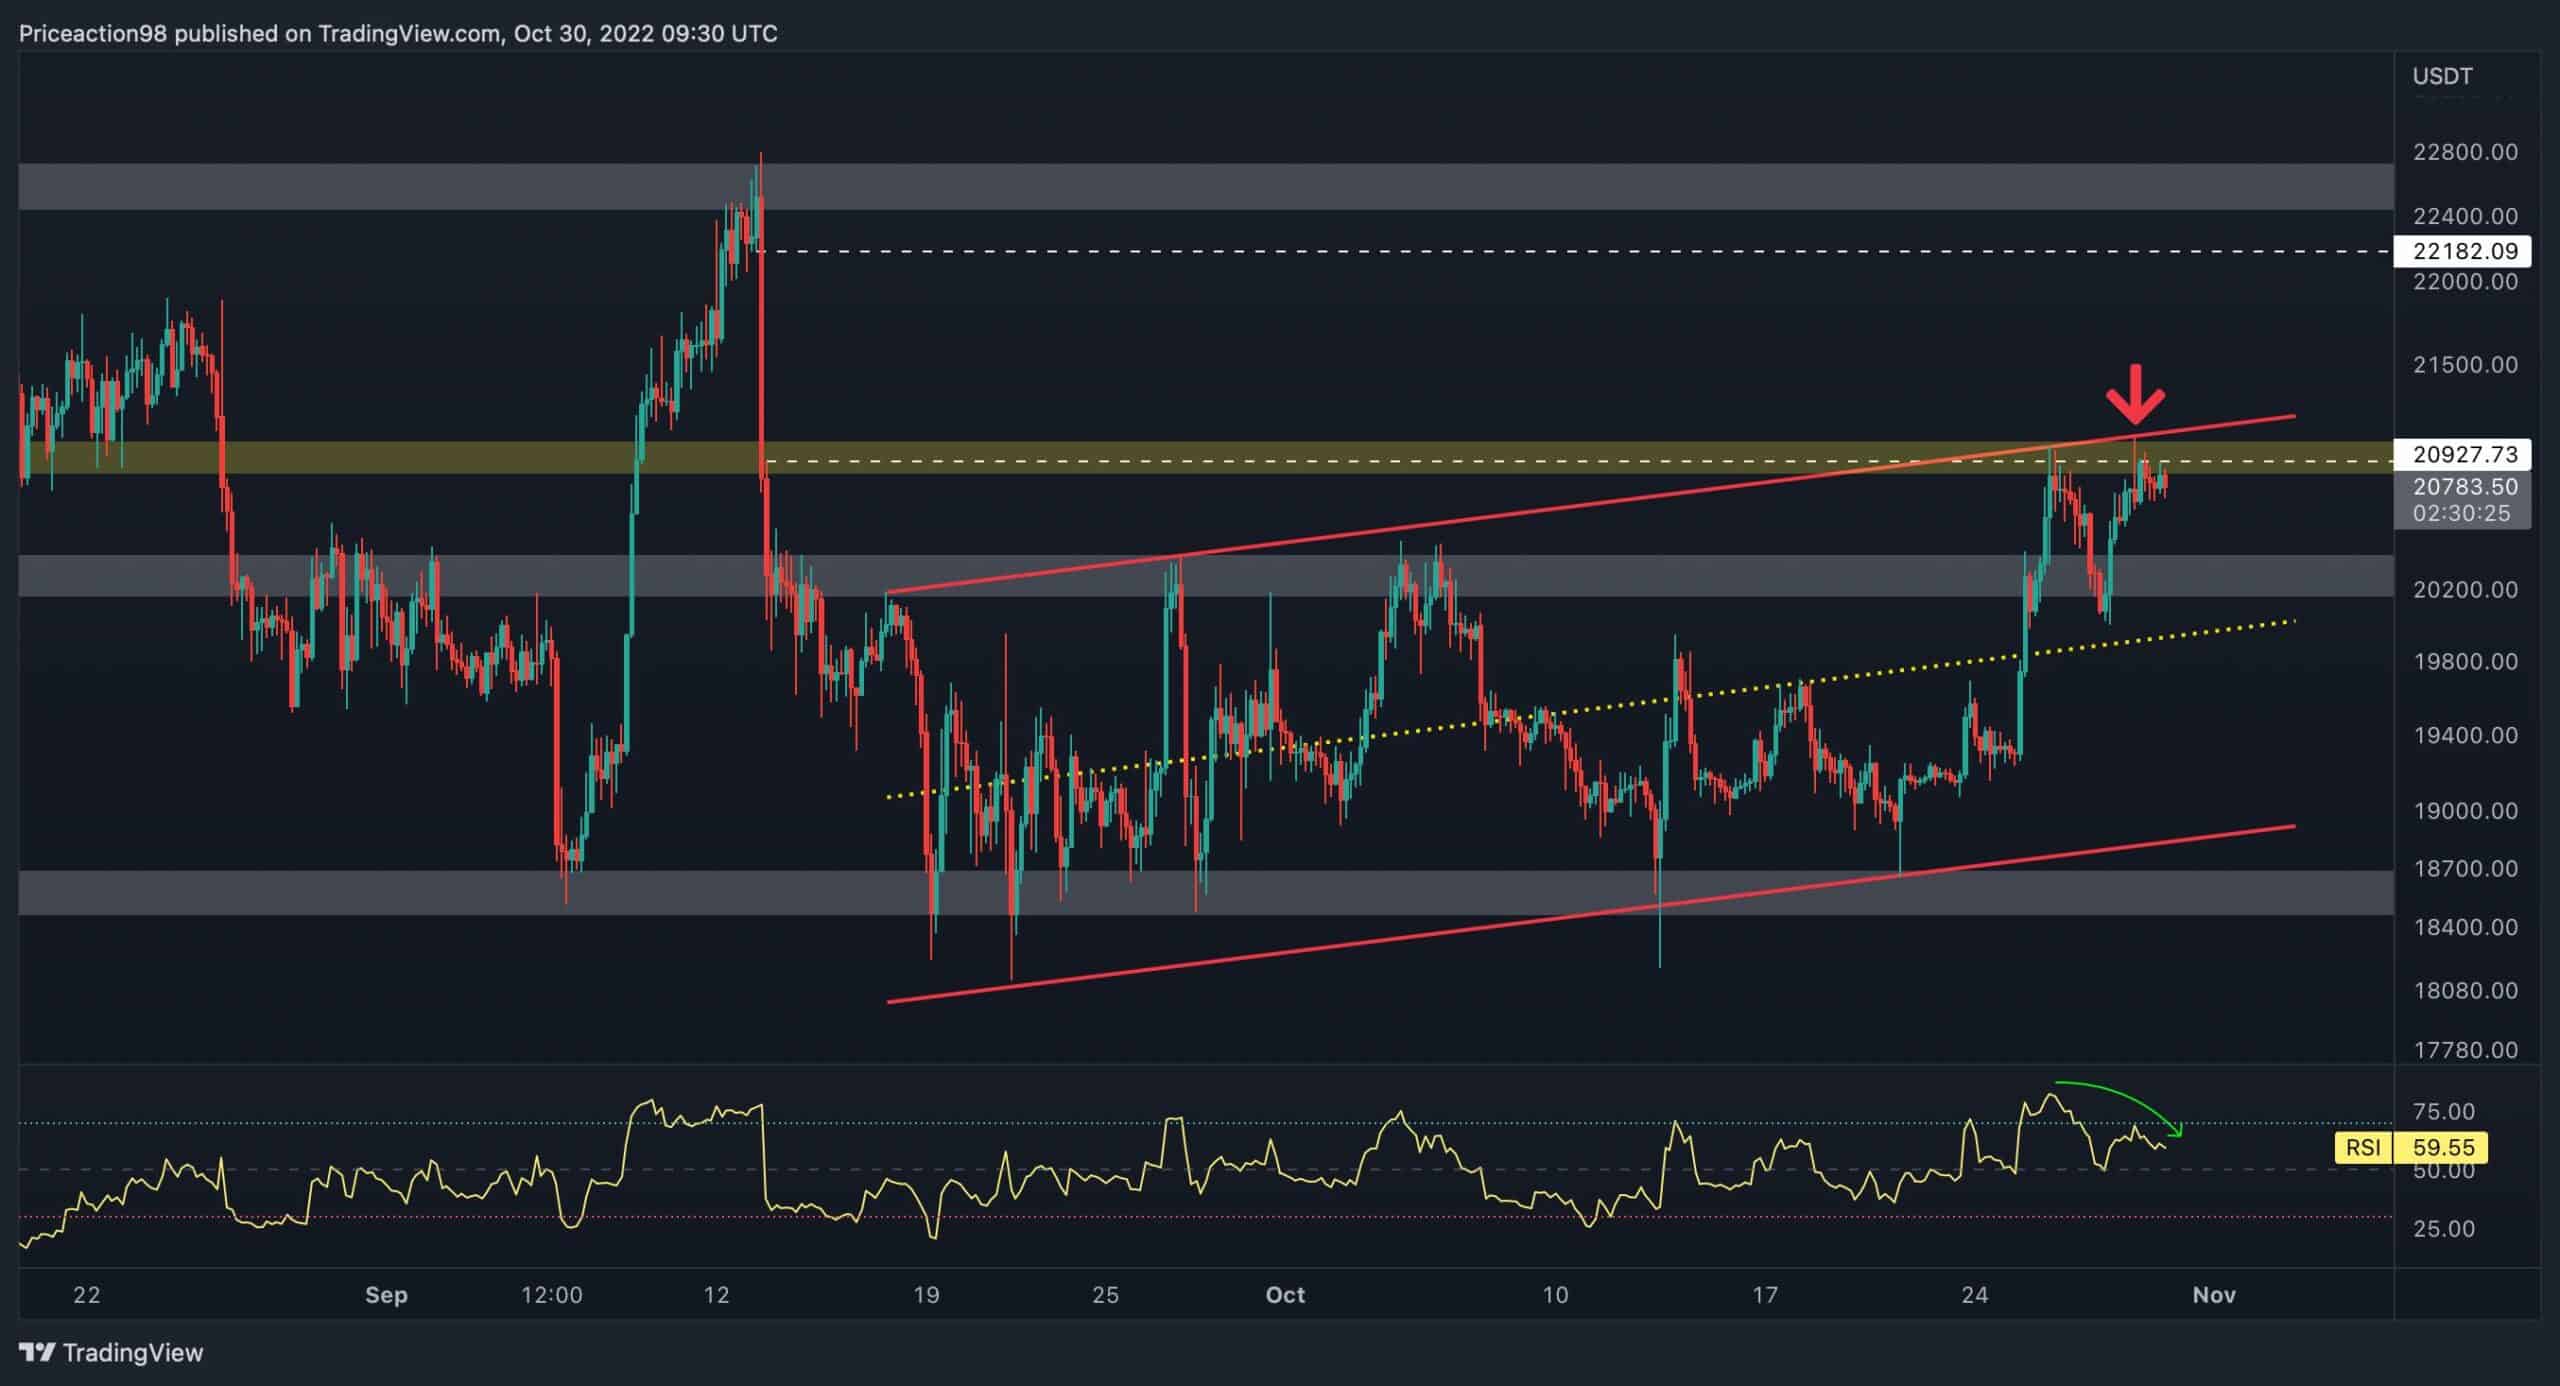
The 4-Hour Chart
There is a clear imbalance between the $20.9K and $22.1K levels. The price has recently experienced a surge and has reached this region.
Typically, the market uses an imbalance to initiate its next expansion move. However, the price has formed a bearish reversal flag pattern and reached the upper threshold.
Meanwhile, a closer look at the most recent price action reveals a Double Top reversal pattern formation. Furthermore, there is a bearish divergence between the price and the RSI indicator on the 4-Hour timeframe.
Putting all the above signs together, there are many bearish indications for the upcoming days for BTC. Hence, a rejection at the $21K level resulting in a plunge toward the $18K range will be the most likely scenario for Bitcoin in the short-term.
Onchain Analysis
By Shayan
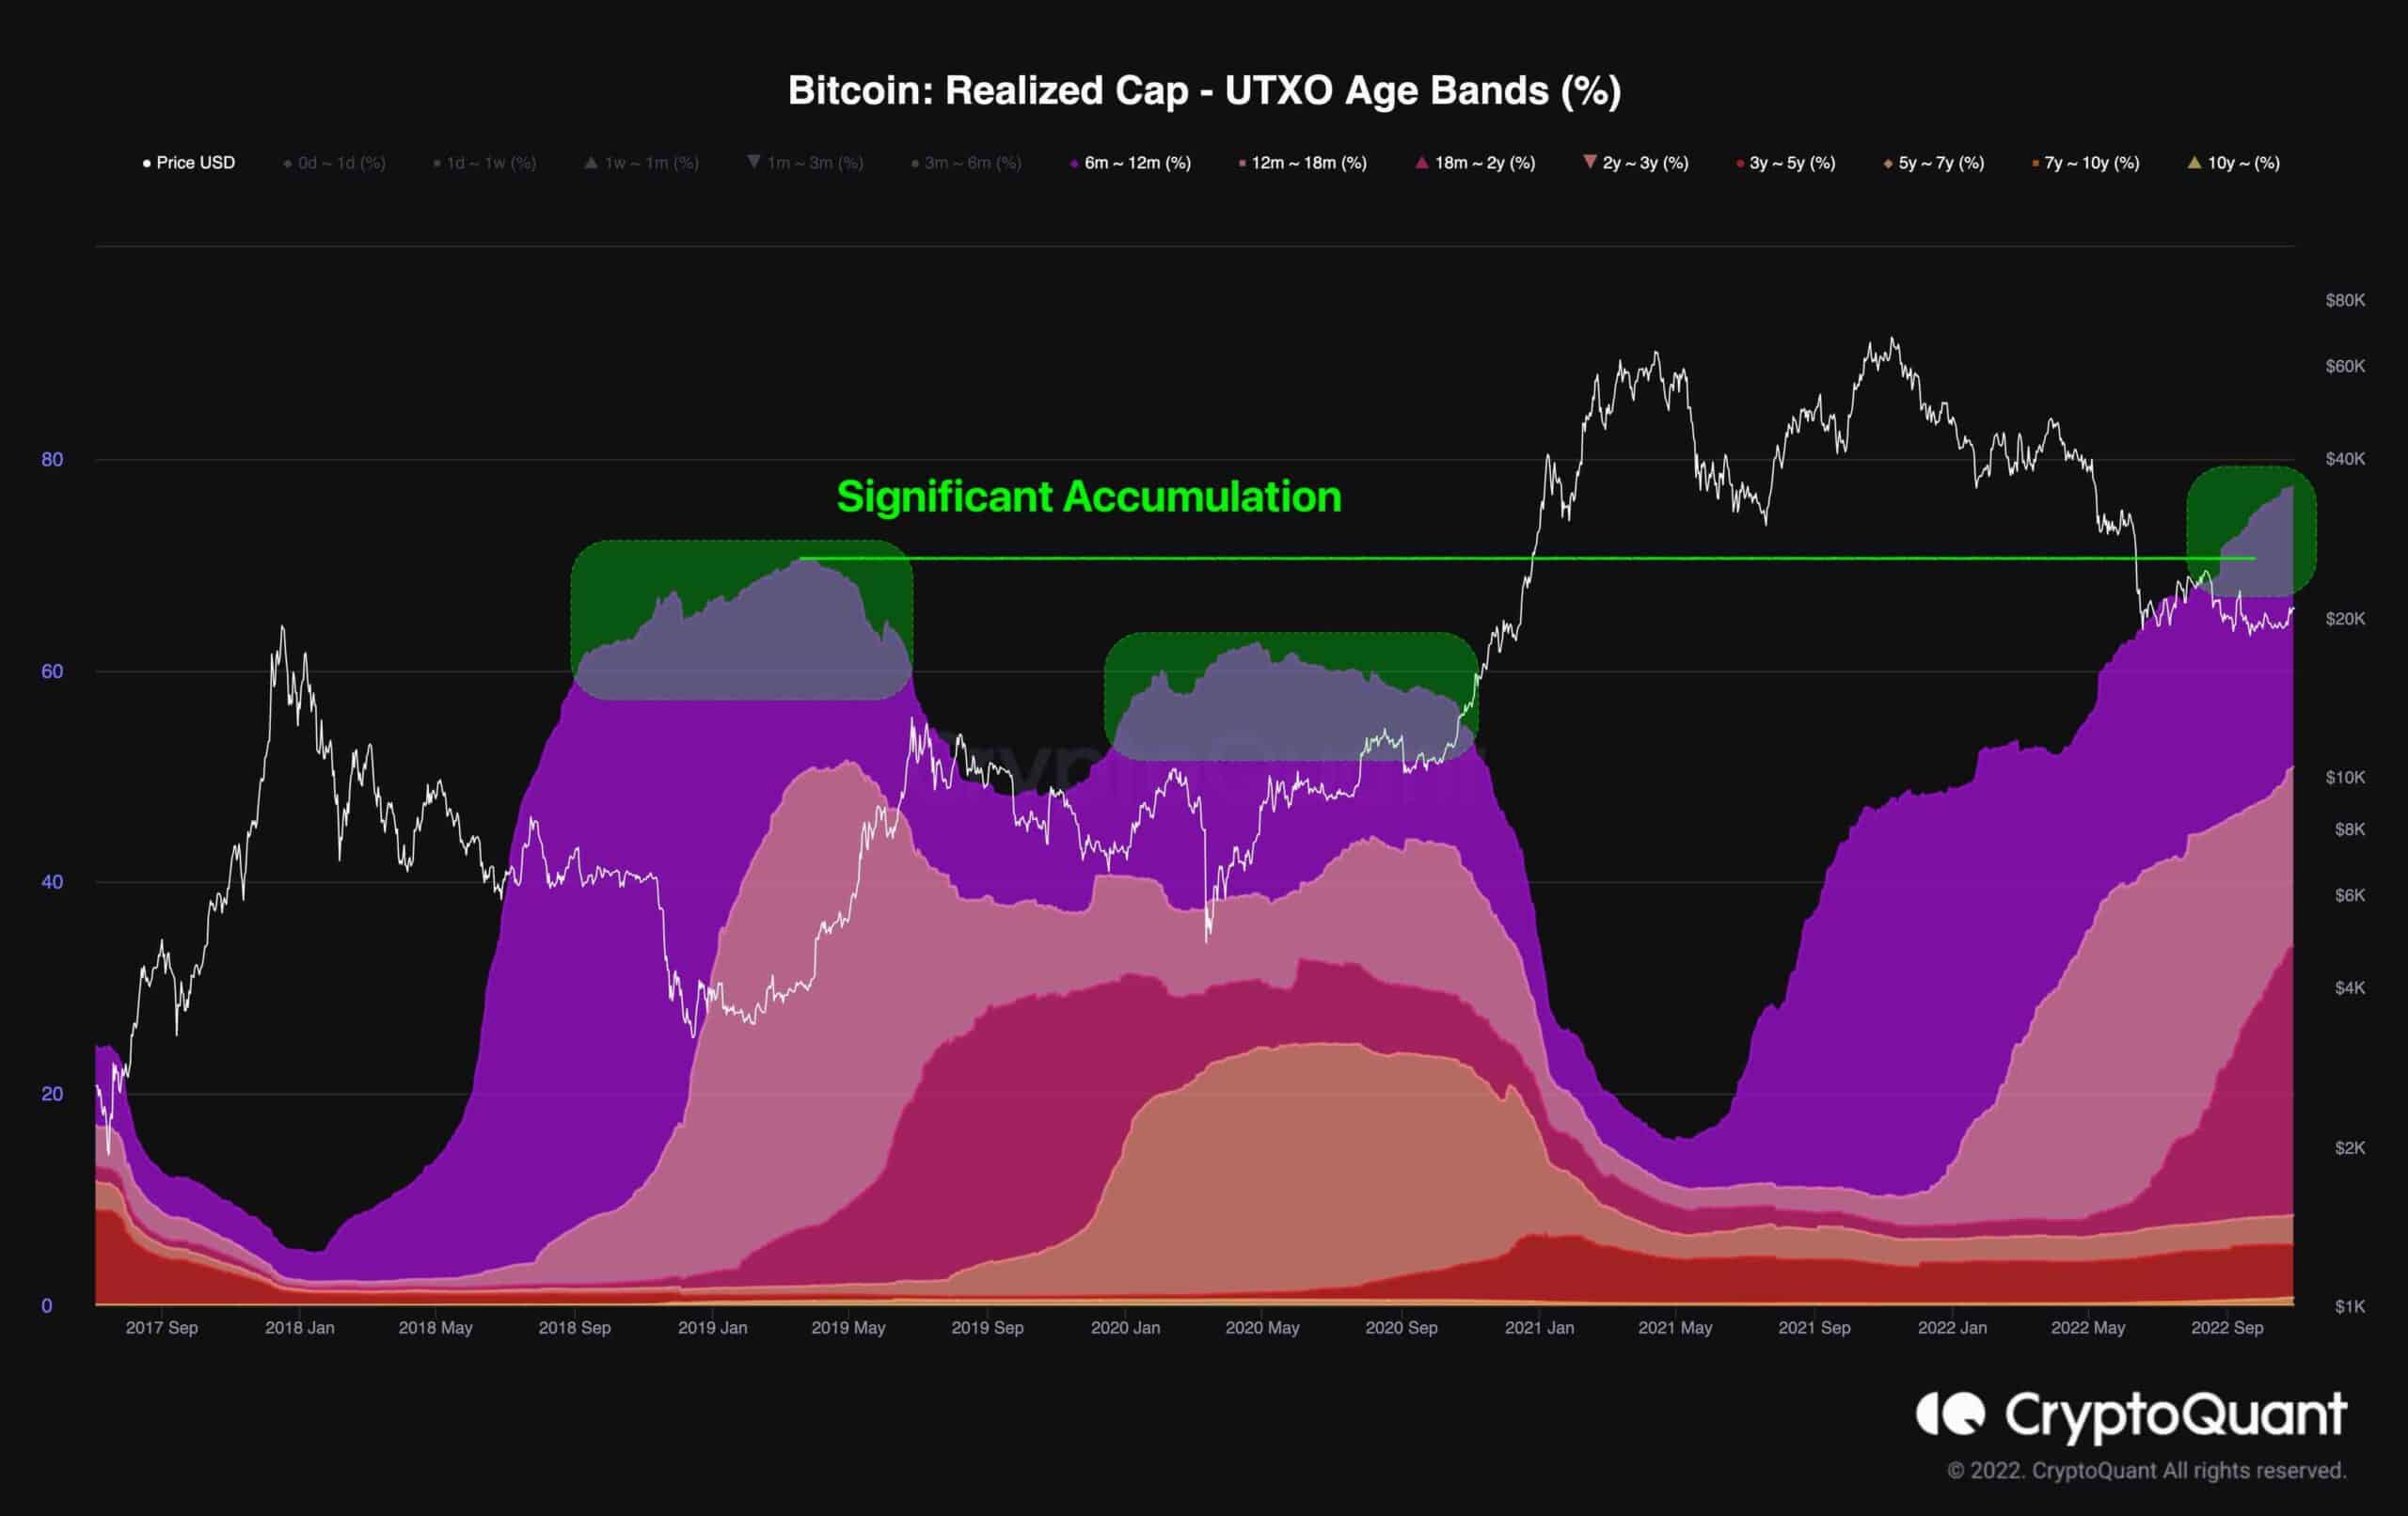
Bitcoin Realized Cap – UTXO Age Bands (%)
It has been nearly a year since Bitcoin recorded its ATH amid the $69K level and the beginning of the current bearish cycle. As mentioned above, the price action is yet to shift to a bullish reversal structure.
Meanwhile, various unstable periods have been brought on by the pandemic, inflation, and other tensions. As a result, uncertainty and doubt have remained the dominant sentiment in the financial markets.
The chart below illustrates a macro view of Bitcoin’s supply dynamics, based on the Realized Cap – UTXO Age Bands (%) metric, which represents coin groups based on their lifespan and their share of the total realized cap.
The market is in a stage of heavy accumulation, with the number of coins moving in the last six months steadily rising. This accumulation and HODLing behavior are expected during bearish phases, showing that many investors still believe in Bitcoin.
This metric indicates that during this particular bear market, the accumulation momentum is higher than in prior bearish phases despite the recent significant price drop below $20K.
This suggests that Bitcoin is still considered a long-term valuable asset for many market participants, and the market will undergo a substantial bullish run after finding a long-term bottom.