Bitcoin has yet to make a decisive move in any direction as the primary cryptocurrency continues to wrestle with the K support level. A bearish breakout below this position could be disastrous. Technical Analysis By: Edris The Daily Chart Bitcoin’s price overlaps with crucial support on the daily timeframe, as it oscillates in a very tight range between the significant descending trendline and the K support level. With minimal wiggle room between these levels, a breakout to either side is expected to occur during the next days or even hours. The 50-day moving average located near the K mark is currently providing additional dynamic resistance and continues to bar the price from flourishing, keeping it below this level for now. Considering the overall bearish
Topics:
CryptoVizArt considers the following as important: Bitcoin (BTC) Price, BTC Analysis, btcusd, btcusdt
This could be interesting, too:
Chayanika Deka writes XRP, SOL, and ADA Inclusion in US Crypto Reserve Pushes Traders on Edge
Chayanika Deka writes Why Arthur Hayes Is Bullish on Bitcoin Under Trump’s Economic Strategy
Mandy Williams writes Why the Bitcoin Market Is Stuck—and the Key Metric That Could Change It: CryptoQuant CEO
Wayne Jones writes Metaplanet Acquires 156 BTC, Bringing Total Holdings to 2,391
Bitcoin has yet to make a decisive move in any direction as the primary cryptocurrency continues to wrestle with the $18K support level. A bearish breakout below this position could be disastrous.
Technical Analysis
By: Edris
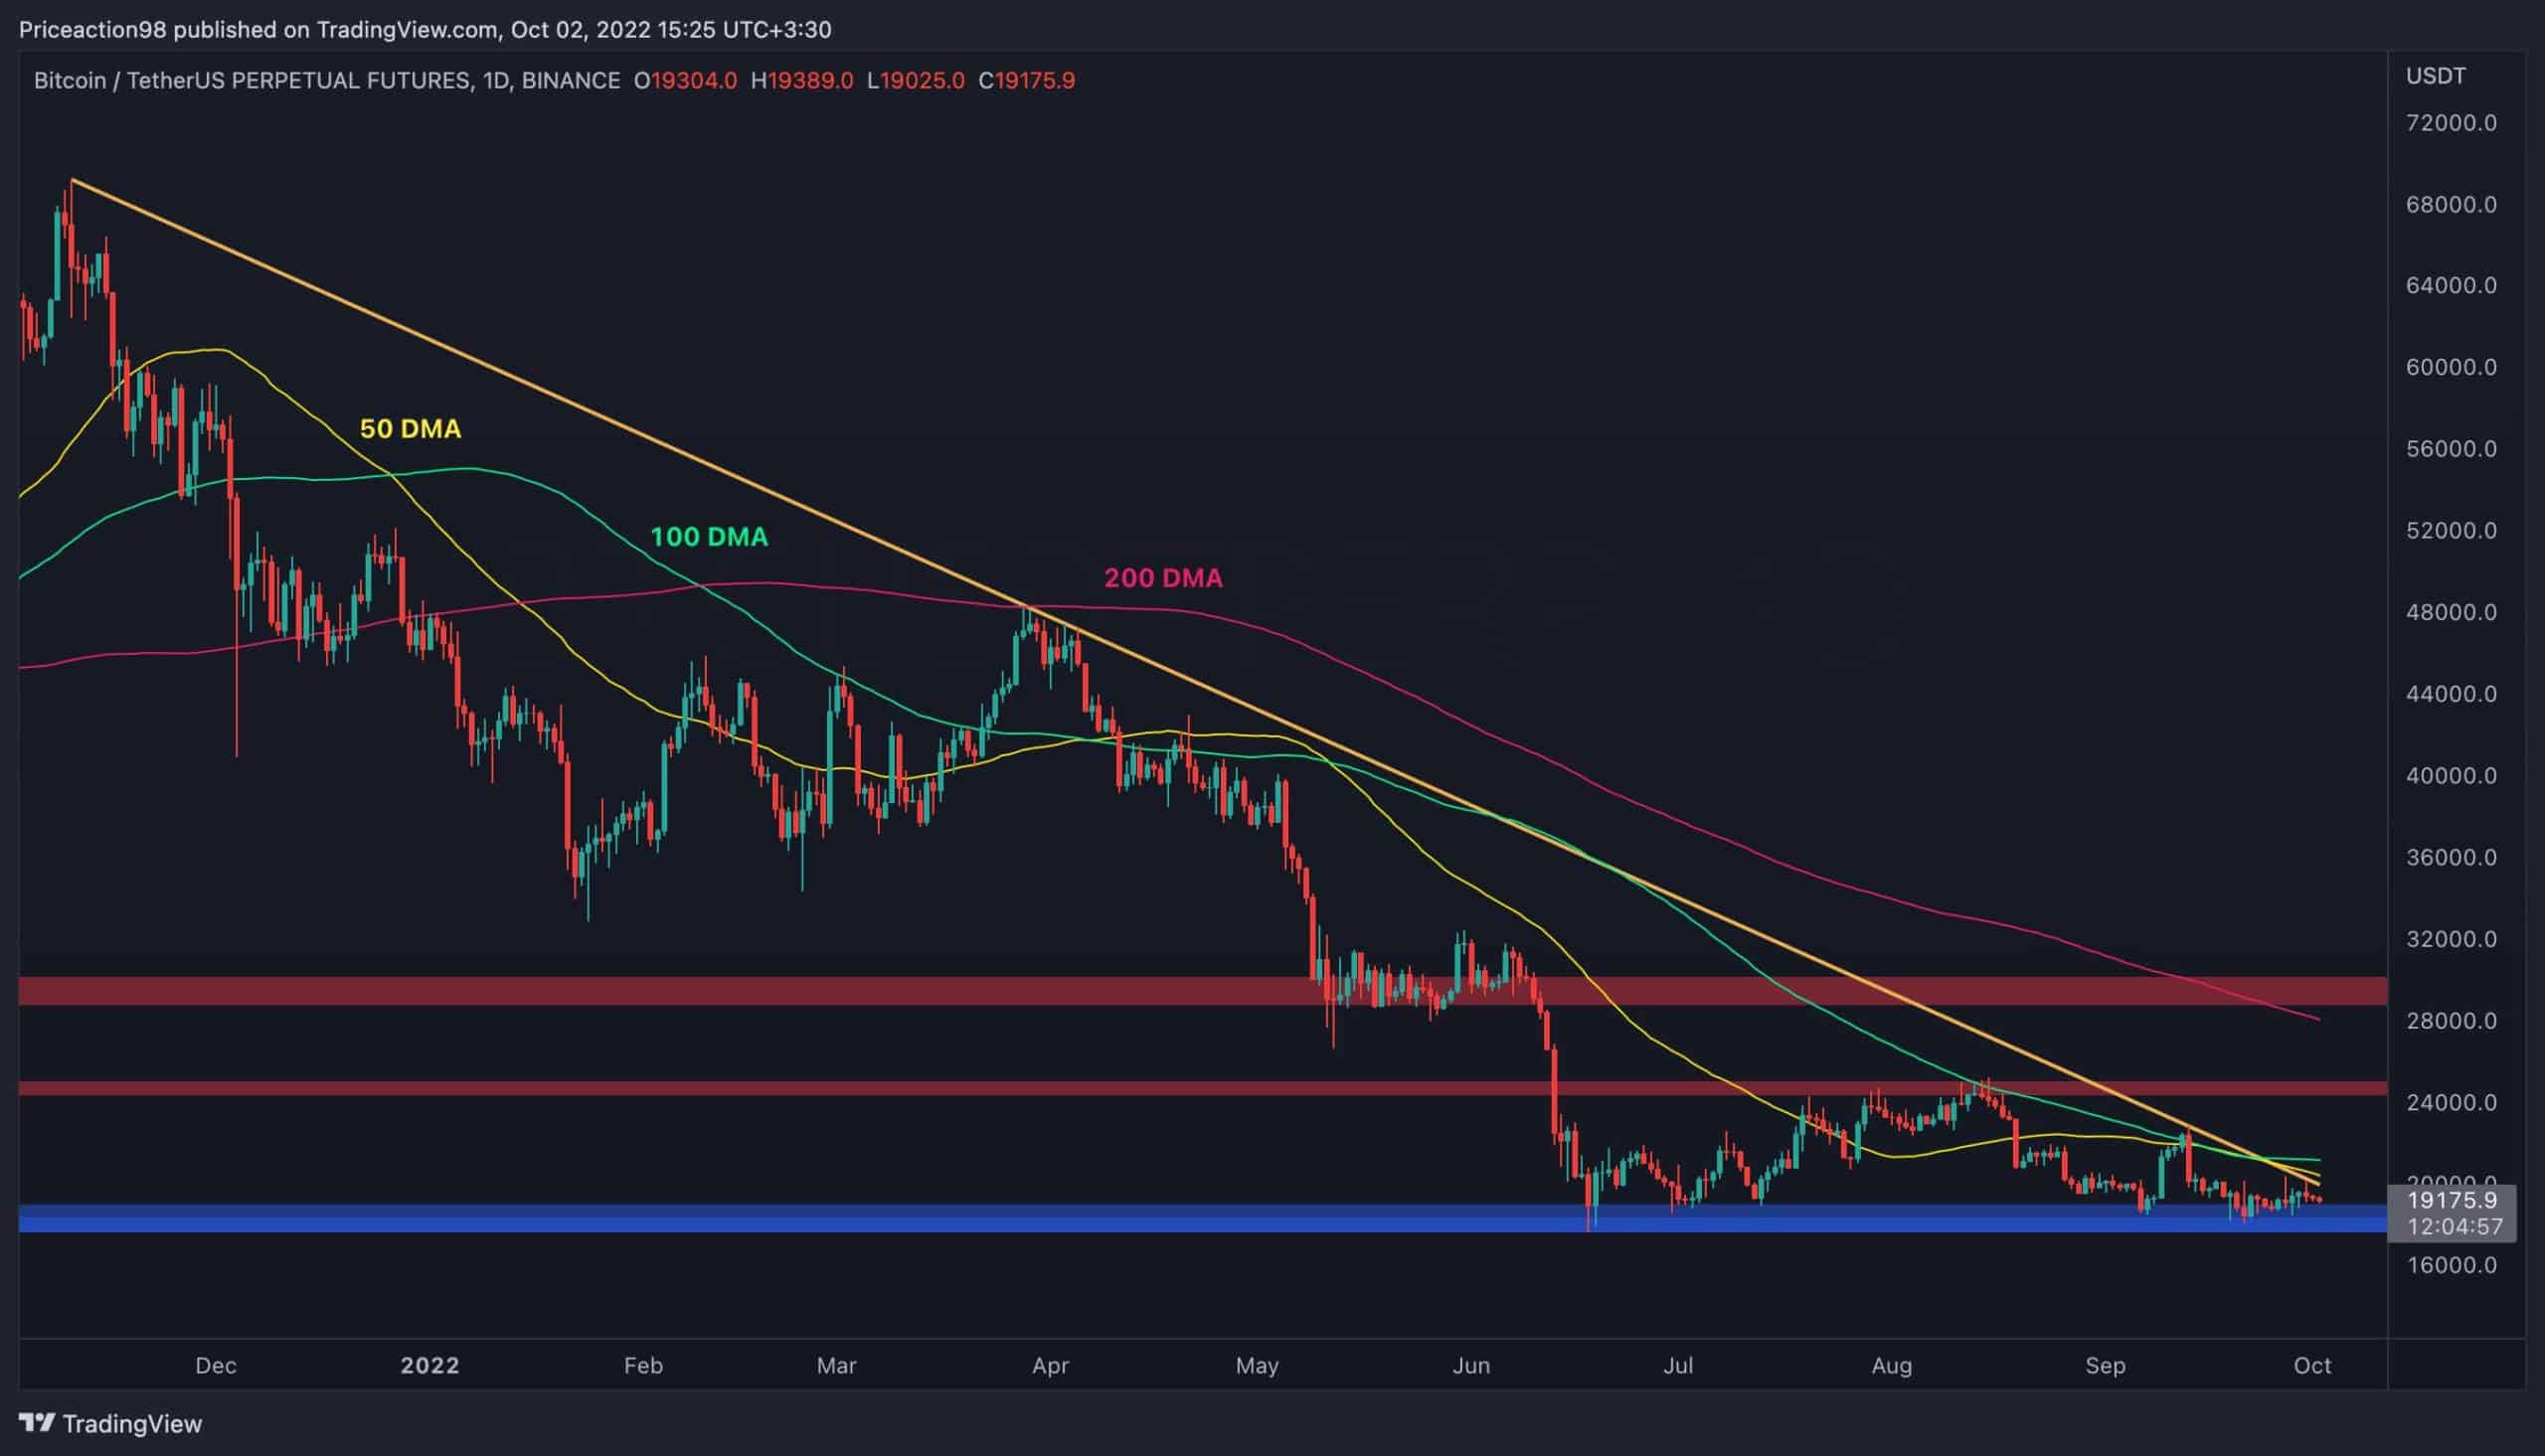
The Daily Chart
Bitcoin’s price overlaps with crucial support on the daily timeframe, as it oscillates in a very tight range between the significant descending trendline and the $18K support level. With minimal wiggle room between these levels, a breakout to either side is expected to occur during the next days or even hours.
The 50-day moving average located near the $20K mark is currently providing additional dynamic resistance and continues to bar the price from flourishing, keeping it below this level for now.
Considering the overall bearish market structure and the confluence of resistance levels at around $20K, a bearish breakout below $18K appears to be a more plausible scenario. This breakdown could initiate another regression towards the $15K area and beyond.
In opposition to this scenario, for the bearish outlook to fail, the price needs to break above the bearish trendline, as well as both the 50-day and 100-day moving average lines.
This bullish rebound would pave the way for a rally toward the $24K resistance level in the short term.
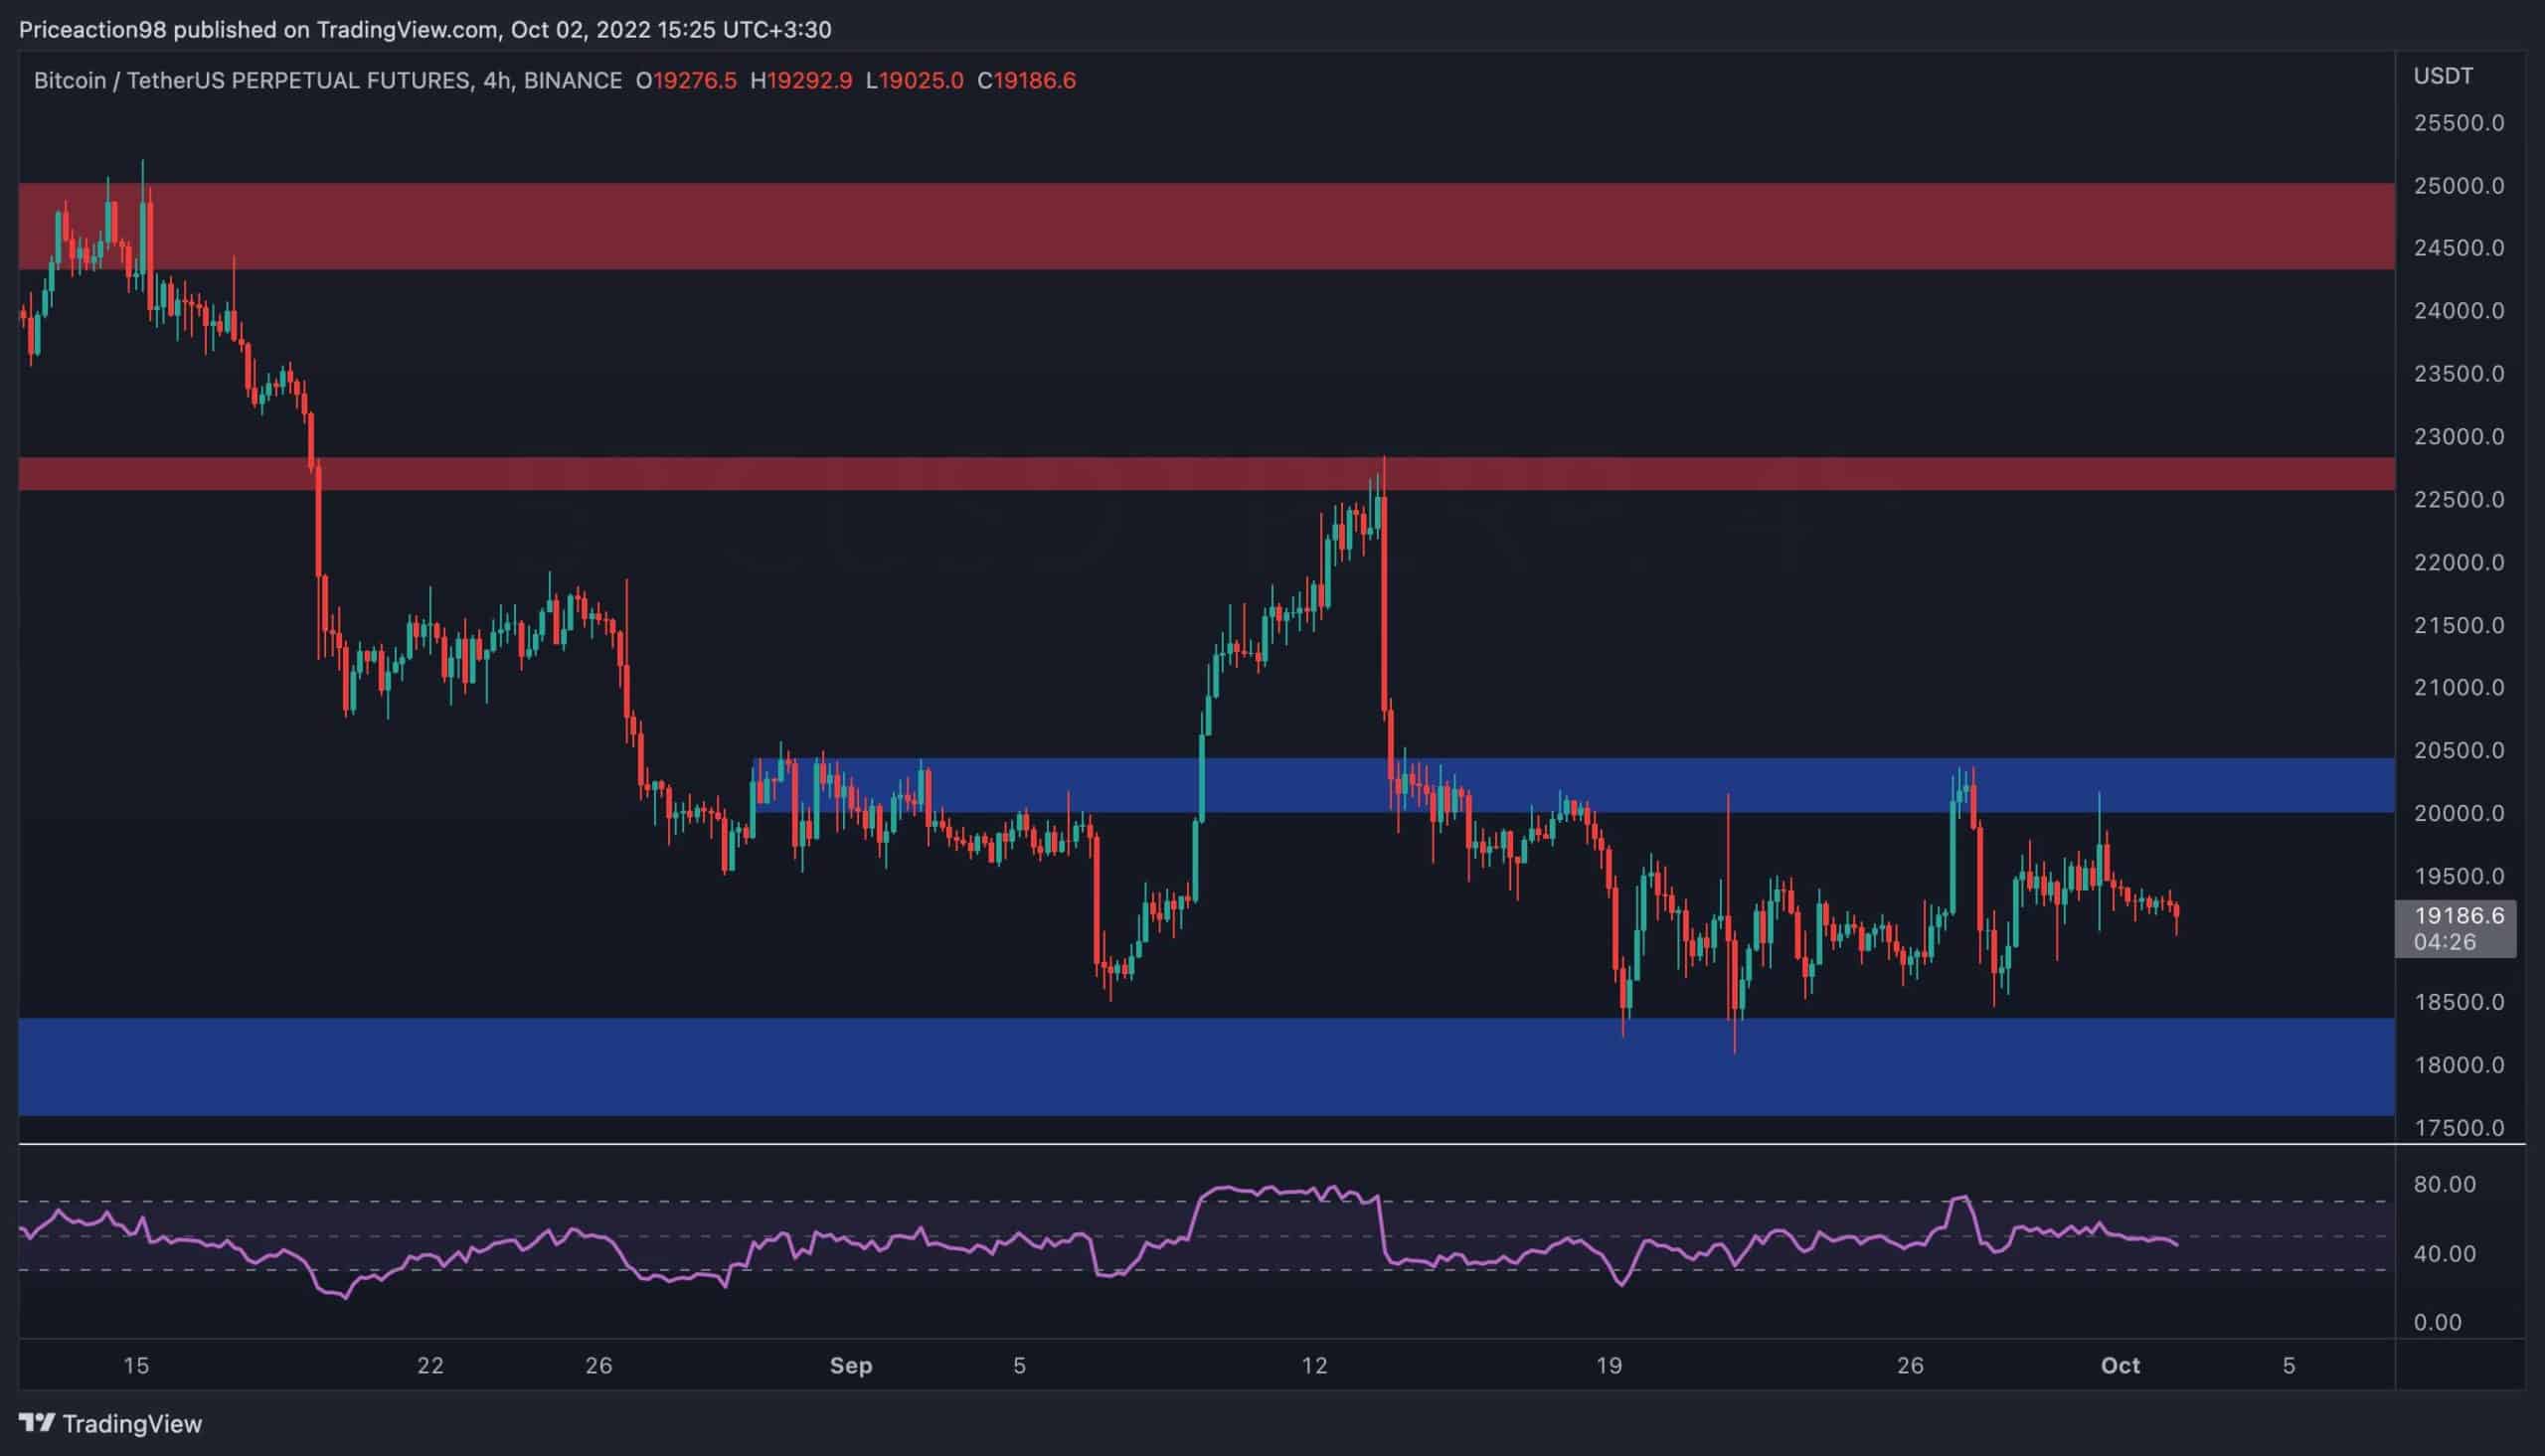
The 4-Hour Chart
On the 4-hour timeframe, the price continues to range between the $20K and $18K levels, as the market appears to be in the calm before the storm. A breakout either above or below the mentioned levels could lead to a massive move in this timeframe and shape the mid-term price action of the crypto asset.
The RSI is also currently around 50%, as momentum remains neutral for the time being. This indicates that buy and sell pressure lingers in a fragile equilibrium.
However, the oscillator has recently broken below the 50% level, pointing to a potential bearish shift in momentum and further boosting the probability of a bearish continuation.
Onchain Analysis
By Shayan
Miners joined the capitulation phase and have been distributing small amounts of their bitcoins after a significant decline in the price towards the $18K level. However, the hash rate has been experiencing a mild rally and has recently spiked, marking a new all-time high.
Considering that Bitcoin’s price is down roughly 74% from its all-time high set in November 2021, and mining may not be profitable for many miners and mining pools, this increase in hash rate could be a proxy of their belief in Bitcoin while providing the security of the asset.
Miners’ capitulation has historically marked the cessation of the bear market, and it seems to be close to an end. Thus, there is a high probability that Bitcoin is about to find its long-term bottom at these price levels.
