Bitcoin’s price is approaching a key resistance area as the markets are patiently waiting for the CPI release next week. Both the chart and the high probability of another decline showing in the inflation readings are suggesting that a turning point for Bitcoin may be near. Technical Analysis By: Edris The Daily Chart On the daily chart, the price is still trapped in a large descending channel and has yet to break it to either side. This pattern is typically an early sign of the exhaustion of the bearish trend and points to a probable bullish reversal if a breakout to the upside occurs. However, before the price even reaches the higher boundary of the channel, the K resistance level and the 50-day moving average, located around the same price, should be surpassed. On
Topics:
CryptoVizArt considers the following as important: Bitcoin (BTC) Price, BTC Analysis, btcusd, btcusdt
This could be interesting, too:
Mandy Williams writes Bitcoin ETFs Record Over .6B in Outflows in the Past 2 Weeks
Chayanika Deka writes Bitcoin Whales Offload 6,813 BTC as Selling Pressure Mounts
Wayne Jones writes Bitcoin Sentiment Hits 2022 Lows as Fear & Greed Index Falls to 10
Jordan Lyanchev writes Bitcoin Falls Below K for the First Time in 3 Months, How Much Lower Can It Go?
Bitcoin’s price is approaching a key resistance area as the markets are patiently waiting for the CPI release next week. Both the chart and the high probability of another decline showing in the inflation readings are suggesting that a turning point for Bitcoin may be near.
Technical Analysis
By: Edris
The Daily Chart
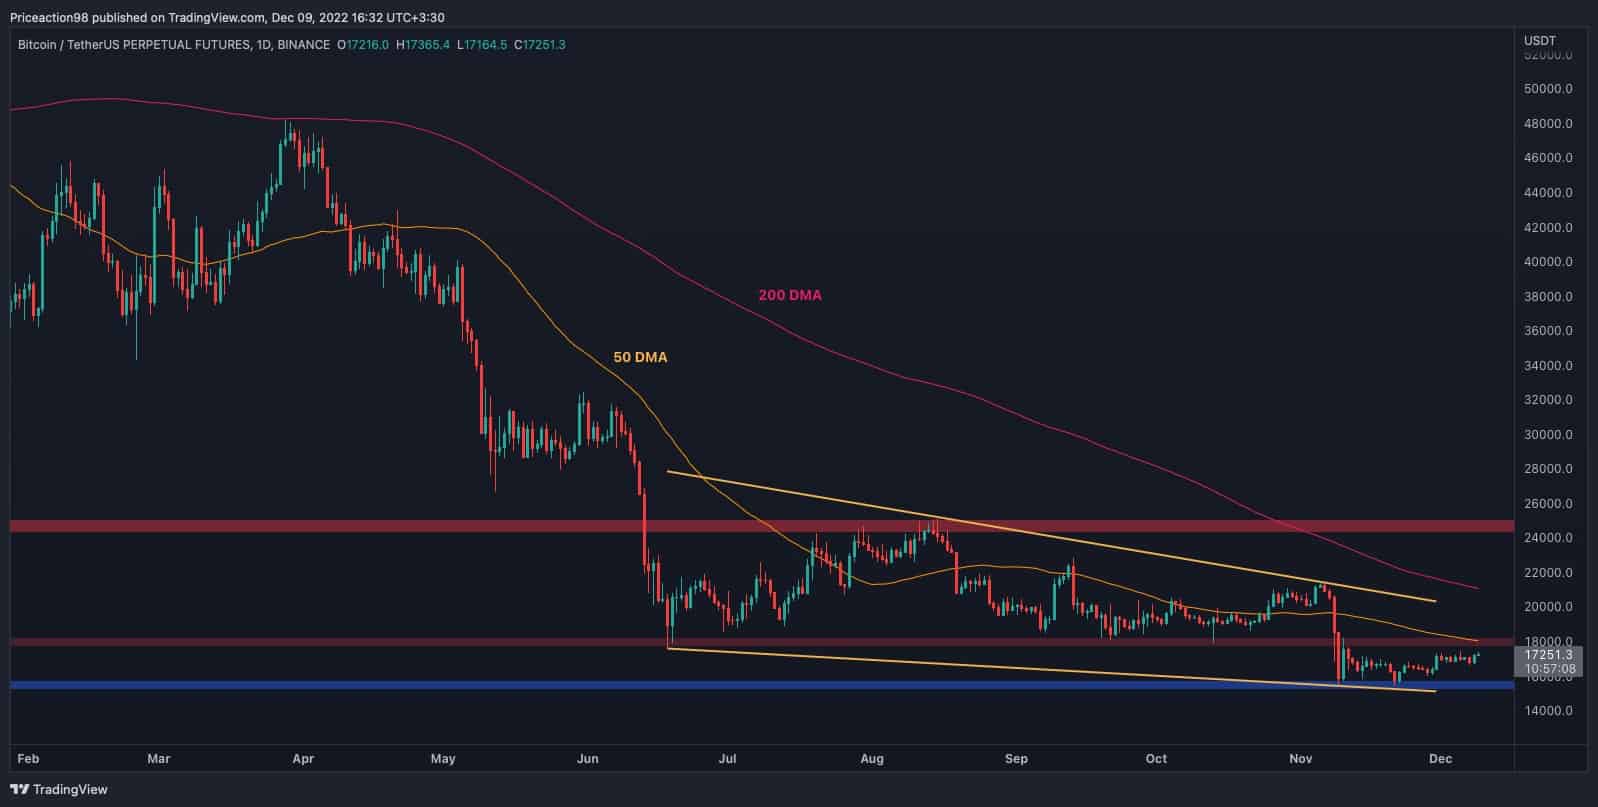
On the daily chart, the price is still trapped in a large descending channel and has yet to break it to either side. This pattern is typically an early sign of the exhaustion of the bearish trend and points to a probable bullish reversal if a breakout to the upside occurs.
However, before the price even reaches the higher boundary of the channel, the $18K resistance level and the 50-day moving average, located around the same price, should be surpassed.
On the other hand, if the price fails to break above this resistance level, a drop toward the $15K area and a retest of the lower trendline of the pattern would become a lot more likely.
The 4-Hour Chart
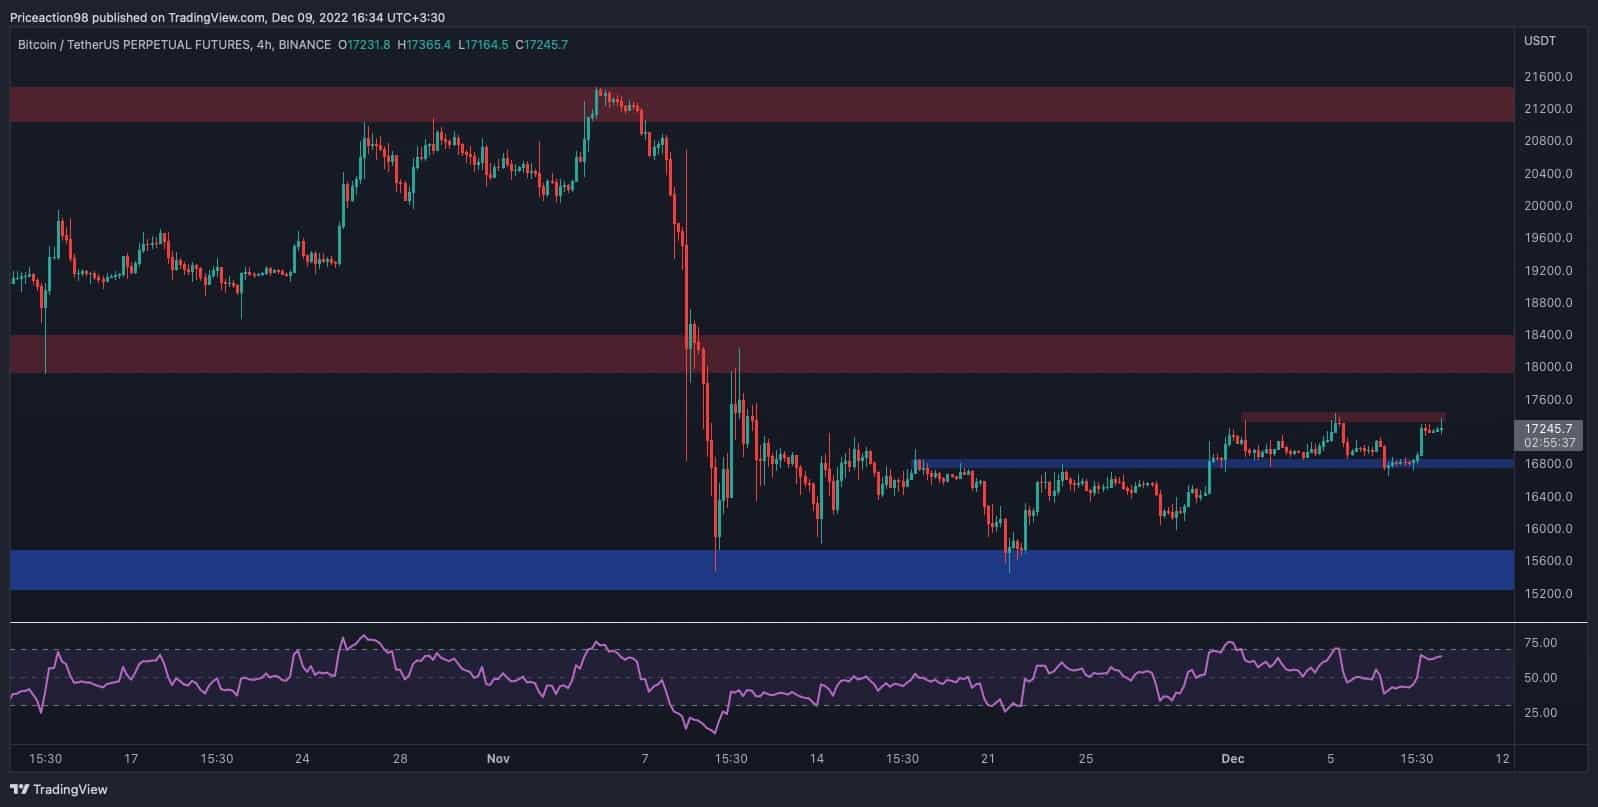
Looking at the 4-hour chart, market participants appear to have been bracing themselves for Tuesday’s CPI release, as neither could exert visible dominance over the other. This led to a range-bound price action between the $16,800 and $17,400 levels.
However, the bulls may be starting to gain some momentum, as suggested by the last few candles and a strong rebound from the $16,800 support level.
The RSI indicator has also been on the rise, pointing to the relative strength of the bulls over the bears and a higher probability for a bullish breakout and rally toward the $18K resistance zone.
Yet, the RSI is approaching the overbought area (above 70%), which could be an early caution sign for a potential pullback or bearish reversal when the price finally reaches the $18K level.
Sentiment Analysis
Bitcoin Funding Rates
Bitcoin has been in a gruesome downtrend for nearly the entirety of 2022 as the new year approaches swiftly. However, some promising signs are developing, which could suggest that the bear market bottom is closer than many might think.
The futures market has been the most crucial factor in determining the short-term price action of Bitcoin over the last couple of years, with liquidations initiating significant surges and plunges.
One of the most useful metrics for futures market sentiment evaluation is the funding rates, which demonstrates whether the bulls or bears are more aggressively longing or shorting, with negative values for the former and positive values for the latter.
During the recent crash caused by FTX’s bankruptcy, the funding rates dropped deeper in the negative region, showing values previously observed during the Covid-19 crash.
Highly negative funding rates are one of the common features of the Bitcoin price bottoms, especially when this situation carries on for a while.
This highly bearish sentiment usually leads to short liquidation cascades, which could set the stage for at least a short-term recovery.
