Ethereum’s price is currently facing crucial resistance, and the current focus is to surpass it. A successful breakout from this level could potentially result in bullish momentum in the near term. Technical Analysis By Shayan The Daily Chart Ethereum’s price has been forming a descending flag price pattern over the last few months. After recently touching the lower trendline, it has initiated a small rally with extremely low momentum. The price is now consolidating around the middle threshold, which closely aligns near the two intense resistance levels, the 100-day and 50-day moving average lines (standing roughly at ,350). The positive momentum will be fully confirmed if bears push the price above the aforementioned barriers. On the other hand, if the middle boundary
Topics:
CryptoVizArt considers the following as important: ETH Analysis, ETHBTC, Ethereum (ETH) Price, ethusd
This could be interesting, too:
Mandy Williams writes Ethereum Derivatives Metrics Signal Modest Downside Tail Risk Ahead: Nansen
Jordan Lyanchev writes Weekly Bitcoin, Ethereum ETF Recap: Light at the End of the Tunnel for BTC
CryptoVizArt writes Will Weak Momentum Drive ETH to .5K? (Ethereum Price Analysis)
Jordan Lyanchev writes Bybit Hack Fallout: Arthur Hayes, Samson Mow Push for Ethereum Rollback
Ethereum’s price is currently facing crucial resistance, and the current focus is to surpass it. A successful breakout from this level could potentially result in bullish momentum in the near term.
Technical Analysis
By Shayan
The Daily Chart
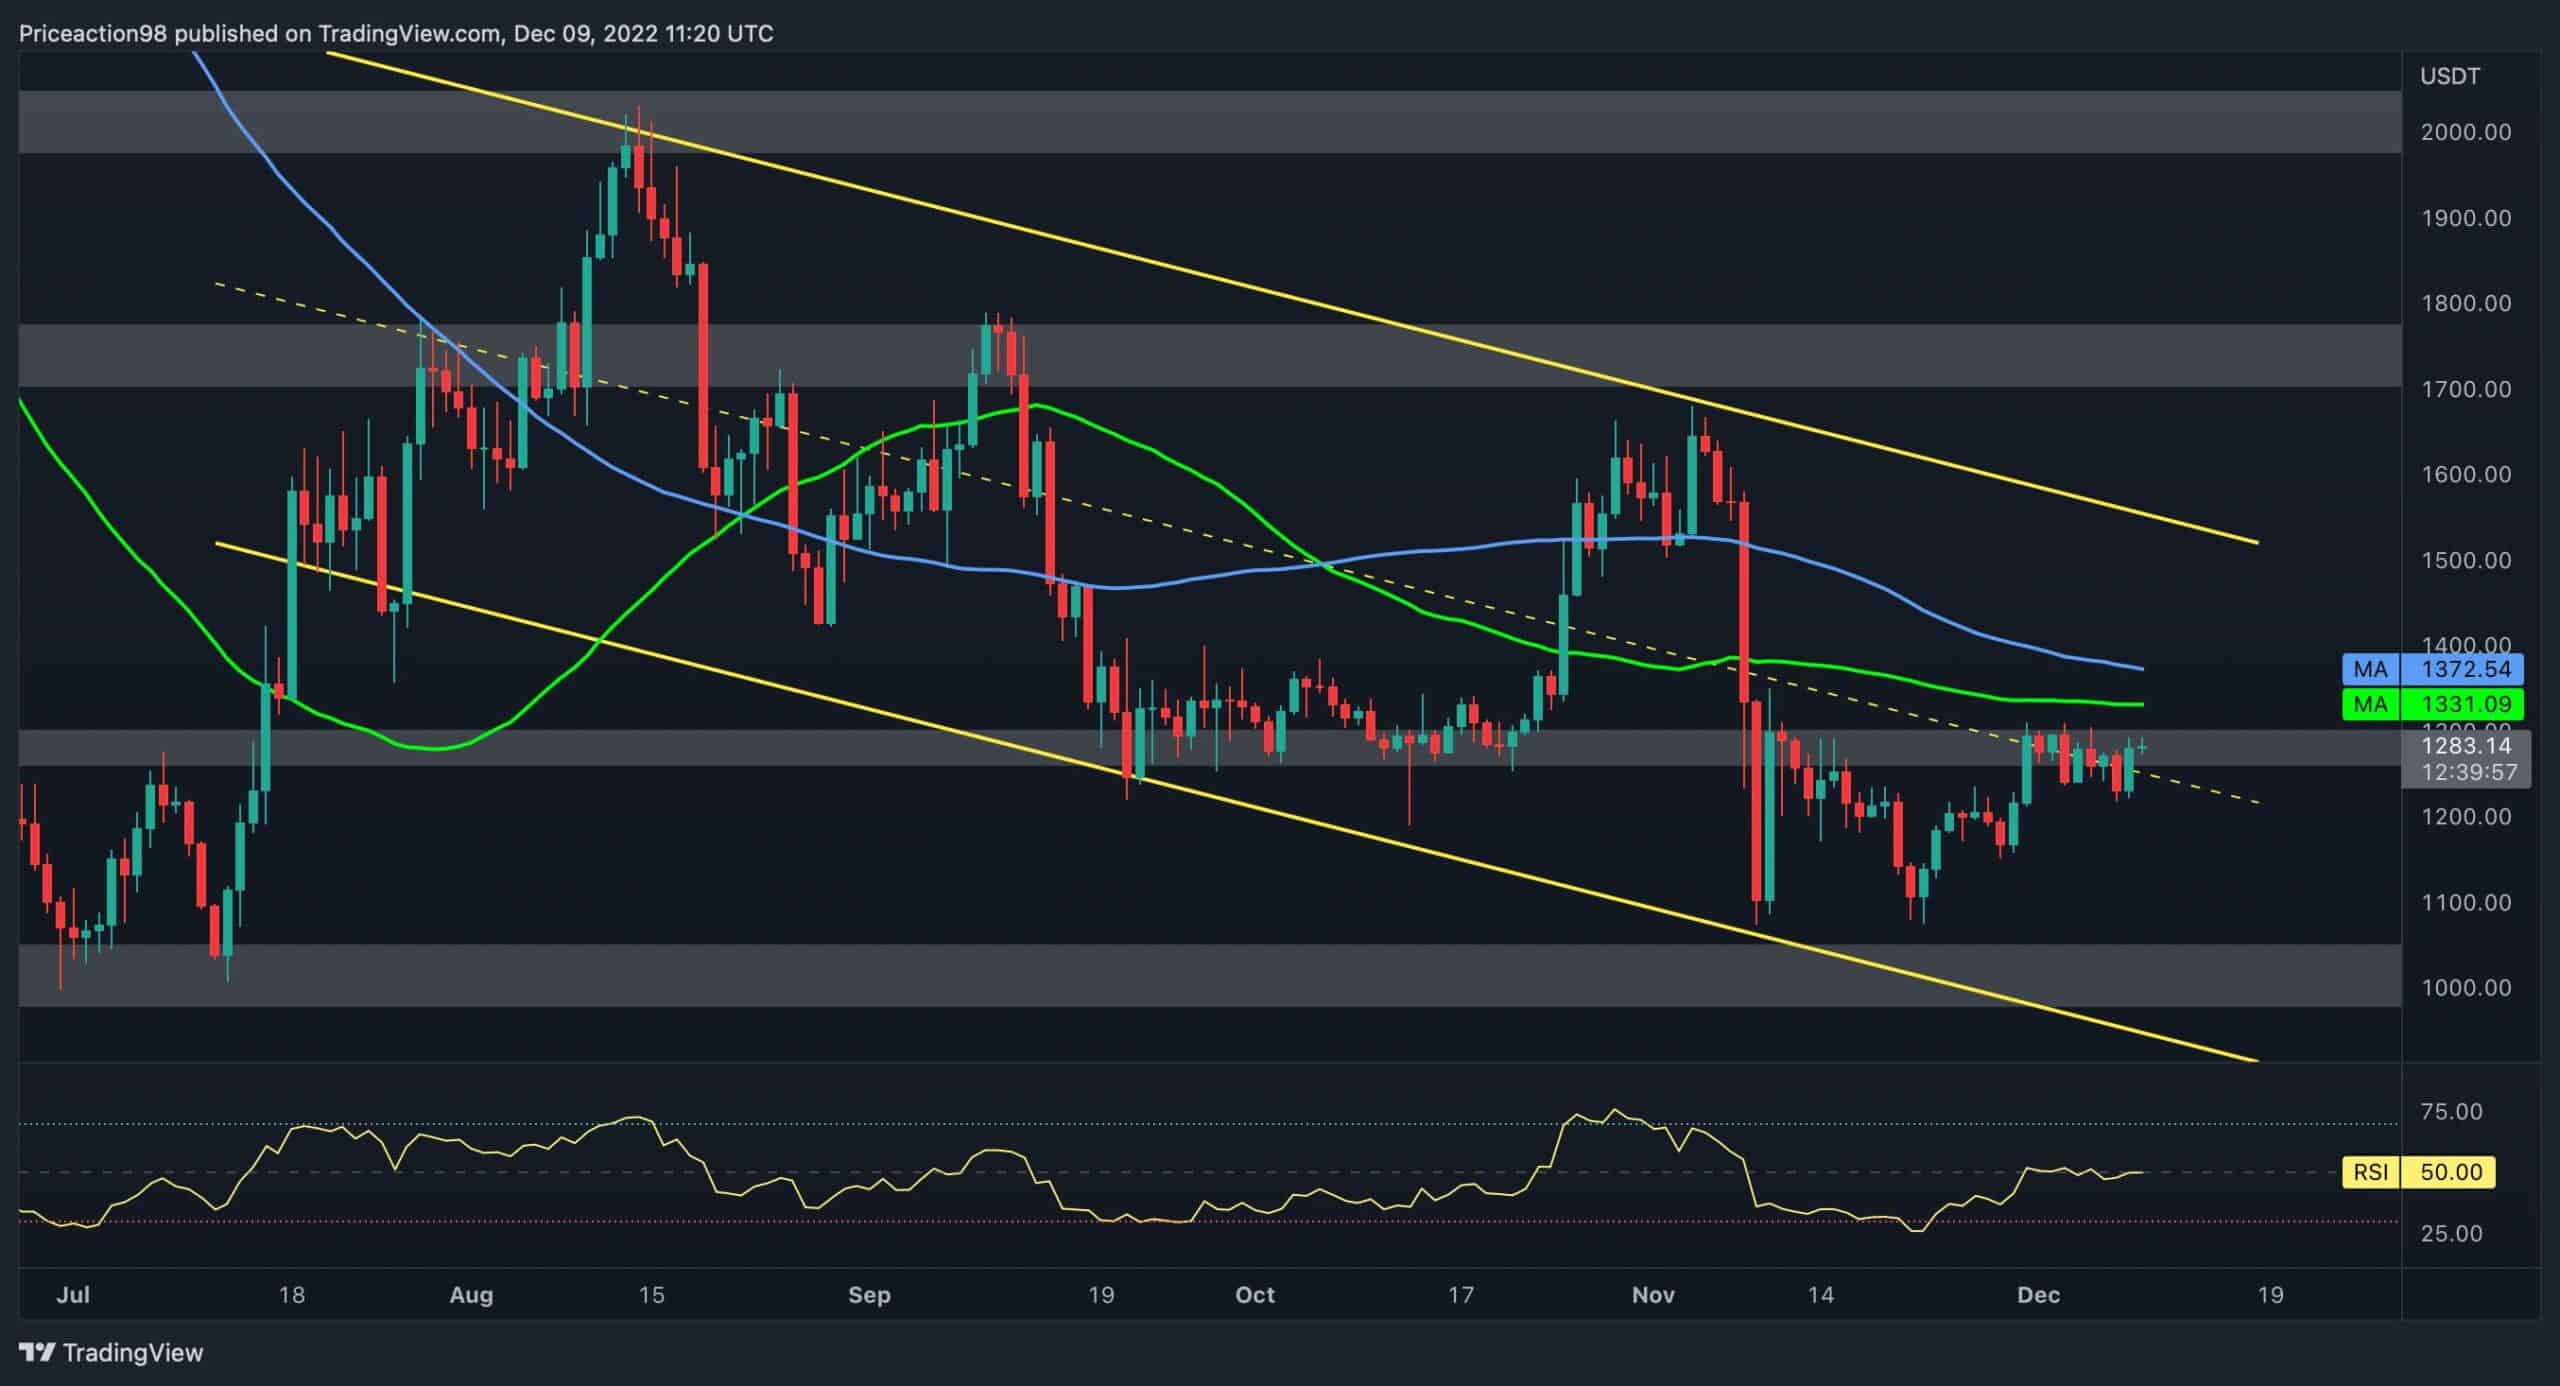
Ethereum’s price has been forming a descending flag price pattern over the last few months. After recently touching the lower trendline, it has initiated a small rally with extremely low momentum.
The price is now consolidating around the middle threshold, which closely aligns near the two intense resistance levels, the 100-day and 50-day moving average lines (standing roughly at $1,350).
The positive momentum will be fully confirmed if bears push the price above the aforementioned barriers.
On the other hand, if the middle boundary rejects the price, market participants should be prepared for another plummet toward the lower trendline, around $1K, which has served as significant support over the past few months.
The 4-Hour Chart
Each explosive price move is followed by continuation consolidation phases. The Fibonacci retracement is a valuable indicator to detect these stages and the potential targets. Typically, the 0.5 and 0.618 Fib levels are considered significant resistance in bearish expansion targets.
As the chart demonstrates, an evident imbalance aligns with the 0.5 level of the Fib retracement (standing at $1380) for the recent impulsive bearish price move. That makes this particular static level a powerful resistance. If the price successfully surpasses this decisive level, bullish momentum will likely return to the market.
Yet, considering the market situation, a rejection from the above-mentioned level followed by a plummet toward the $1K mark might be a more likely outcome.

Onchain Analysis
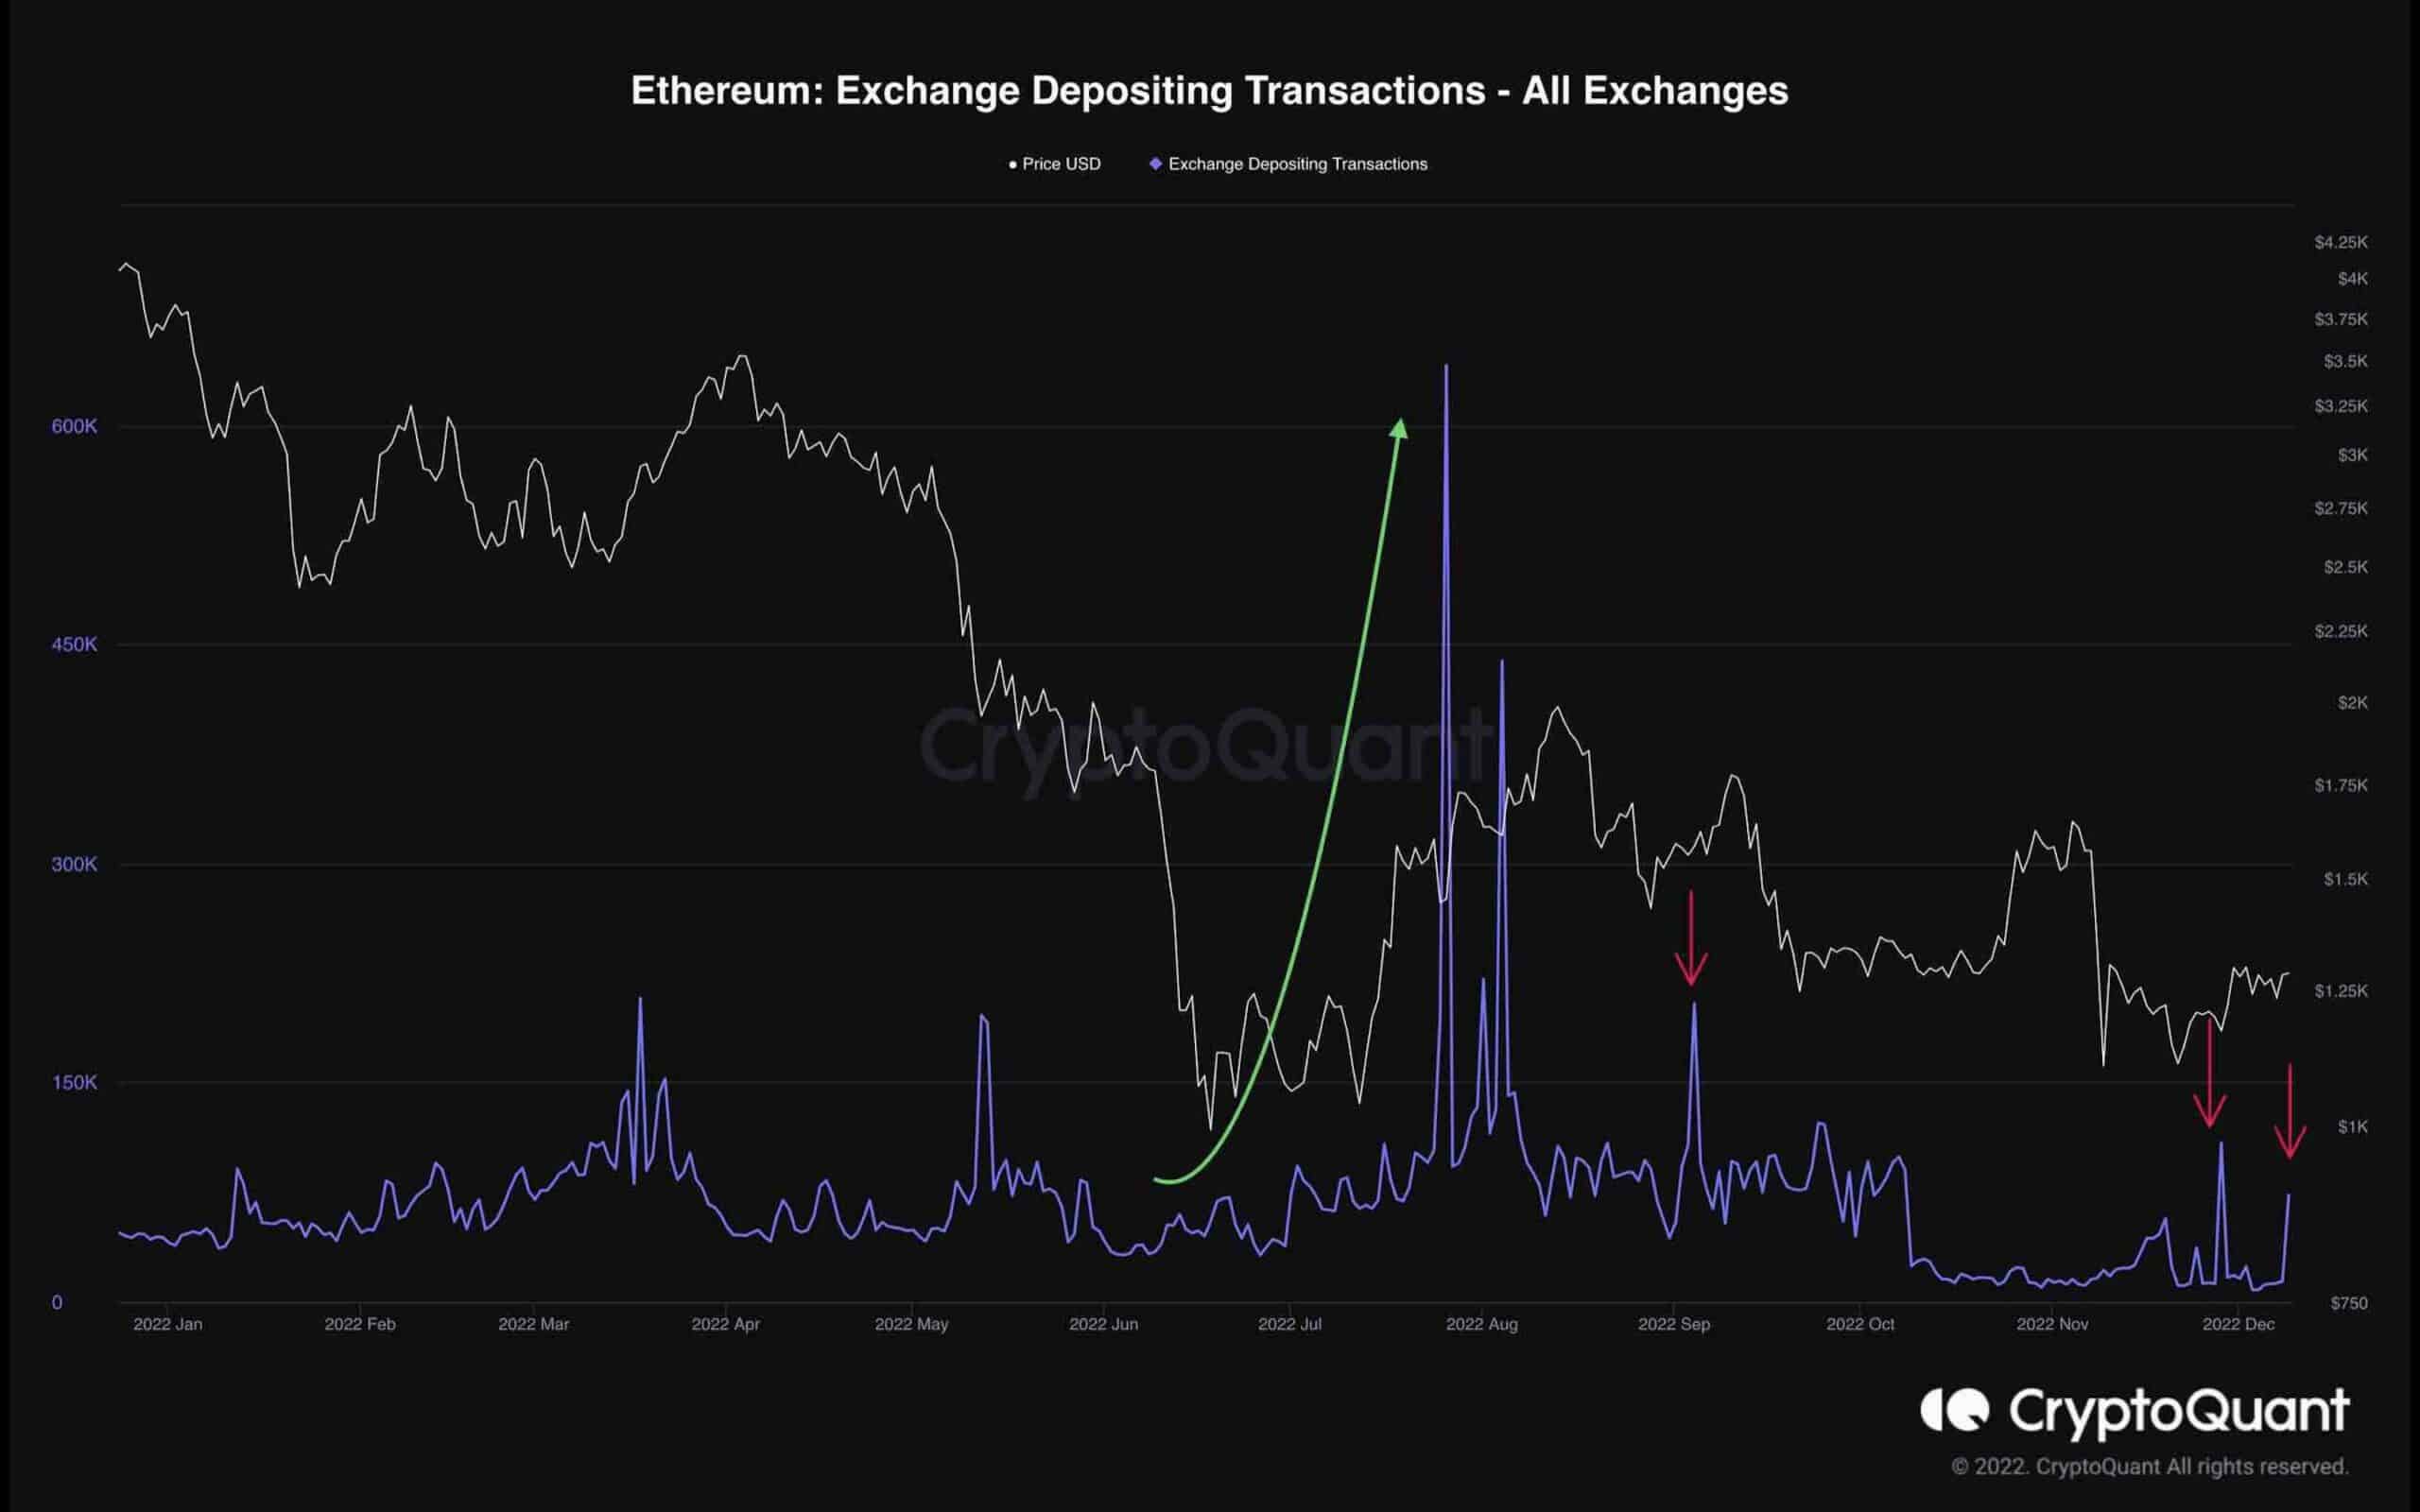
The following chart reveals the exchange depositing transactions for Ethereum. The metric demonstrates the total number of deposits counted to the exchanges, with higher values indicating an increased possibility of selling on the spot markets.
The metric marked an explosive jump in Aug 2022, resulting in a significant decline in Ethereum’s price. This was the result of panic selling and asset distribution from market participants.
However, the metric has recently printed two small surges. This increases the possibility of a new cascade in the upcoming days.