Following a massive decline in early November, Bitcoin’s price has consequently suffered from extremely low volatility. The cryptocurrency has been consolidating with serious downward momentum since this significant drop. Technical Analysis By Shayan The Daily Chart After falling below both the yellow trendline and the significant support level of K, the price is seeing very low volatility on the daily chart. A pullback to the trendline and the broken level is necessary before BTC continues to fall to lower levels. The price has initiated a bullish rally toward the trendline to retest it as a pullback. However, the momentum appears to lack conviction. On the other hand, the broken trendline and the 100-day moving average, sitting at roughly K, combine to make this
Topics:
CryptoVizArt considers the following as important: Bitcoin (BTC) Price, BTC Analysis, btcusd, btcusdt
This could be interesting, too:
Chayanika Deka writes XRP, SOL, and ADA Inclusion in US Crypto Reserve Pushes Traders on Edge
Chayanika Deka writes Why Arthur Hayes Is Bullish on Bitcoin Under Trump’s Economic Strategy
Mandy Williams writes Why the Bitcoin Market Is Stuck—and the Key Metric That Could Change It: CryptoQuant CEO
Wayne Jones writes Metaplanet Acquires 156 BTC, Bringing Total Holdings to 2,391
Following a massive decline in early November, Bitcoin’s price has consequently suffered from extremely low volatility. The cryptocurrency has been consolidating with serious downward momentum since this significant drop.
Technical Analysis
By Shayan
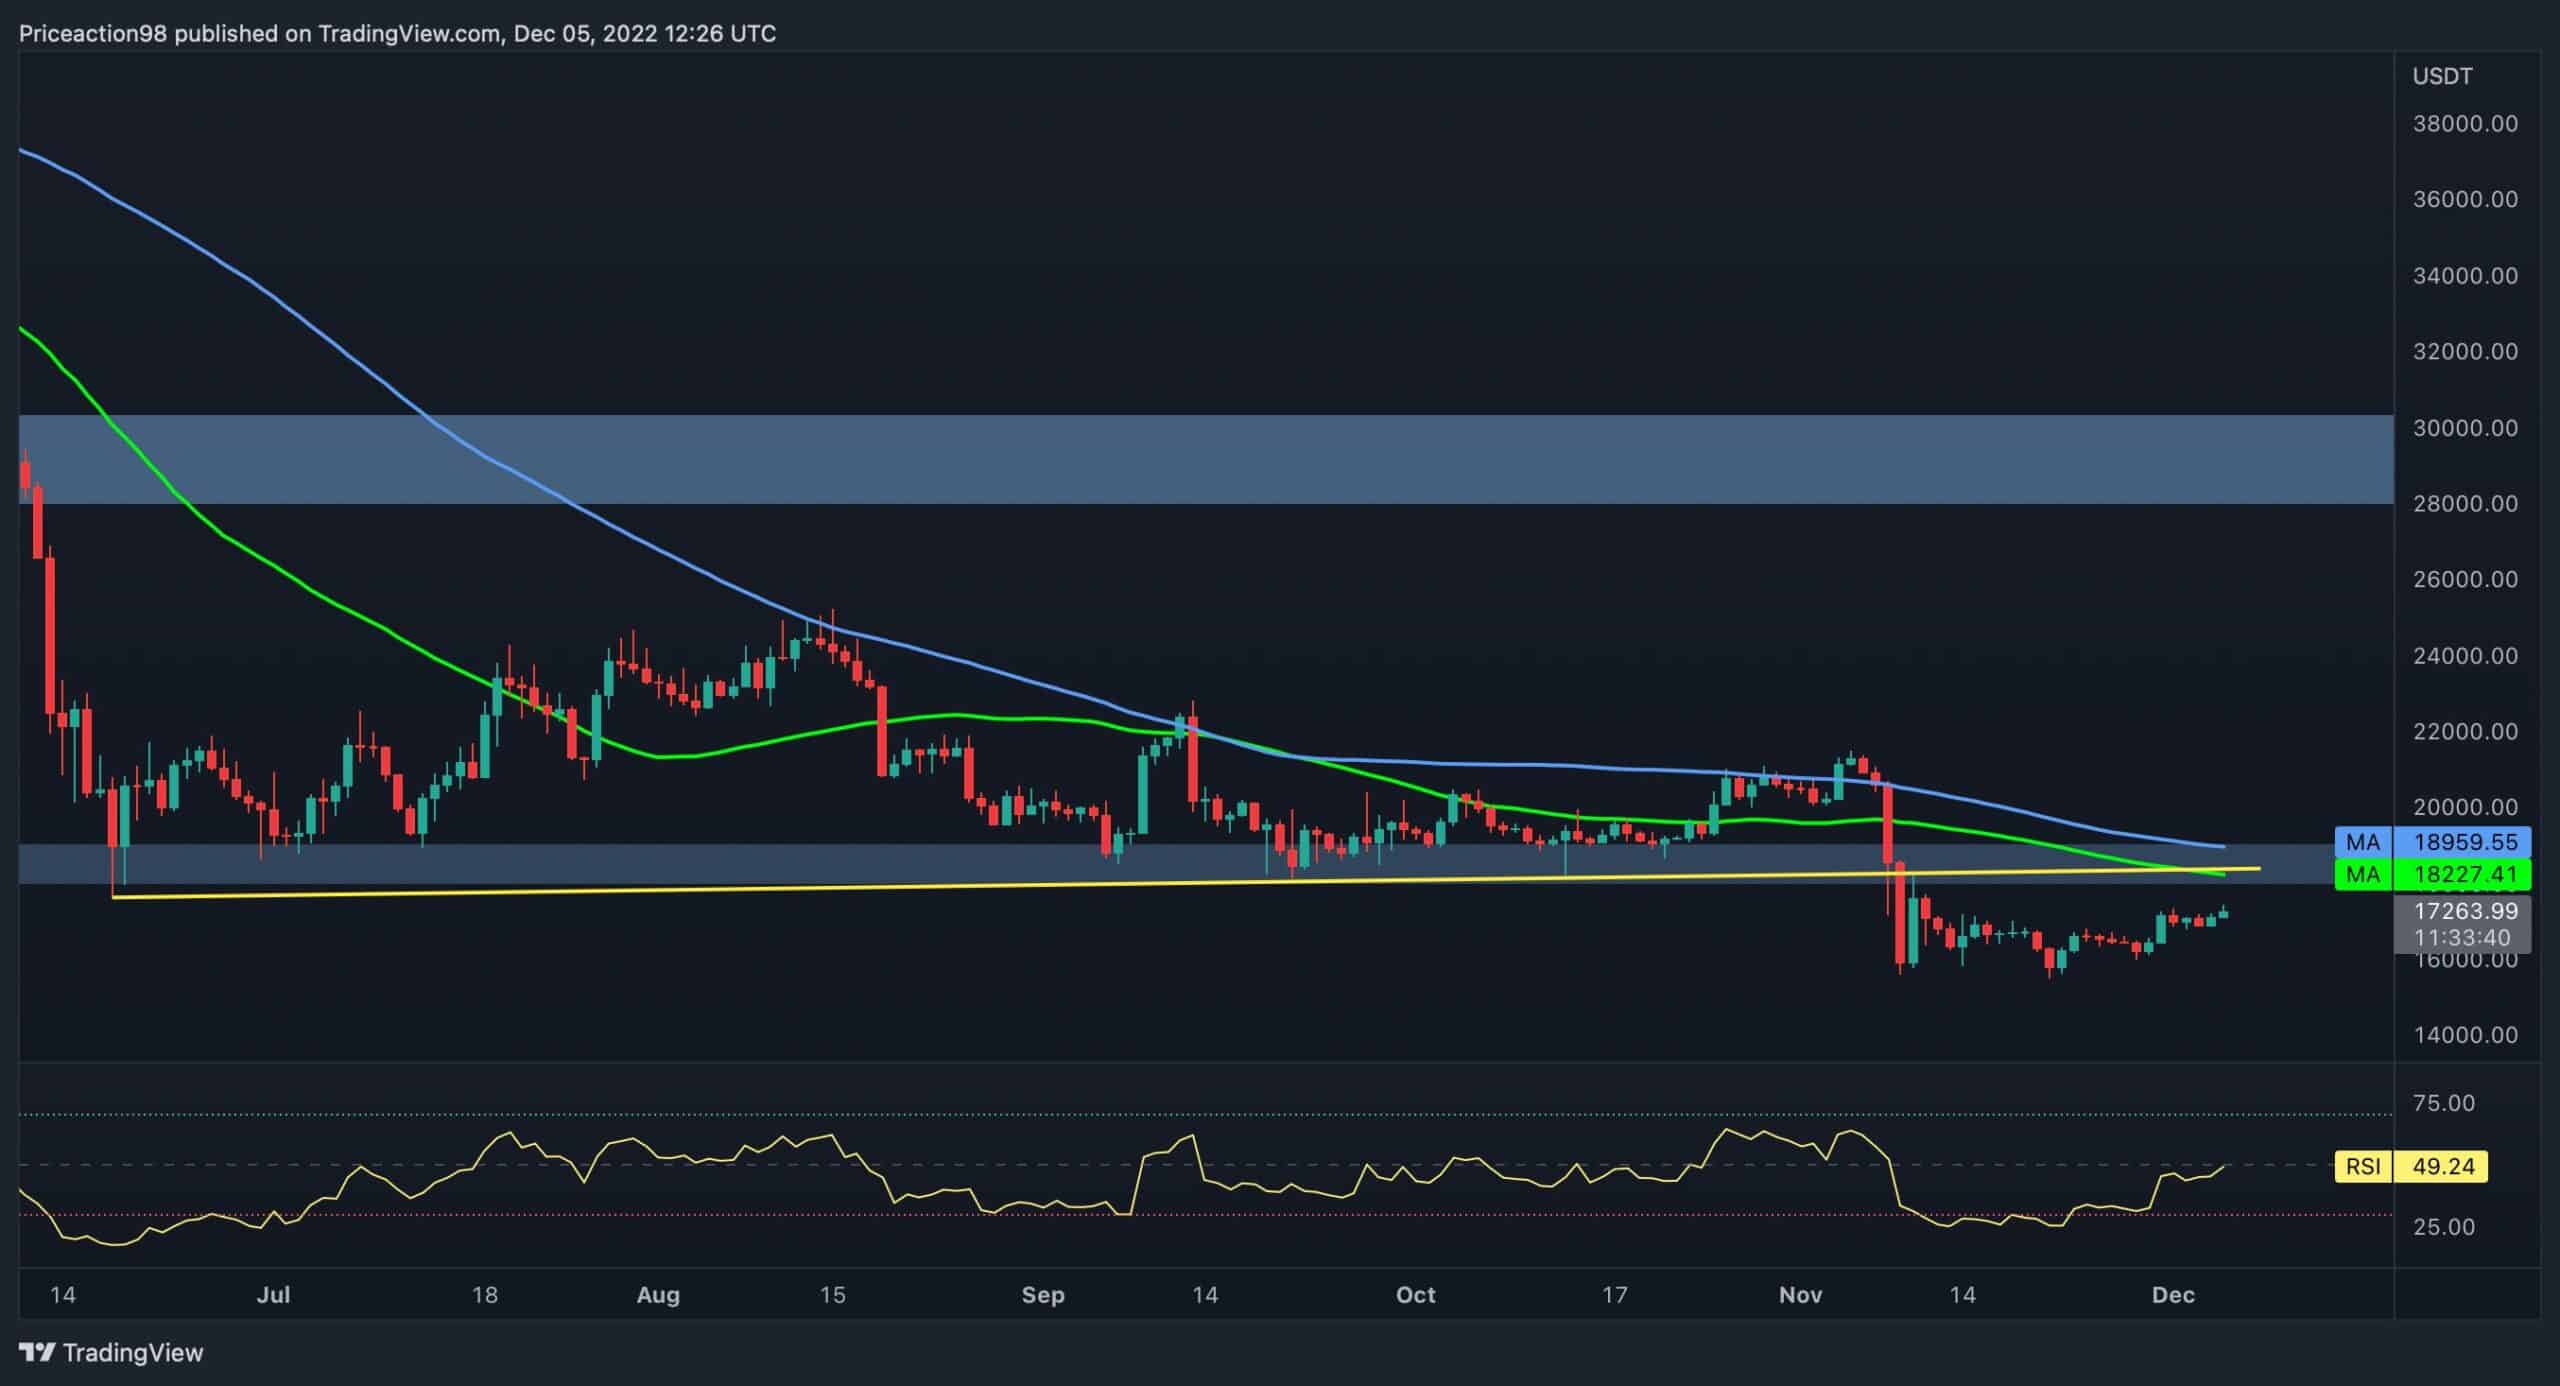
The Daily Chart
After falling below both the yellow trendline and the significant support level of $18K, the price is seeing very low volatility on the daily chart. A pullback to the trendline and the broken level is necessary before BTC continues to fall to lower levels.
The price has initiated a bullish rally toward the trendline to retest it as a pullback. However, the momentum appears to lack conviction.
On the other hand, the broken trendline and the 100-day moving average, sitting at roughly $19K, combine to make this static level a powerful resistance.
Therefore, the price seems likely to retest the $19K level and form another bearish leg toward the $15K level.
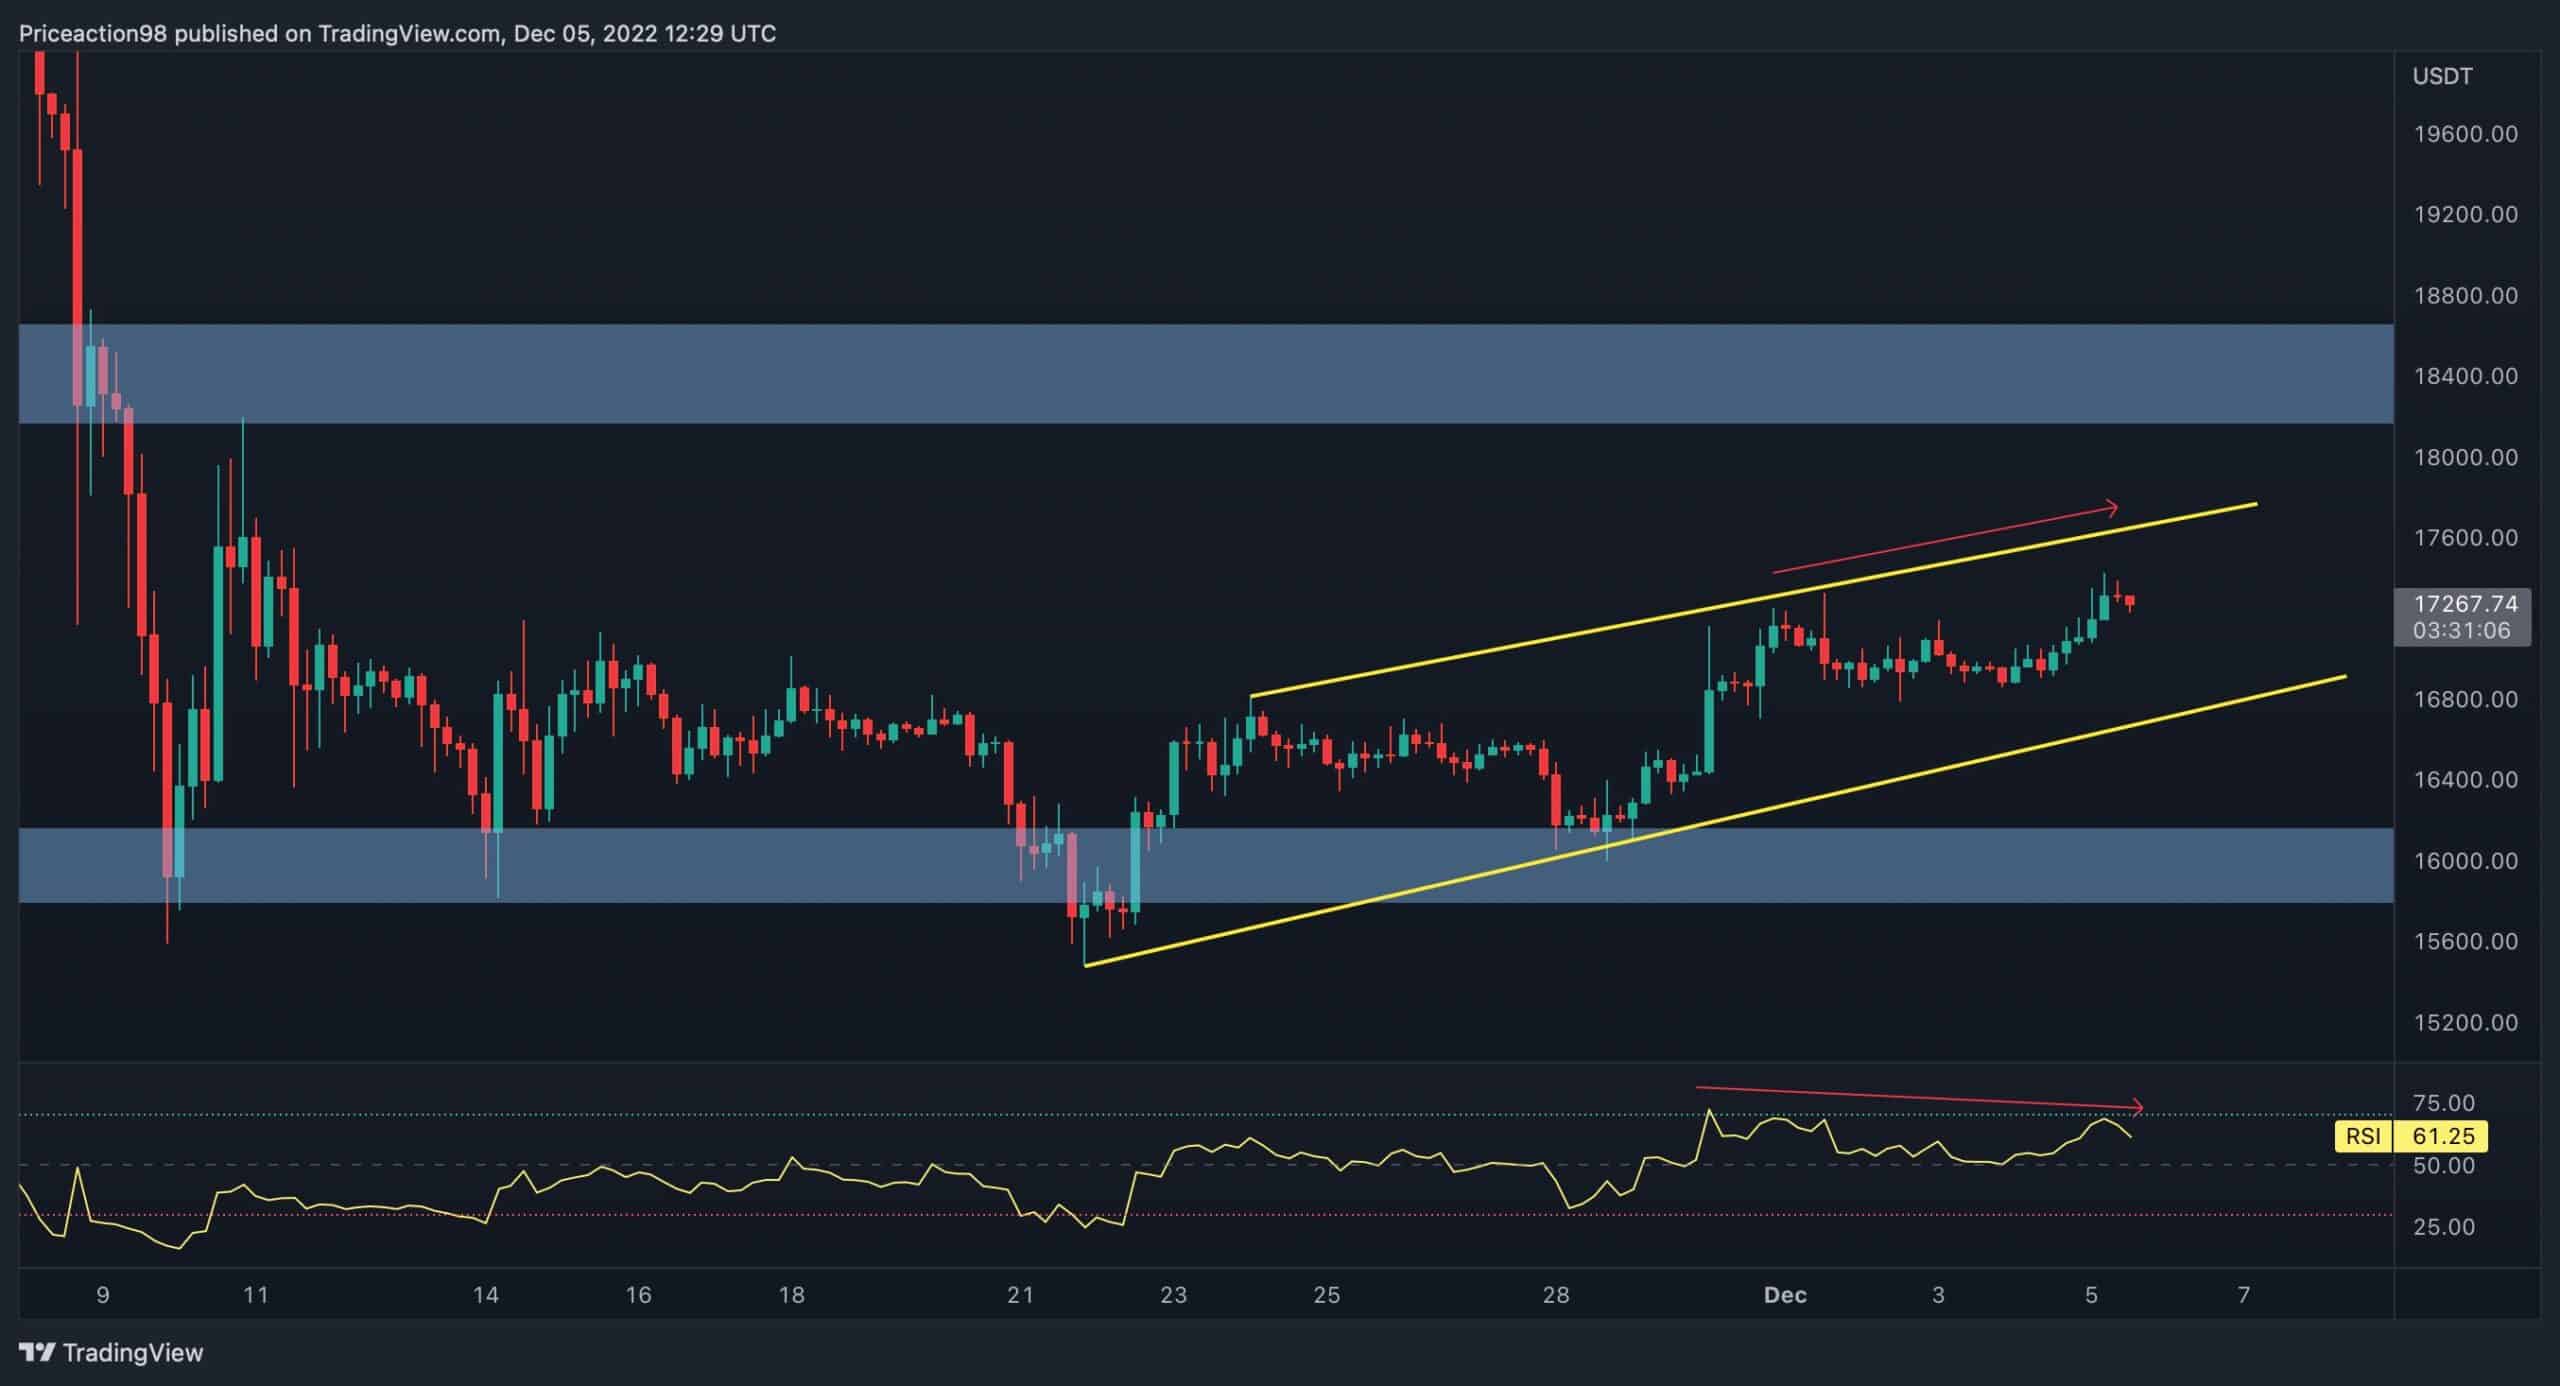
The 4-Hour Chart
On the 4-hour timeframe, Bitcoin has formed an ascending wedge pattern and is close to the top threshold. However, the bullish momentum needs to be stronger, and the price is also developing a double-top bearish pattern.
In addition, there is an evident bearish divergence between the price and the RSI indicator. In light of these factors, the price seems likely to consolidate toward the upper threshold of the wedge.
Considering the overall market sentiment and the bearish price action signs, rejection from the top trendline and another cascade are probable.