Bitcoin’s price has been oscillating in a very tight range heading into the new year’s holidays, offering little clue on the direction of the next significant move. Nevertheless, the market remains in a very decisive area, and its fate could be revealed in the next few days. Technical Analysis By: Edris The Daily Chart On the daily chart, the price has been grappling with the 50-day moving average around the ,700 mark for a while now but is yet to break it in any direction. In case of a bullish breakout, a rally towards the K level and even the higher boundary of the large falling wedge pattern could be expected. The mentioned wedge is considered a bullish reversal pattern in the current market condition and could initiate a mid-term bullish phase if broken to the
Topics:
CryptoVizArt considers the following as important: Bitcoin (BTC) Price, BTC Analysis, BTCEUR, BTCGBP, btcusd, btcusdt
This could be interesting, too:
Chayanika Deka writes XRP, SOL, and ADA Inclusion in US Crypto Reserve Pushes Traders on Edge
Chayanika Deka writes Why Arthur Hayes Is Bullish on Bitcoin Under Trump’s Economic Strategy
Mandy Williams writes Why the Bitcoin Market Is Stuck—and the Key Metric That Could Change It: CryptoQuant CEO
Wayne Jones writes Metaplanet Acquires 156 BTC, Bringing Total Holdings to 2,391
Bitcoin’s price has been oscillating in a very tight range heading into the new year’s holidays, offering little clue on the direction of the next significant move. Nevertheless, the market remains in a very decisive area, and its fate could be revealed in the next few days.
Technical Analysis
By: Edris
The Daily Chart
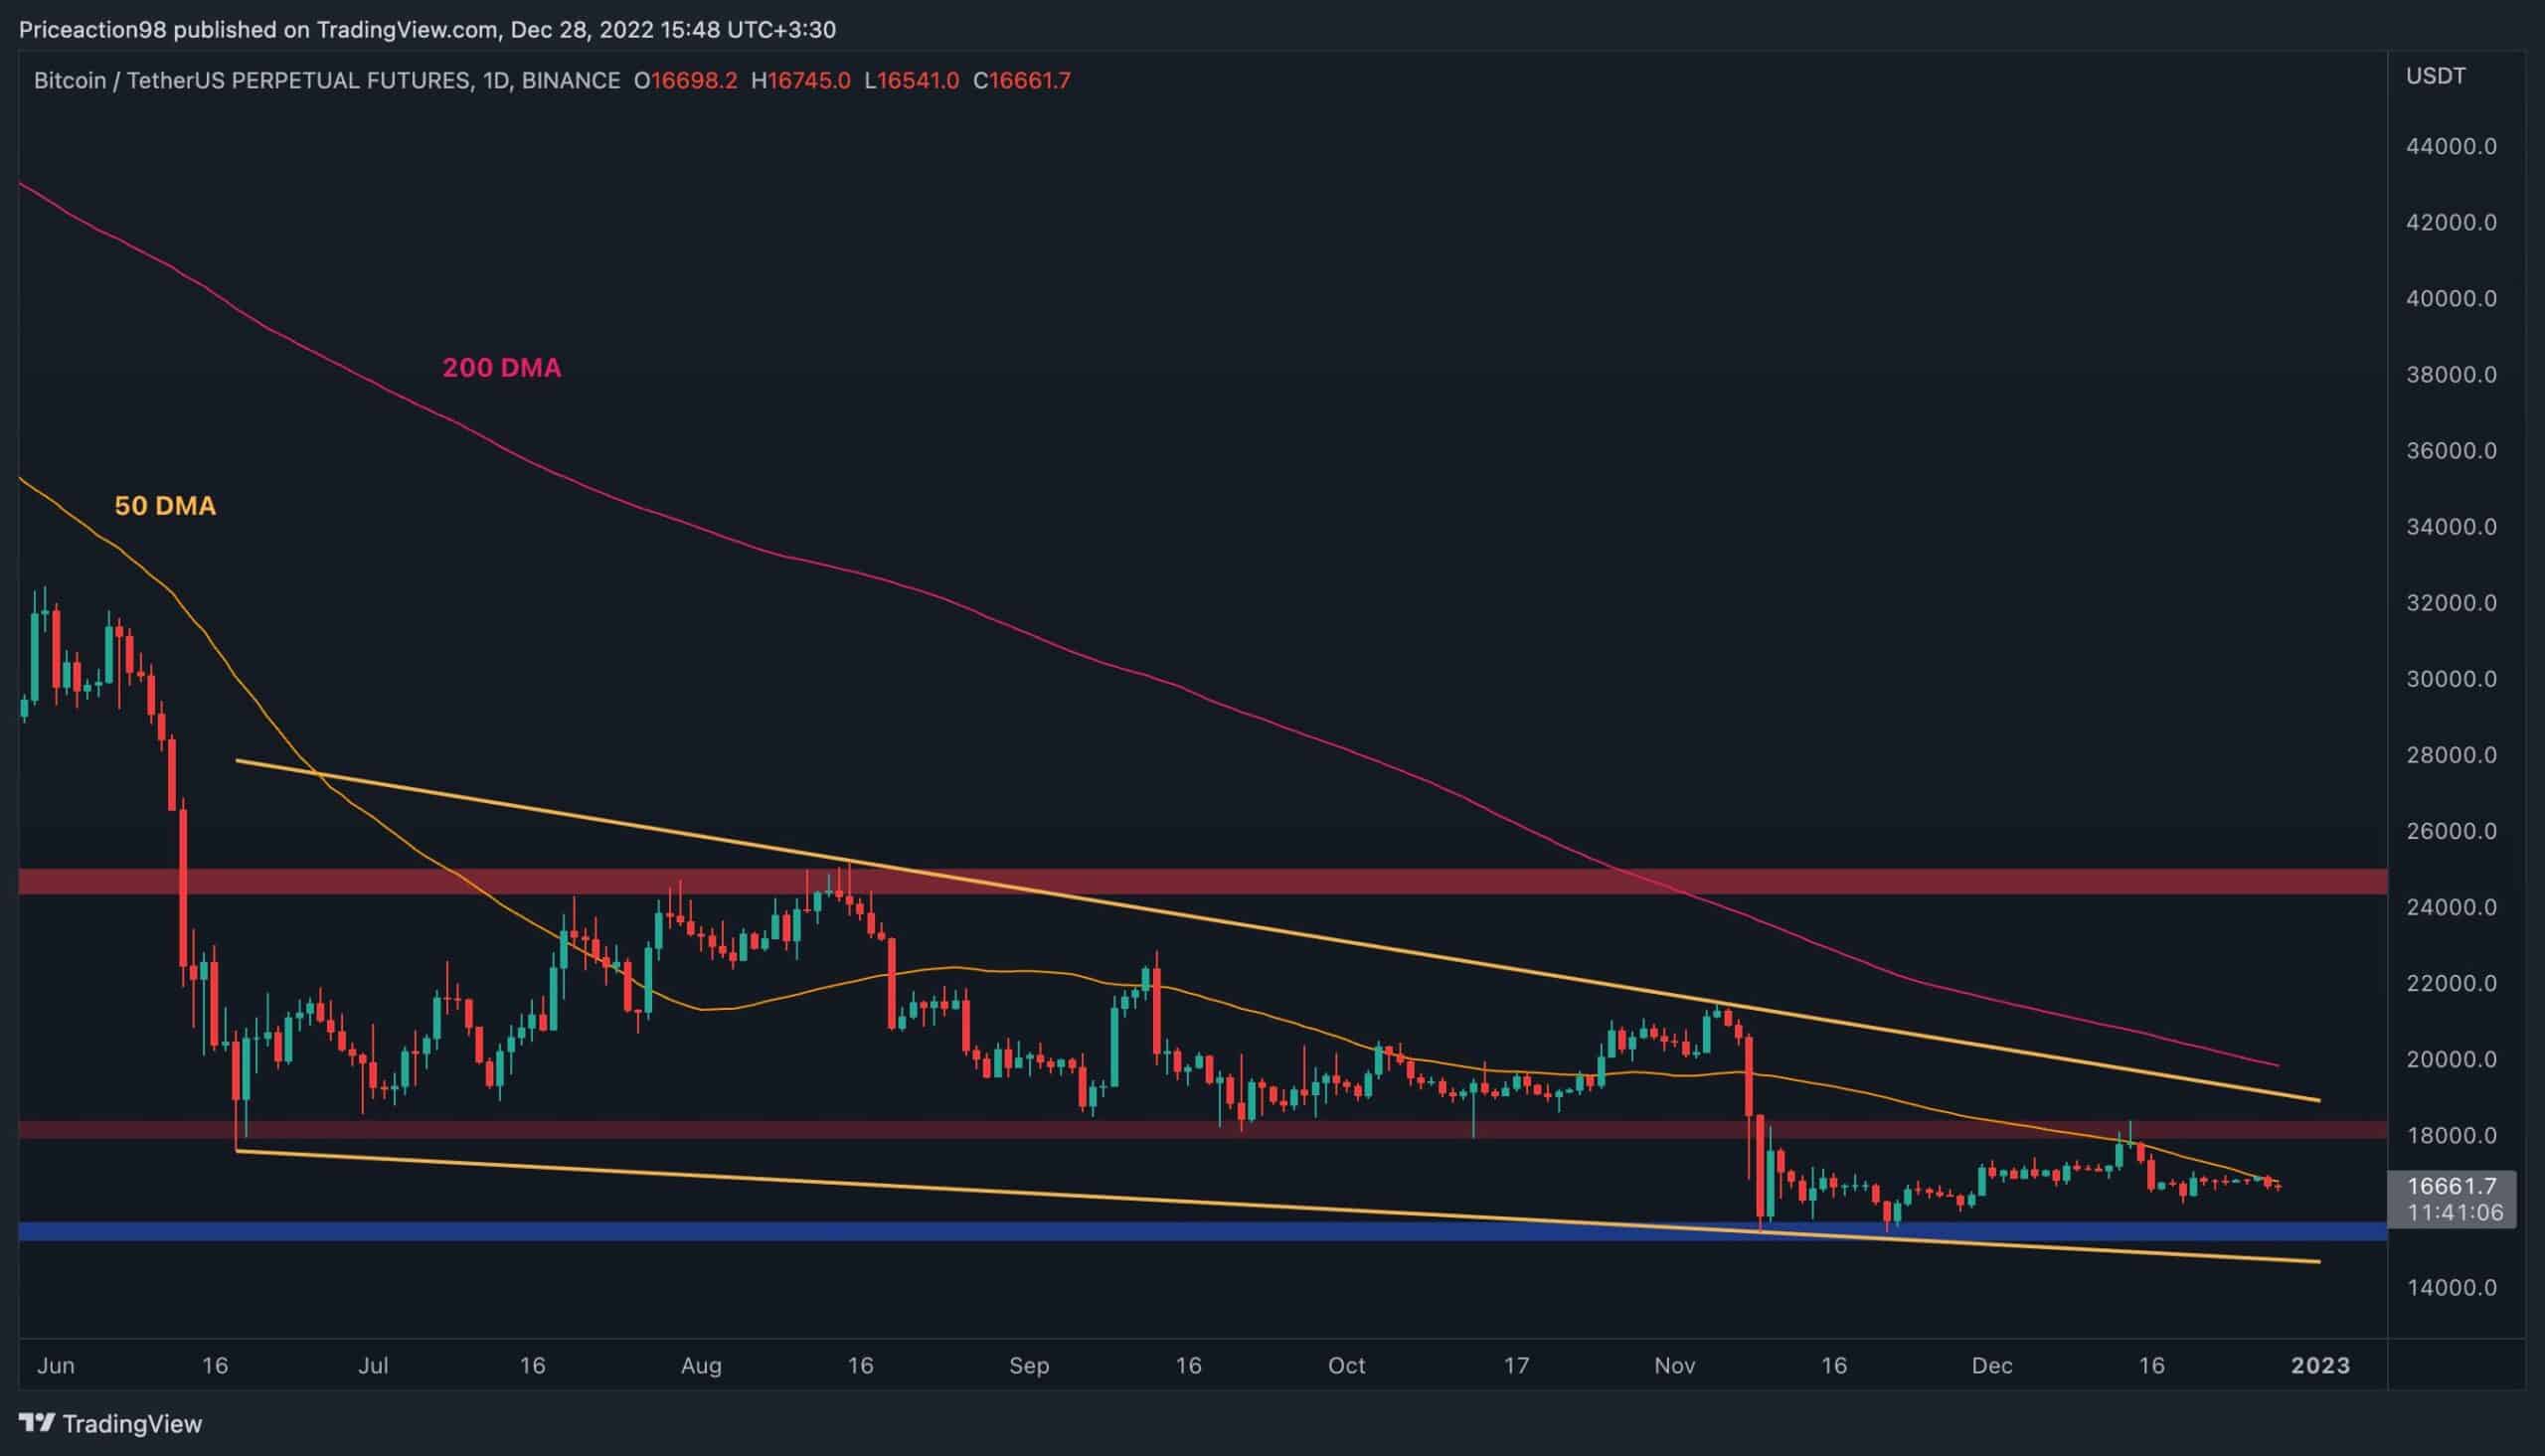
On the daily chart, the price has been grappling with the 50-day moving average around the $16,700 mark for a while now but is yet to break it in any direction. In case of a bullish breakout, a rally towards the $18K level and even the higher boundary of the large falling wedge pattern could be expected.
The mentioned wedge is considered a bullish reversal pattern in the current market condition and could initiate a mid-term bullish phase if broken to the upside. On the other hand, if the 50-day moving average holds and rejects the price lower, a drop toward the $15K area and the lower trendline of the falling wedge would be imminent.
The 4-Hour Chart
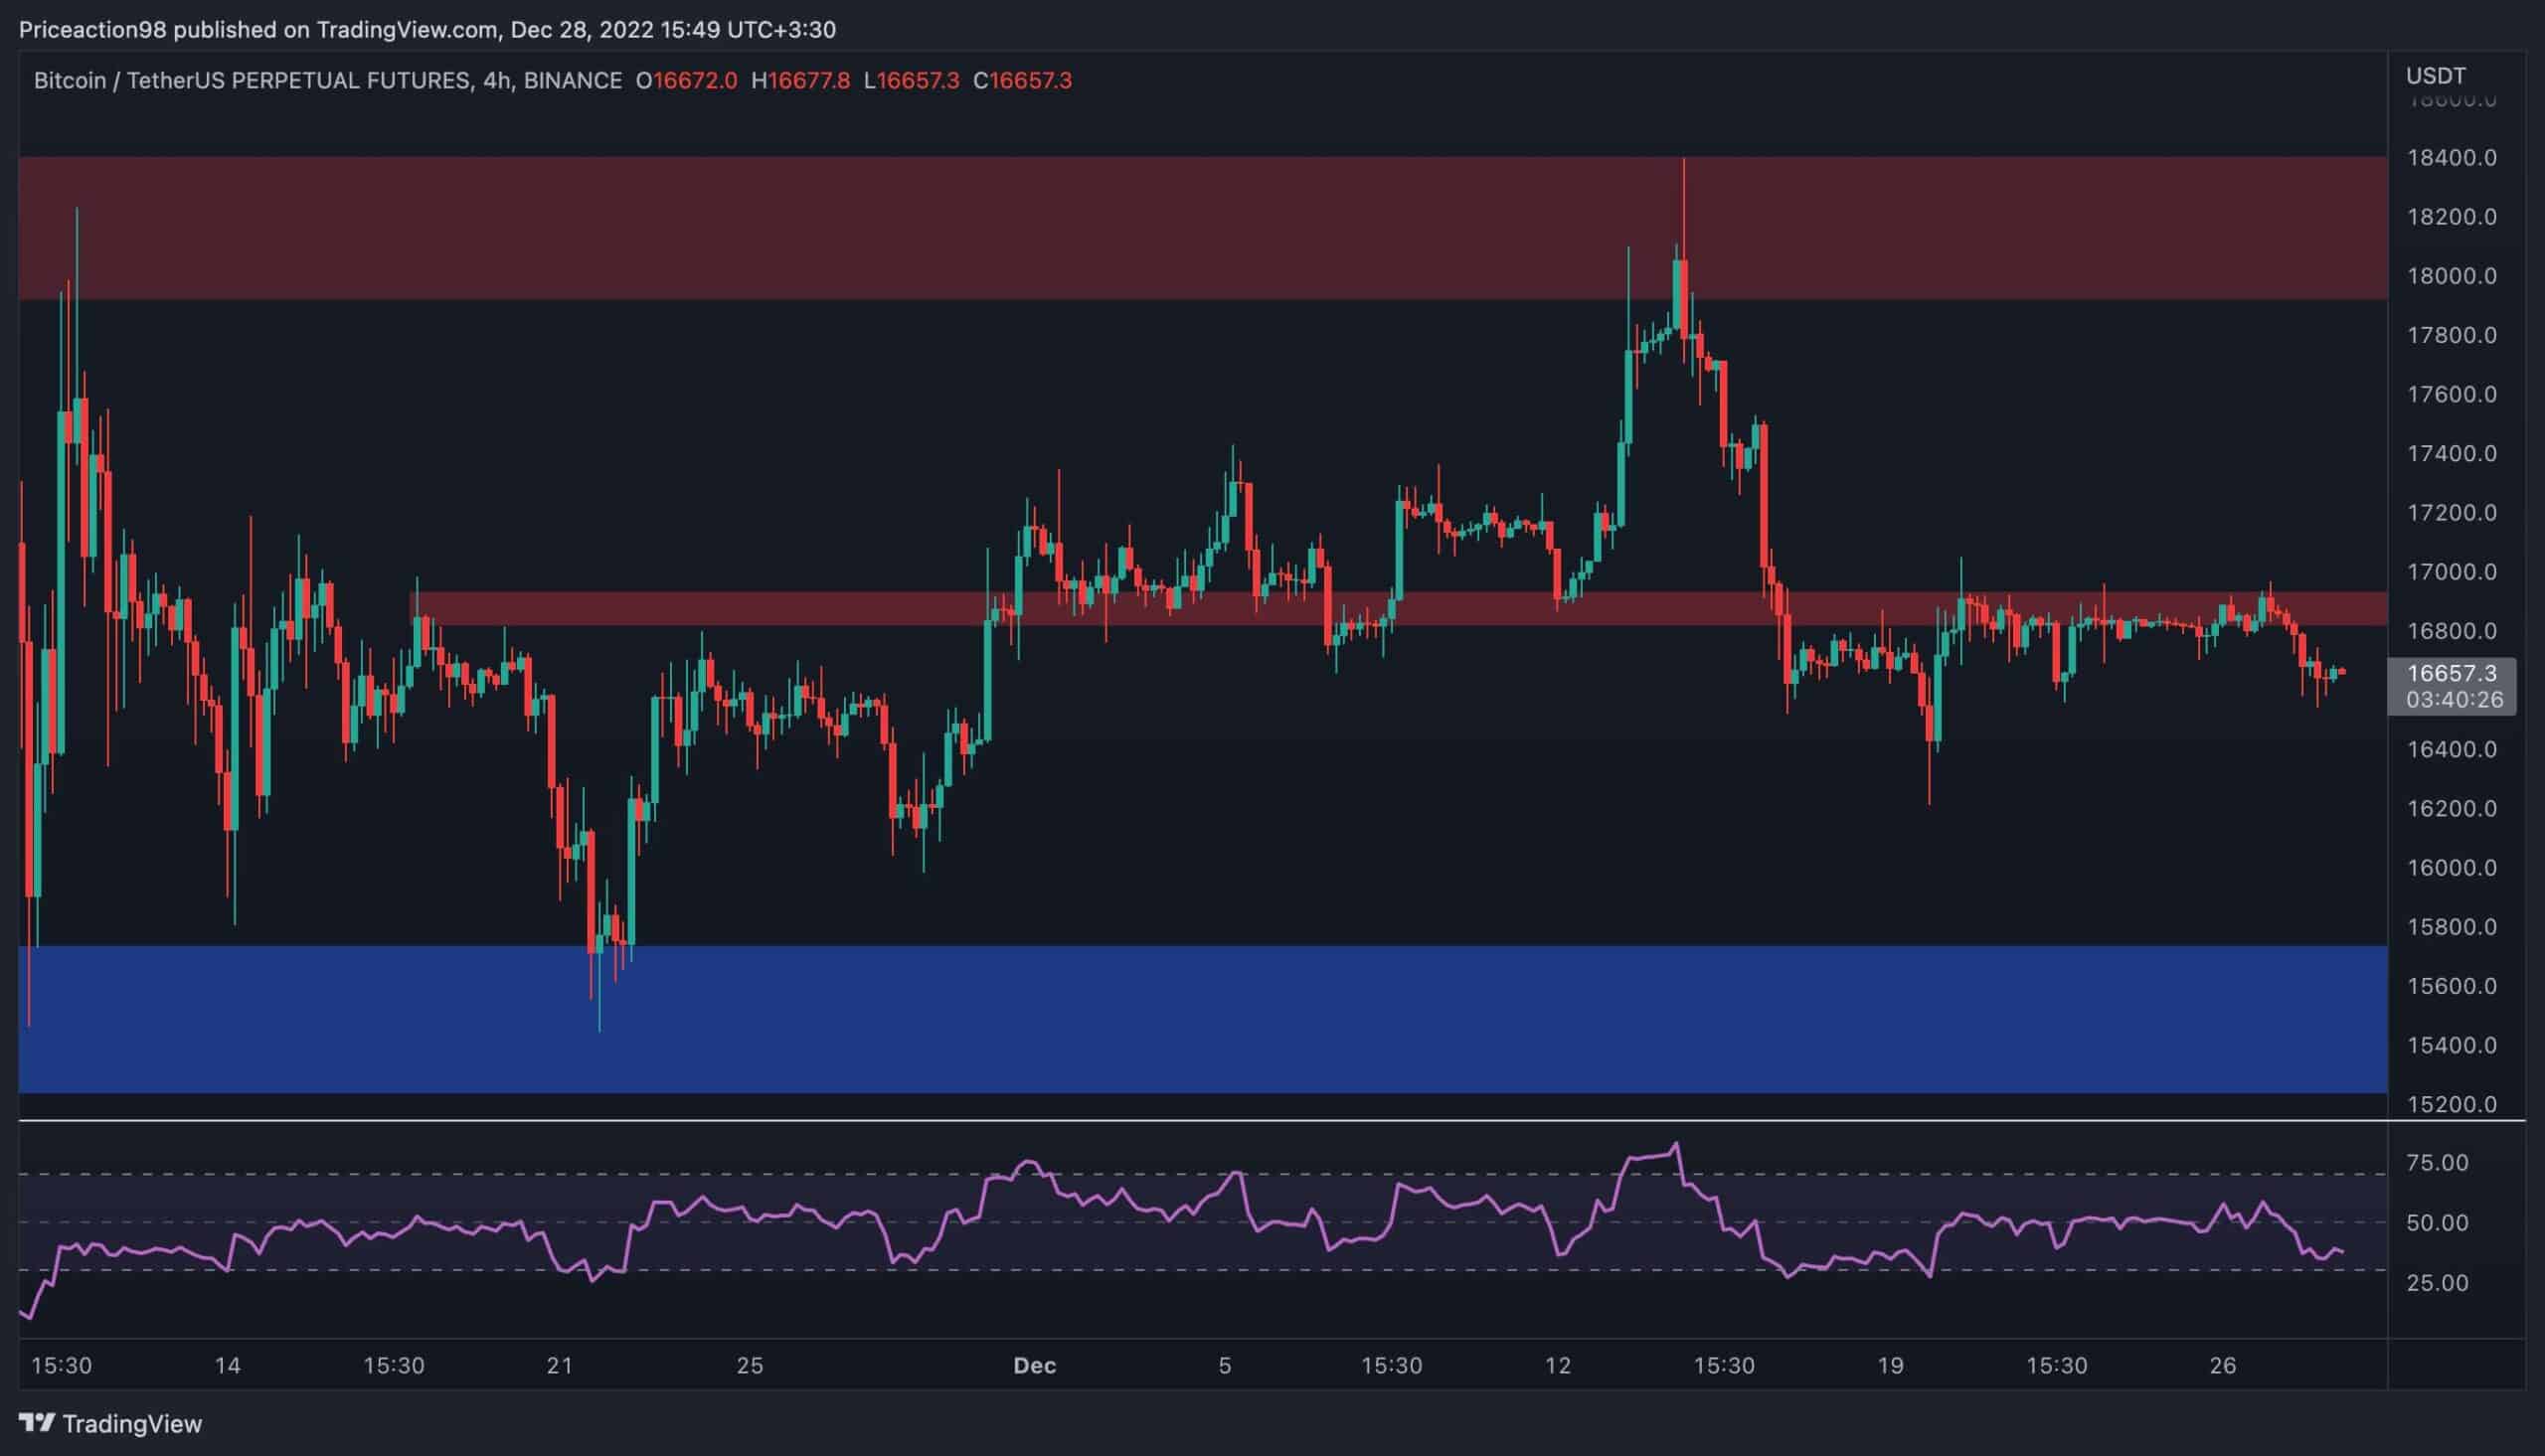
Looking at the 4-hour timeframe, it is evident that the price has finally dropped from the $16,900 level after testing it multiple times over the last week.
However, the recent candles demonstrate the price’s reluctance to drop rapidly, pointing to another possible retest of the mentioned resistance level.
All things considered, as far as the price resides below the $17K mark, a decline toward the $15K range would be the most likely outcome. The RSI indicator also shows values below 50, which signals that the momentum is in favor of the bears, further adding to the probability of a plunge in the short term.
On-chain Analysis
By: Edris
Bitcoin Long-term Holder SOPR
Bitcoin’s long-term holders are an essential cohort, as their behavior offers valuable insights into future market trends. The long-term holders’ SOPR is a powerful metric that measures the ratio of profits and losses realized by these market participants and is one of the go-to metrics for on-chain analysis. Values above 1 indicate realized profits, and values below 1 indicate losses.
This chart demonstrates the 100-day standard moving average of the LTH SOPR. The metric has been declining for over a year now, pointing to the fact that the long-term holders’ profit margin was constantly decreasing and has dropped below 1 in the last few months, as these investors have been realizing losses for a while now.
However, the metric has recently reached an exciting level, which marked the previous cycle’s bear market bottoms. Therefore, from a macro and multi-cyclical standpoint, the bear market bottom range does not seem far and may even be forming at the moment.
