This week’s CPI announcement was a significant relief for Bitcoin investors, as declining inflation would likely lead to a bullish trend for risk assets. However, there is still room for caution from a technical analysis standpoint, as the price has yet to break any major resistance level. Technical Analysis By: Edris The Daily Chart On the daily timeframe, the price has finally reached the K resistance area and is currently trying to break it to the upside. The 50-day moving average, located around the same price, is providing additional resistance at the moment. It’s important to note that a bullish breakout from this significant resistance level could likely lead to a further rally towards the higher boundary of the large descending channel around the K mark. In
Topics:
CryptoVizArt considers the following as important: Bitcoin (BTC) Price, BTC Analysis, BTCEUR, BTCGBP, btcusd, btcusdt
This could be interesting, too:
Chayanika Deka writes XRP, SOL, and ADA Inclusion in US Crypto Reserve Pushes Traders on Edge
Chayanika Deka writes Why Arthur Hayes Is Bullish on Bitcoin Under Trump’s Economic Strategy
Mandy Williams writes Why the Bitcoin Market Is Stuck—and the Key Metric That Could Change It: CryptoQuant CEO
Wayne Jones writes Metaplanet Acquires 156 BTC, Bringing Total Holdings to 2,391
This week’s CPI announcement was a significant relief for Bitcoin investors, as declining inflation would likely lead to a bullish trend for risk assets. However, there is still room for caution from a technical analysis standpoint, as the price has yet to break any major resistance level.
Technical Analysis
By: Edris
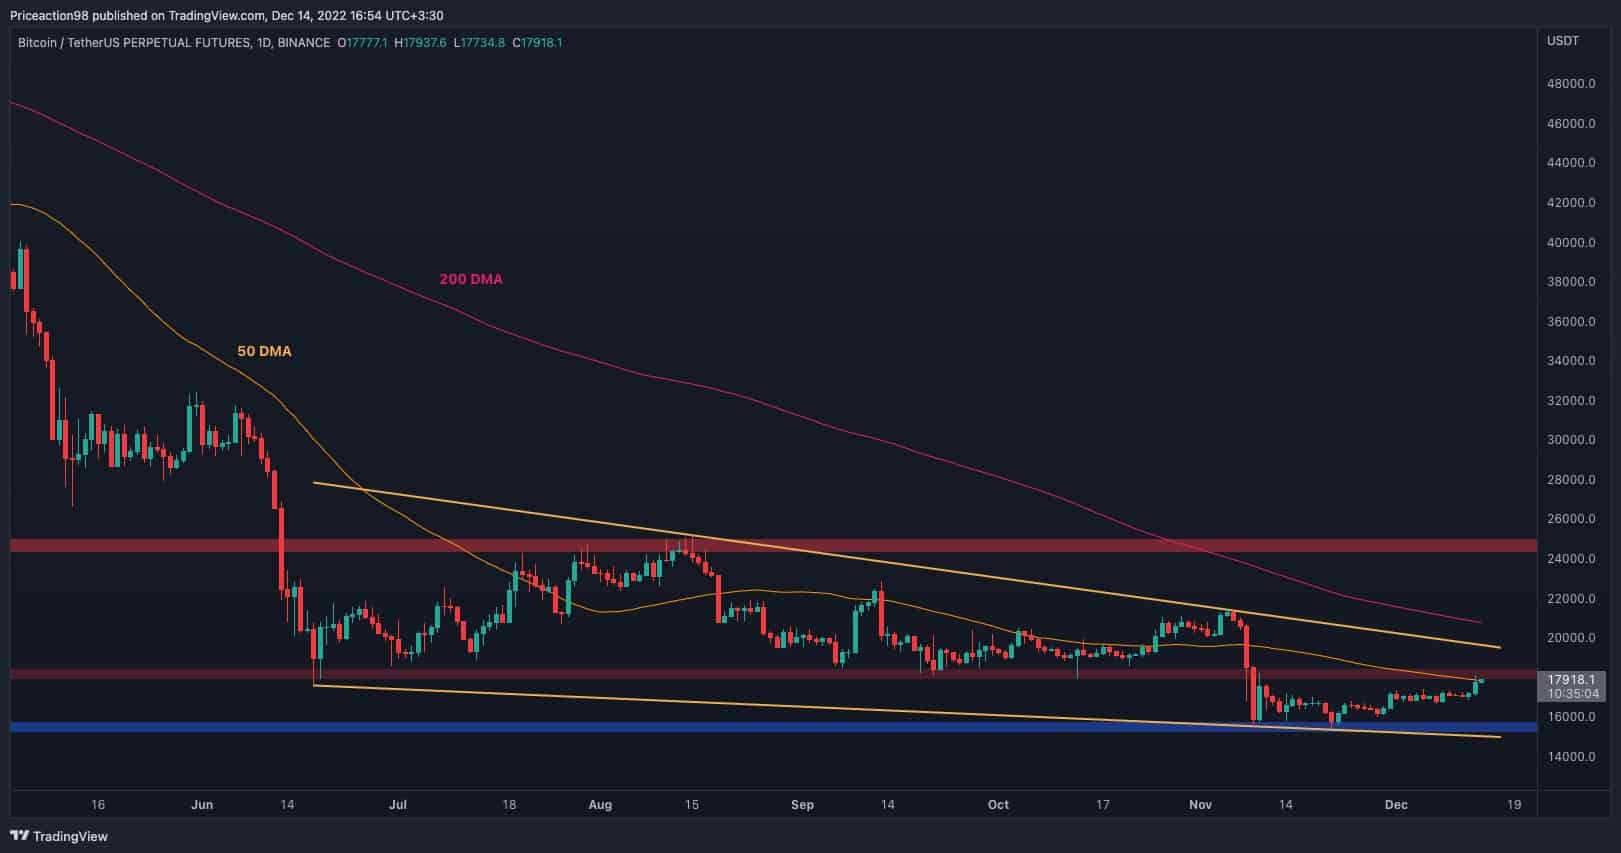
The Daily Chart
On the daily timeframe, the price has finally reached the $18K resistance area and is currently trying to break it to the upside. The 50-day moving average, located around the same price, is providing additional resistance at the moment.
It’s important to note that a bullish breakout from this significant resistance level could likely lead to a further rally towards the higher boundary of the large descending channel around the $20K mark.
In opposition, if the price gets rejected to the downside, a rapid decline toward the $15K support area would be probable, as there would be no obstacle to holding the price on this timeframe.
The 4-Hour Chart
Looking at the 4-hour chart, the price has finally broken above the $17K mark and is testing the $18K resistance. A breakout from the mentioned level could pave the way for a surge toward $21K in the short term.
However, the RSI indicator is already showcasing a red flag, as the indicator is deep into the overbought area, currently trending around the 80% mark. This signal could point to a pullback or bearish reversal in the coming days, leading to a likely retest of the $17K area.
Considering the relatively high likelihood for the Feds to ease back on the rate hikes and the price’s recent bullish momentum, a breakout above $18K would be the more probable outcome.
The RSI overbought signal should not be taken lightly, especially until the price still trades below the mentioned $18K resistance level.
