The Bitcoin market is often full of surprises and last week was no exception. Bearish sentiment was dominant, and the cryptocurrency seemed to be days away from creating a new lower low. However, a significant price rally has changed the view from a technical aspect. Technical Analysis By: Edris The Daily Chart Looking at the daily timeframe, Bitcoin has bounced back from the key K support level once more, and rallied impulsively above the K mark last week. The price has currently reached the 50-day and 100-day moving average lines, which are converging around the K area. If the price breaks these moving averages to the upside, a crossover between them would occur, which is a strong bullish signal. However, in order for the market to be considered bullish in the
Topics:
CryptoVizArt considers the following as important: Bitcoin (BTC) Price, BTC Analysis, btcusd, btcusdt
This could be interesting, too:
Chayanika Deka writes XRP, SOL, and ADA Inclusion in US Crypto Reserve Pushes Traders on Edge
Chayanika Deka writes Why Arthur Hayes Is Bullish on Bitcoin Under Trump’s Economic Strategy
Mandy Williams writes Why the Bitcoin Market Is Stuck—and the Key Metric That Could Change It: CryptoQuant CEO
Wayne Jones writes Metaplanet Acquires 156 BTC, Bringing Total Holdings to 2,391
The Bitcoin market is often full of surprises and last week was no exception. Bearish sentiment was dominant, and the cryptocurrency seemed to be days away from creating a new lower low. However, a significant price rally has changed the view from a technical aspect.
Technical Analysis
By: Edris
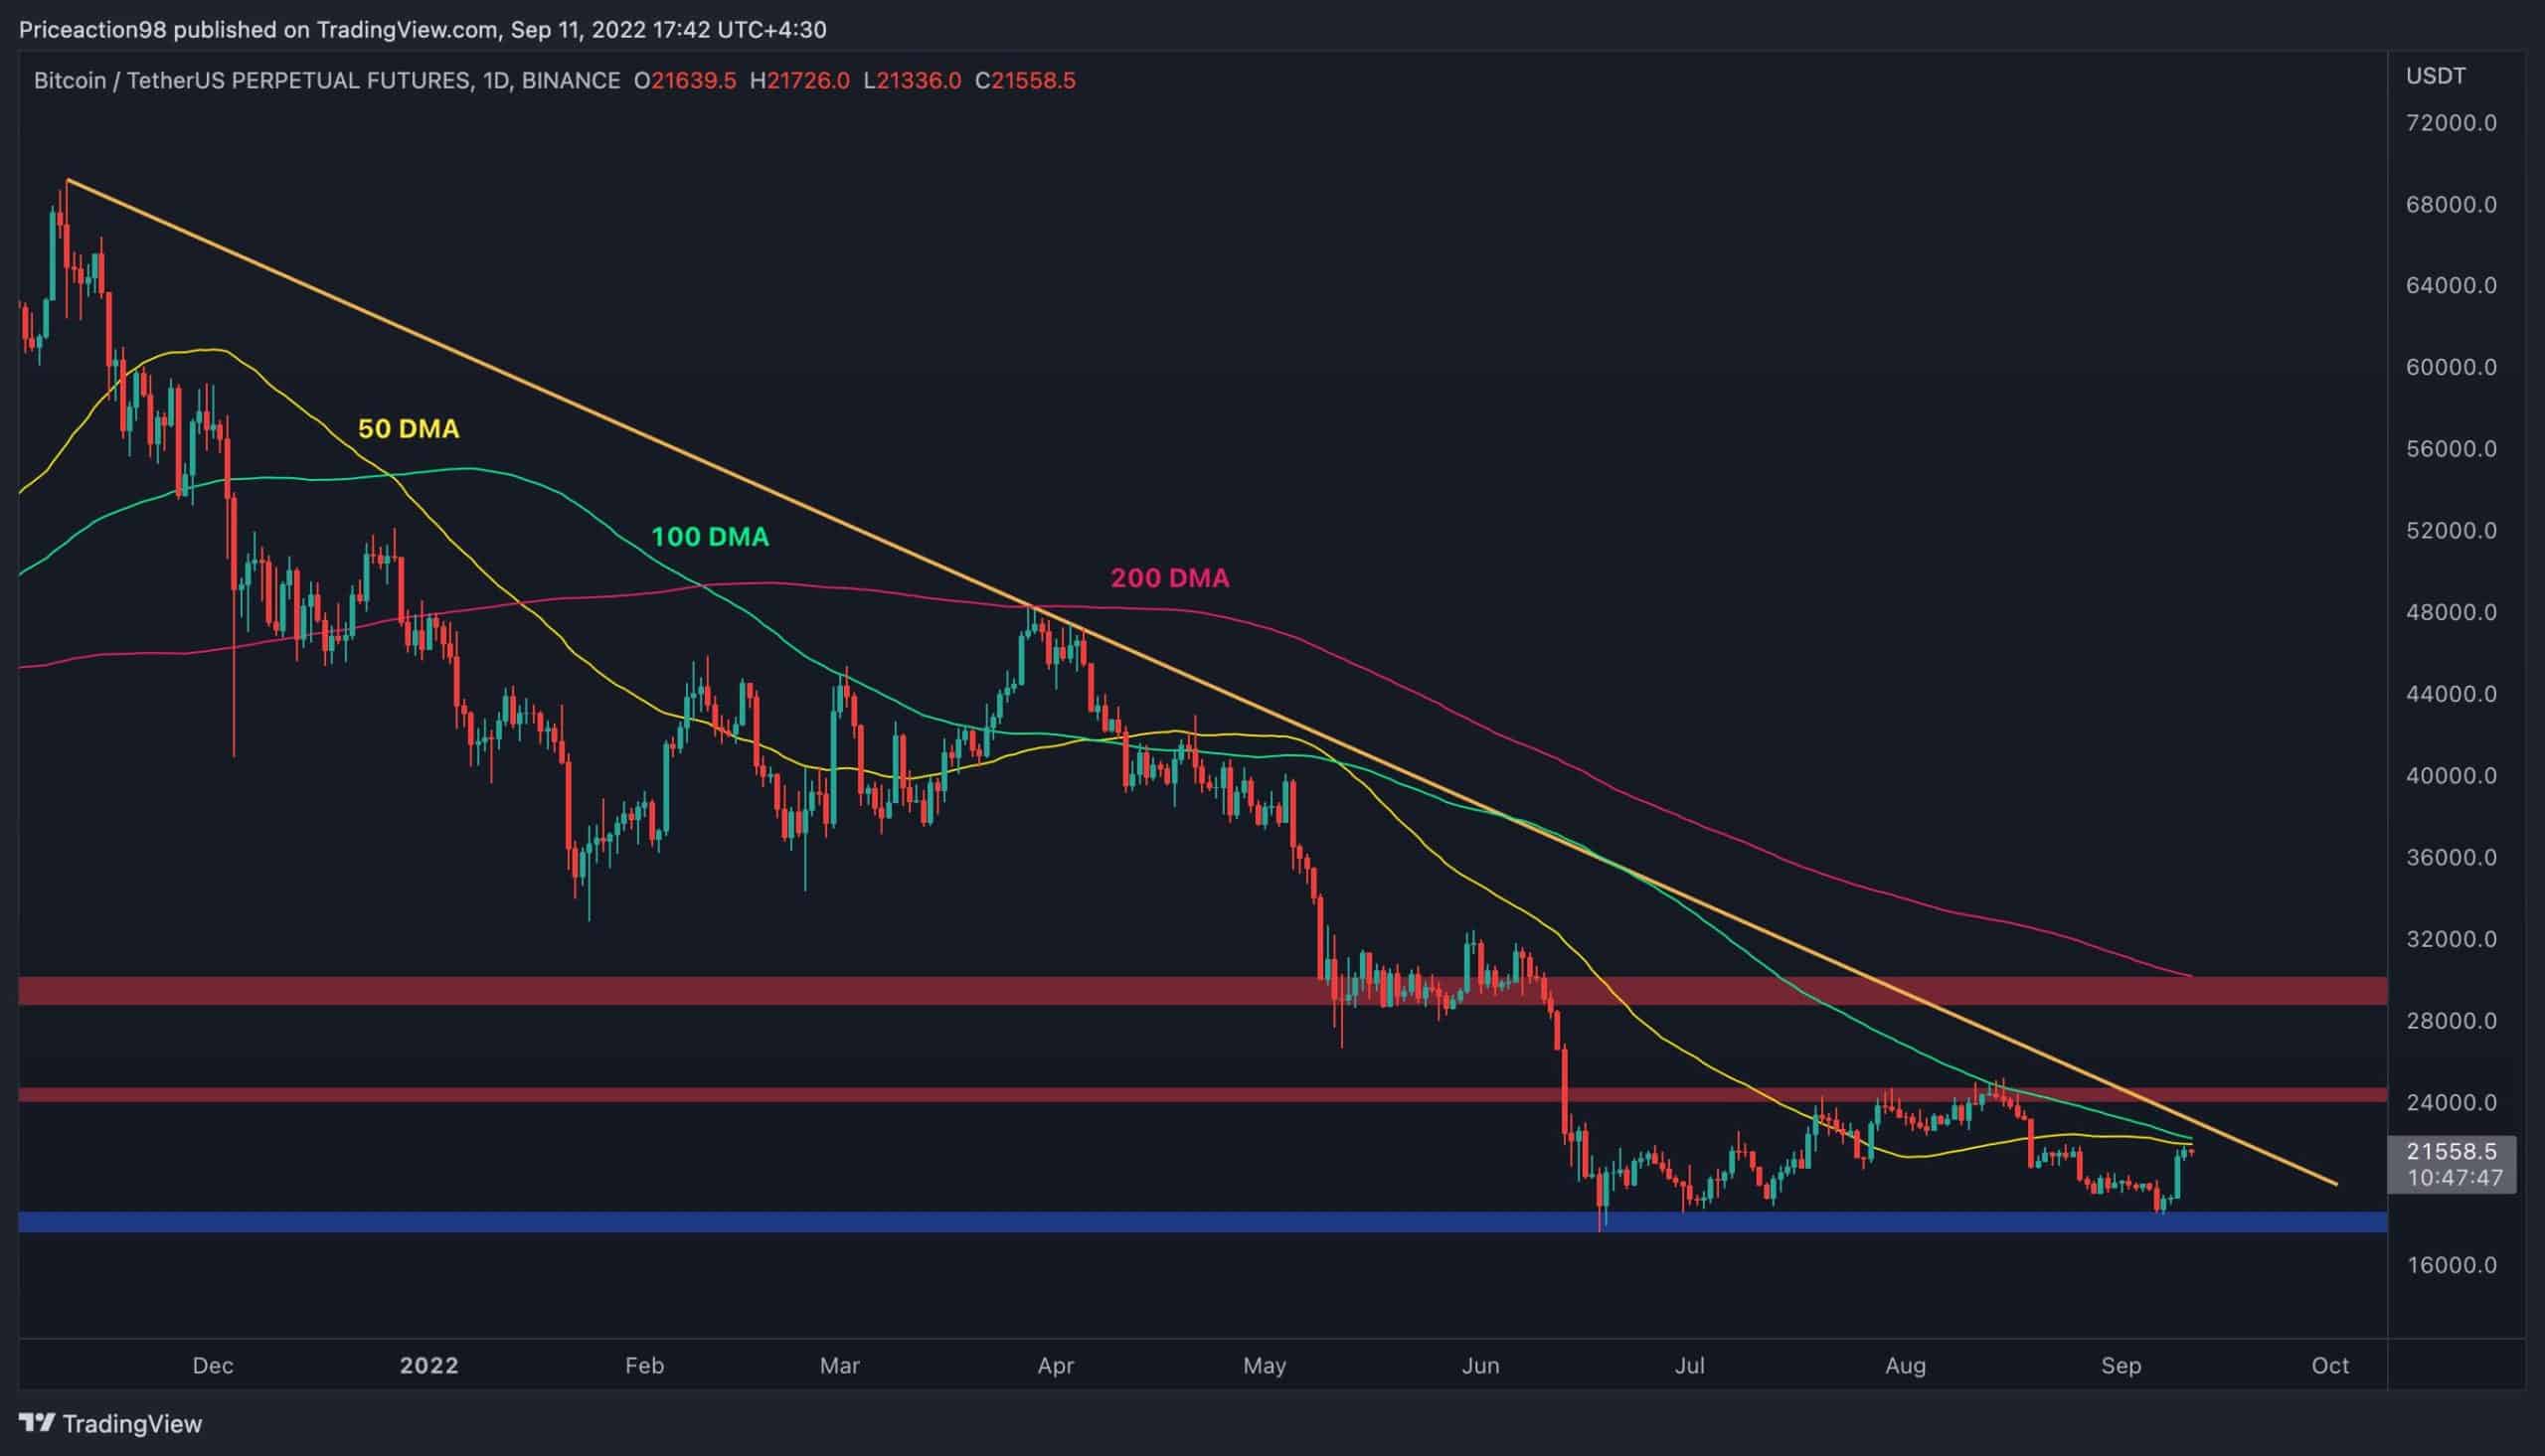
The Daily Chart
Looking at the daily timeframe, Bitcoin has bounced back from the key $18K support level once more, and rallied impulsively above the $20K mark last week. The price has currently reached the 50-day and 100-day moving average lines, which are converging around the $22K area.
If the price breaks these moving averages to the upside, a crossover between them would occur, which is a strong bullish signal. However, in order for the market to be considered bullish in the mid-term, a breakout above the significant trendline demonstrated on the chart and the $24K resistance level would be necessary.
On the other hand, if the price gets rejected from either of the mentioned static and dynamic resistance levels, a return towards the $18K level and even a breakout below it would be probable.
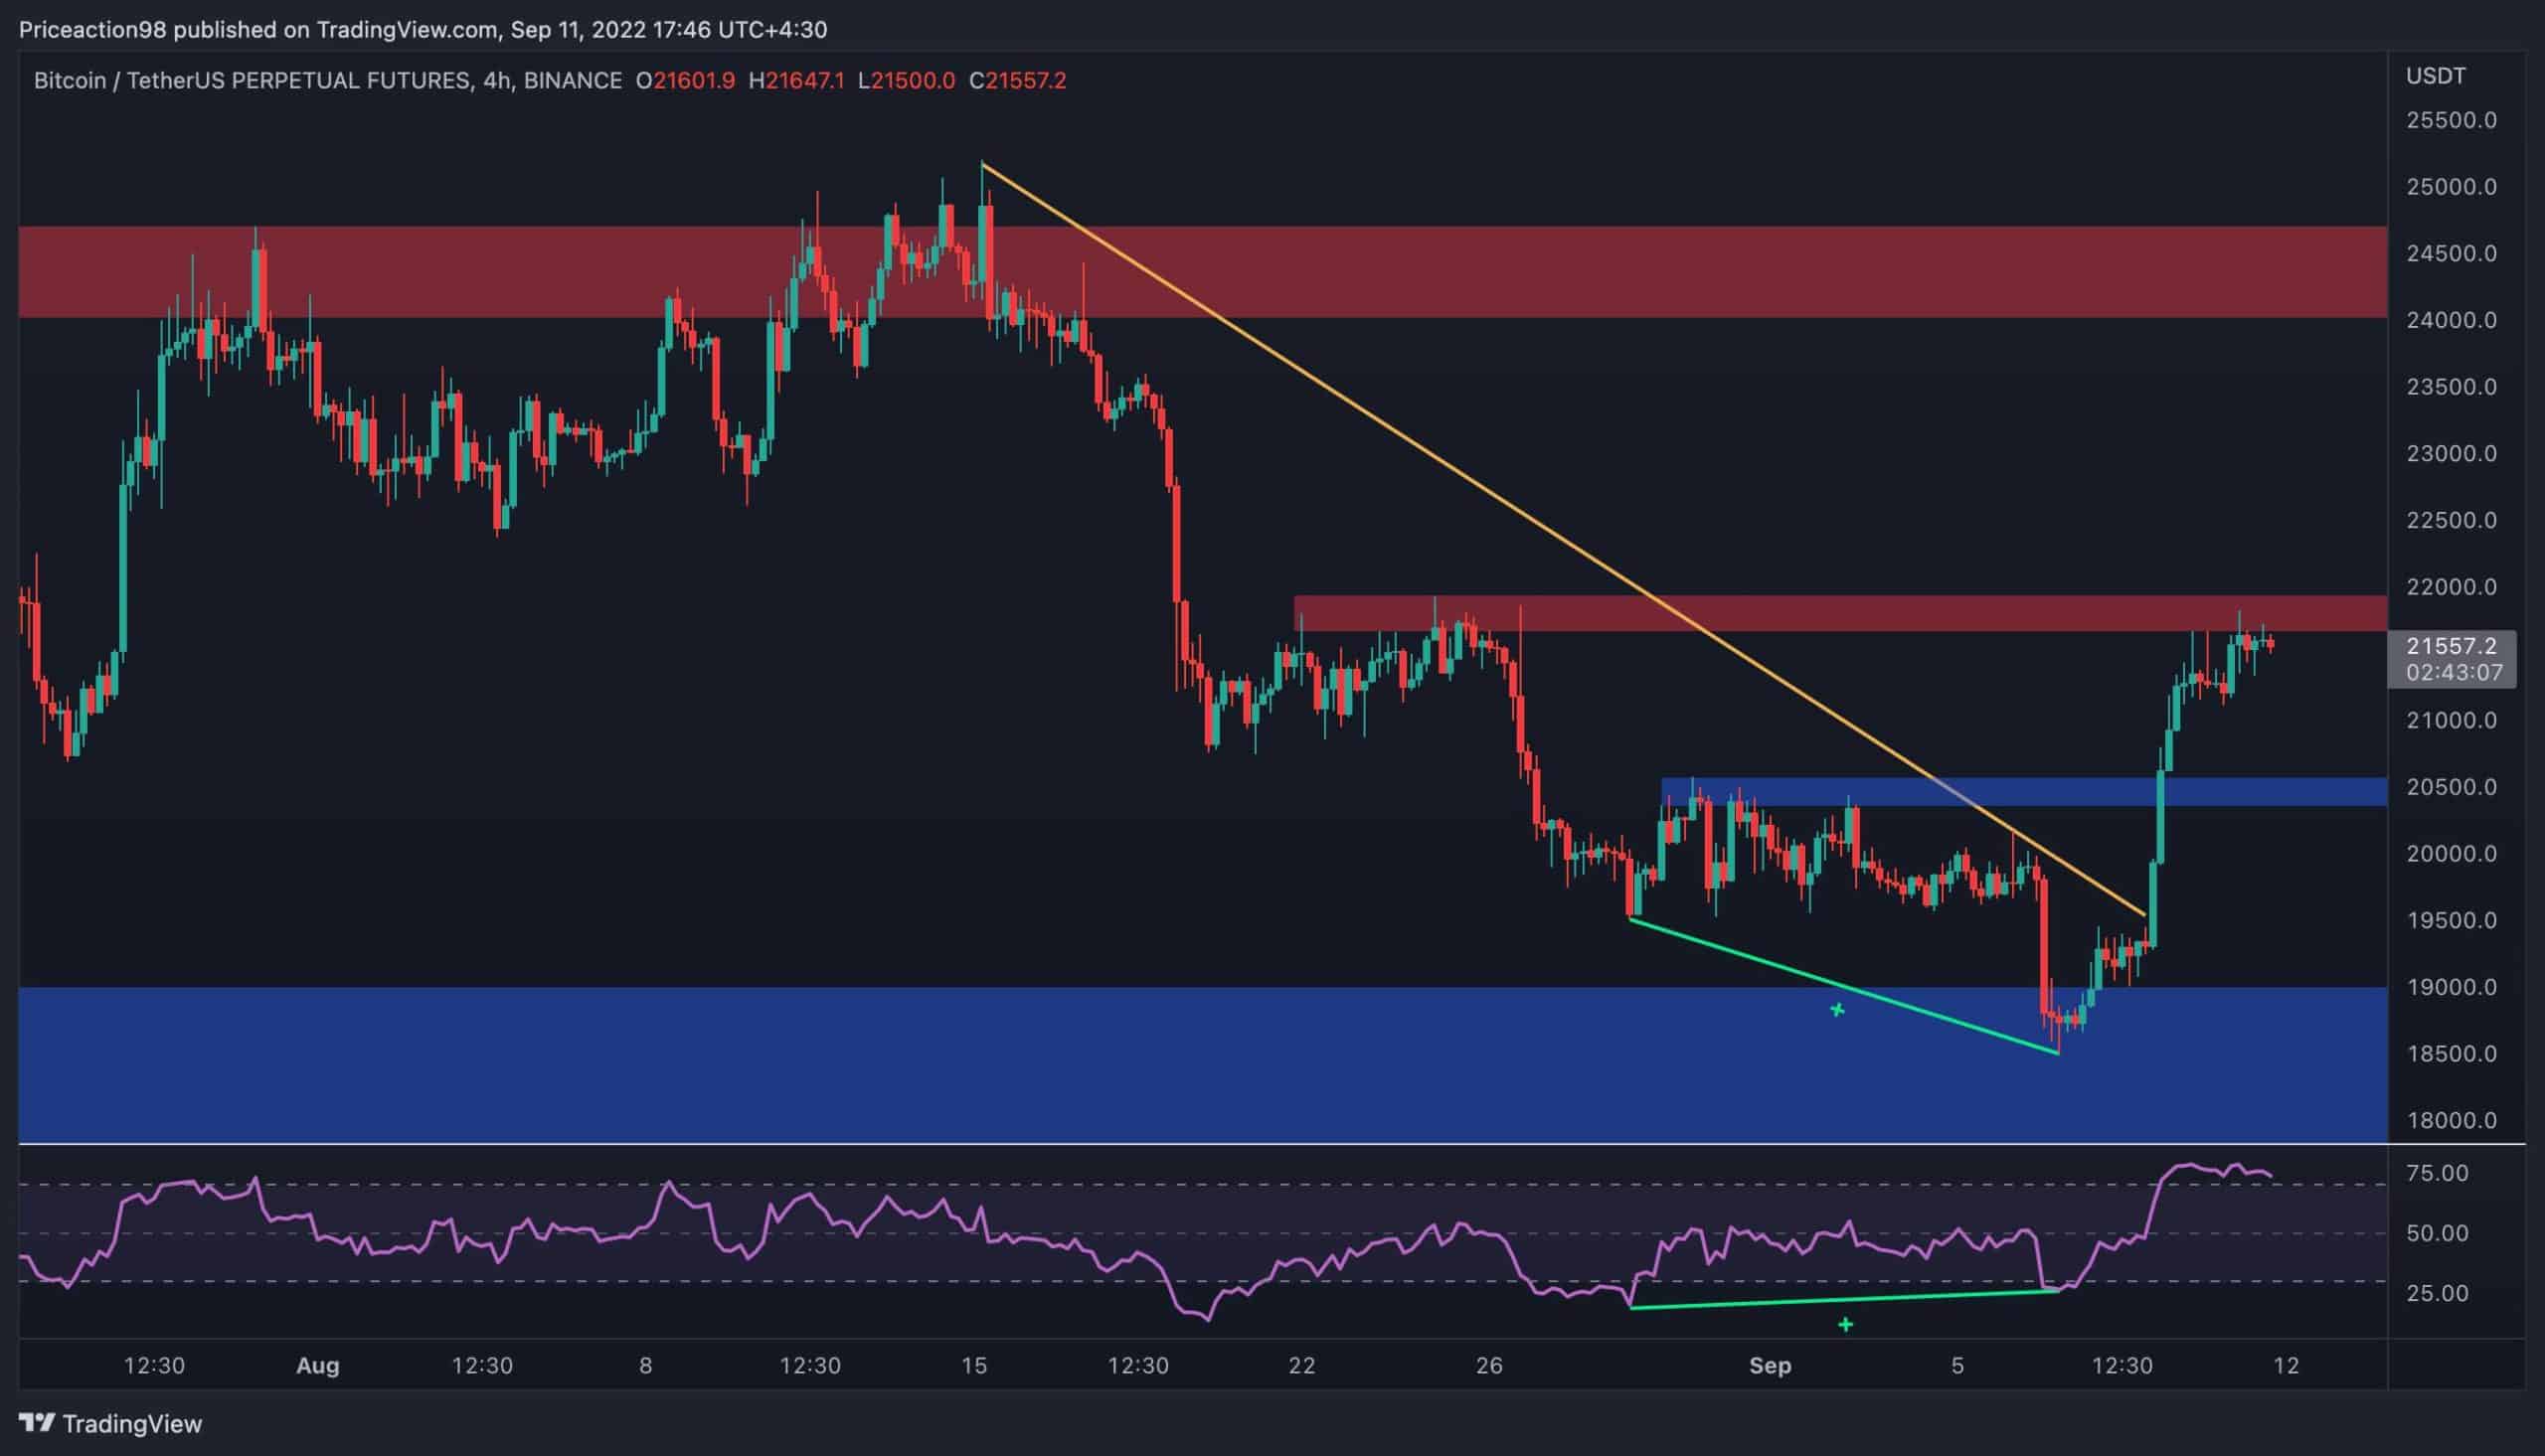
The 4-Hour Chart
On the 4-hour chart, The price has broken above both the bearish trendline and the $20,500 level after rebounding from the $18K area.
Currently, the cryptocurrency is testing the $22K resistance level, and a bullish breakout from this level would pave the way toward $24K. However, the trend seems over-extended. This suggests a bearish pullback toward the $20,500 level – which has now turned into support.
Additionally, the RSI indicator, which had been signaling a massive bullish divergence before the reversal, is now demonstrating a clear overbought signal with values above 70%. This further boosts the probability of a short-term pullback.
Onchain Analysis
By Shayan
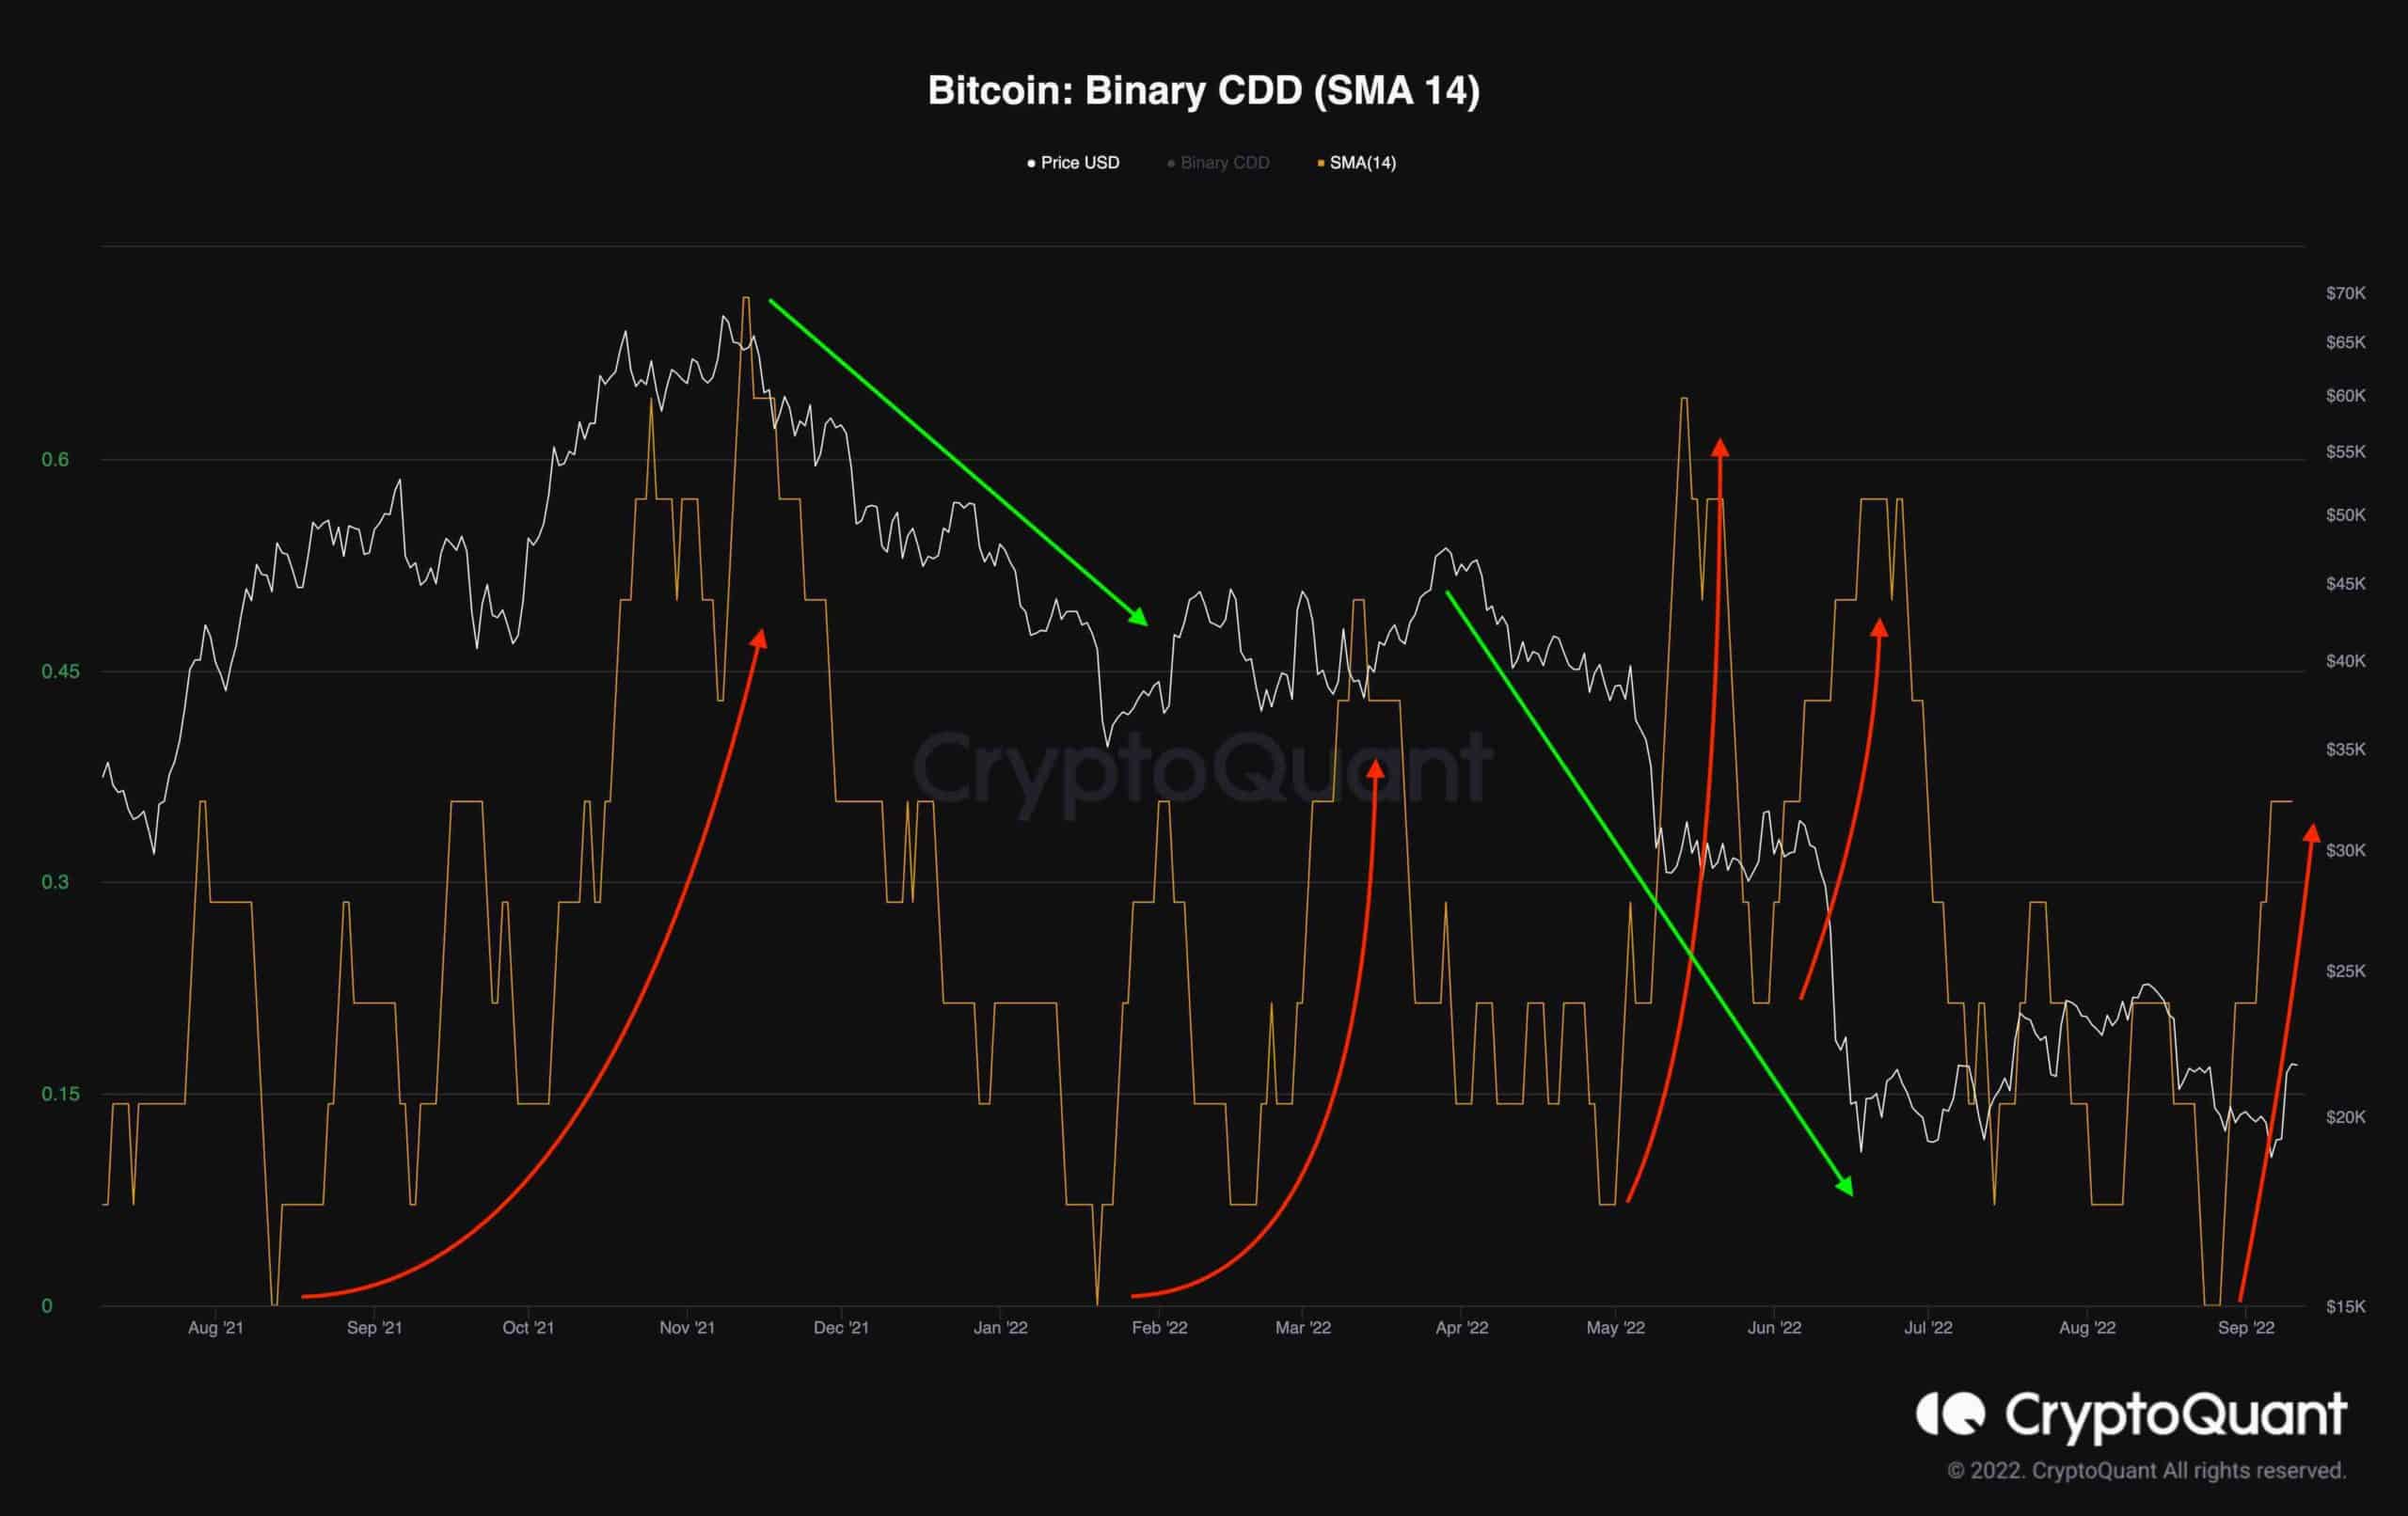
Binary Coin Days Destroyed (CDD) Metric
The long-term holders are a vital cohort among market participants. Hence, tracking their behavior might help in anticipating the market’s direction.
The Binary Coin Days Destroyed metric can be used to identify the long-term holders’ activity. It points to 1 if Supply Adjusted Coin Days Destroyed is larger than the average Supply-Adjusted CDD and points to 0 if not.
The following chart depicts the Binary CDD metric (14-day SMA) and Bitcoin’s price. A spike in the metric indicates potential selling pressure from long-term holders. Each time the metric printed a surge, the price dropped significantly.
Currently, the metric and the price have both experienced a massive rise. Long-term holders might find this rebound an excellent opportunity to distribute their assets and manage their exposure to the market.