Bitcoin’s bearish stage seems far from over as the second rebound from the K support level turned out into another bull trap. The price is currently attempting to break a critical support level. Technical Analysis By Shayan The Daily Chart The cryptocurrency recovered from the K level earlier in September after failing to surpass the K mark. Yet, the 50-day and 100-day moving averages, seen at roughly K, rejected the price to the downside. Bitcoin has also failed to break above the significant bearish trendline, where it has been held below since the current bear market started. Although the K level remains intact, the market structure remains bearish until the price successfully breaks above the mentioned descending trendline and reaches the K
Topics:
CryptoVizArt considers the following as important: Bitcoin (BTC) Price, BTC Analysis, BTCEUR, BTCGBP, btcusd, btcusdt
This could be interesting, too:
Chayanika Deka writes XRP, SOL, and ADA Inclusion in US Crypto Reserve Pushes Traders on Edge
Chayanika Deka writes Why Arthur Hayes Is Bullish on Bitcoin Under Trump’s Economic Strategy
Mandy Williams writes Why the Bitcoin Market Is Stuck—and the Key Metric That Could Change It: CryptoQuant CEO
Wayne Jones writes Metaplanet Acquires 156 BTC, Bringing Total Holdings to 2,391
Bitcoin’s bearish stage seems far from over as the second rebound from the $18K support level turned out into another bull trap. The price is currently attempting to break a critical support level.
Technical Analysis
By Shayan
The Daily Chart
The cryptocurrency recovered from the $18K level earlier in September after failing to surpass the $24K mark. Yet, the 50-day and 100-day moving averages, seen at roughly $22K, rejected the price to the downside. Bitcoin has also failed to break above the significant bearish trendline, where it has been held below since the current bear market started.
Although the $18K level remains intact, the market structure remains bearish until the price successfully breaks above the mentioned descending trendline and reaches the $24K resistance.
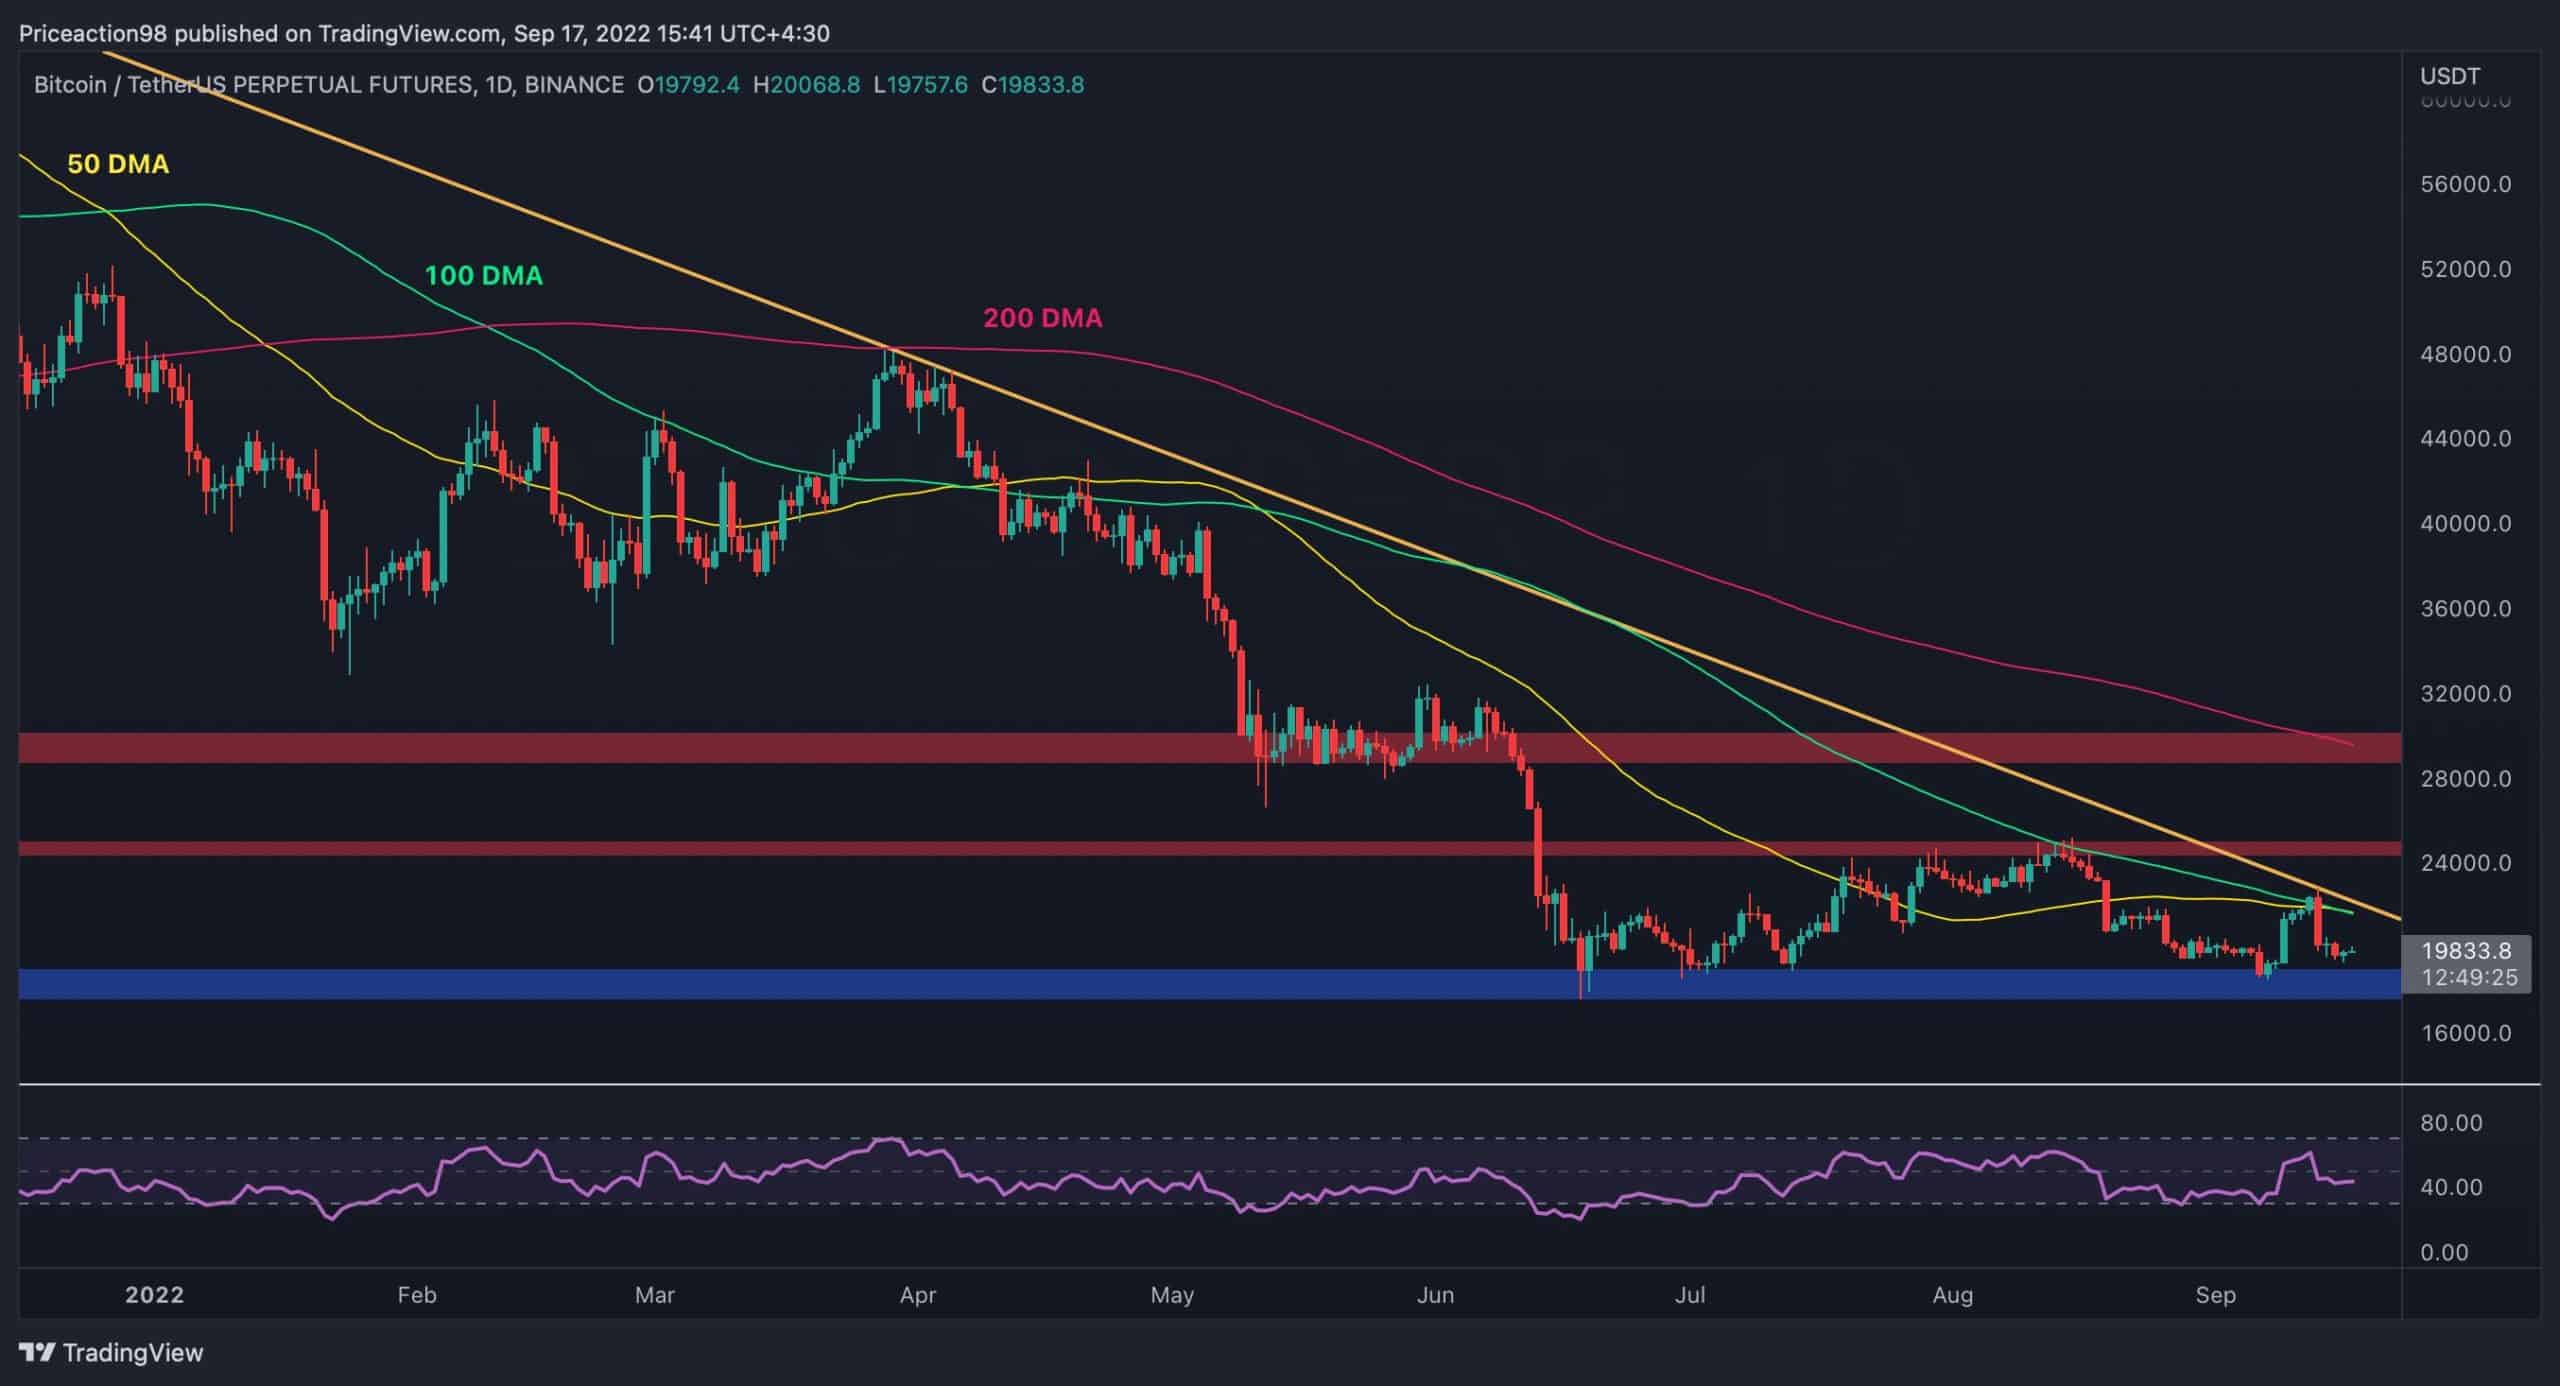
Furthermore, a breakdown of the $18K level could initiate a bloodbath as the market could crash to $15K and even deeper in the short term.
The 4-Hour Chart
On the 4-hour chart, it is clear that after the price broke above the $20K level following the strong rebound off the $18K support, it was rejected from $22.5K and has quickly returned to the $19K region, which is currently serving as major support.
The Fibonacci retracement tool also places the price in an important area between 0.618 and 0.5, called the Fibonacci golden zone. Hence, if the level holds, another rally towards the $22,500 level and eventually the $24K level would be conceivable.
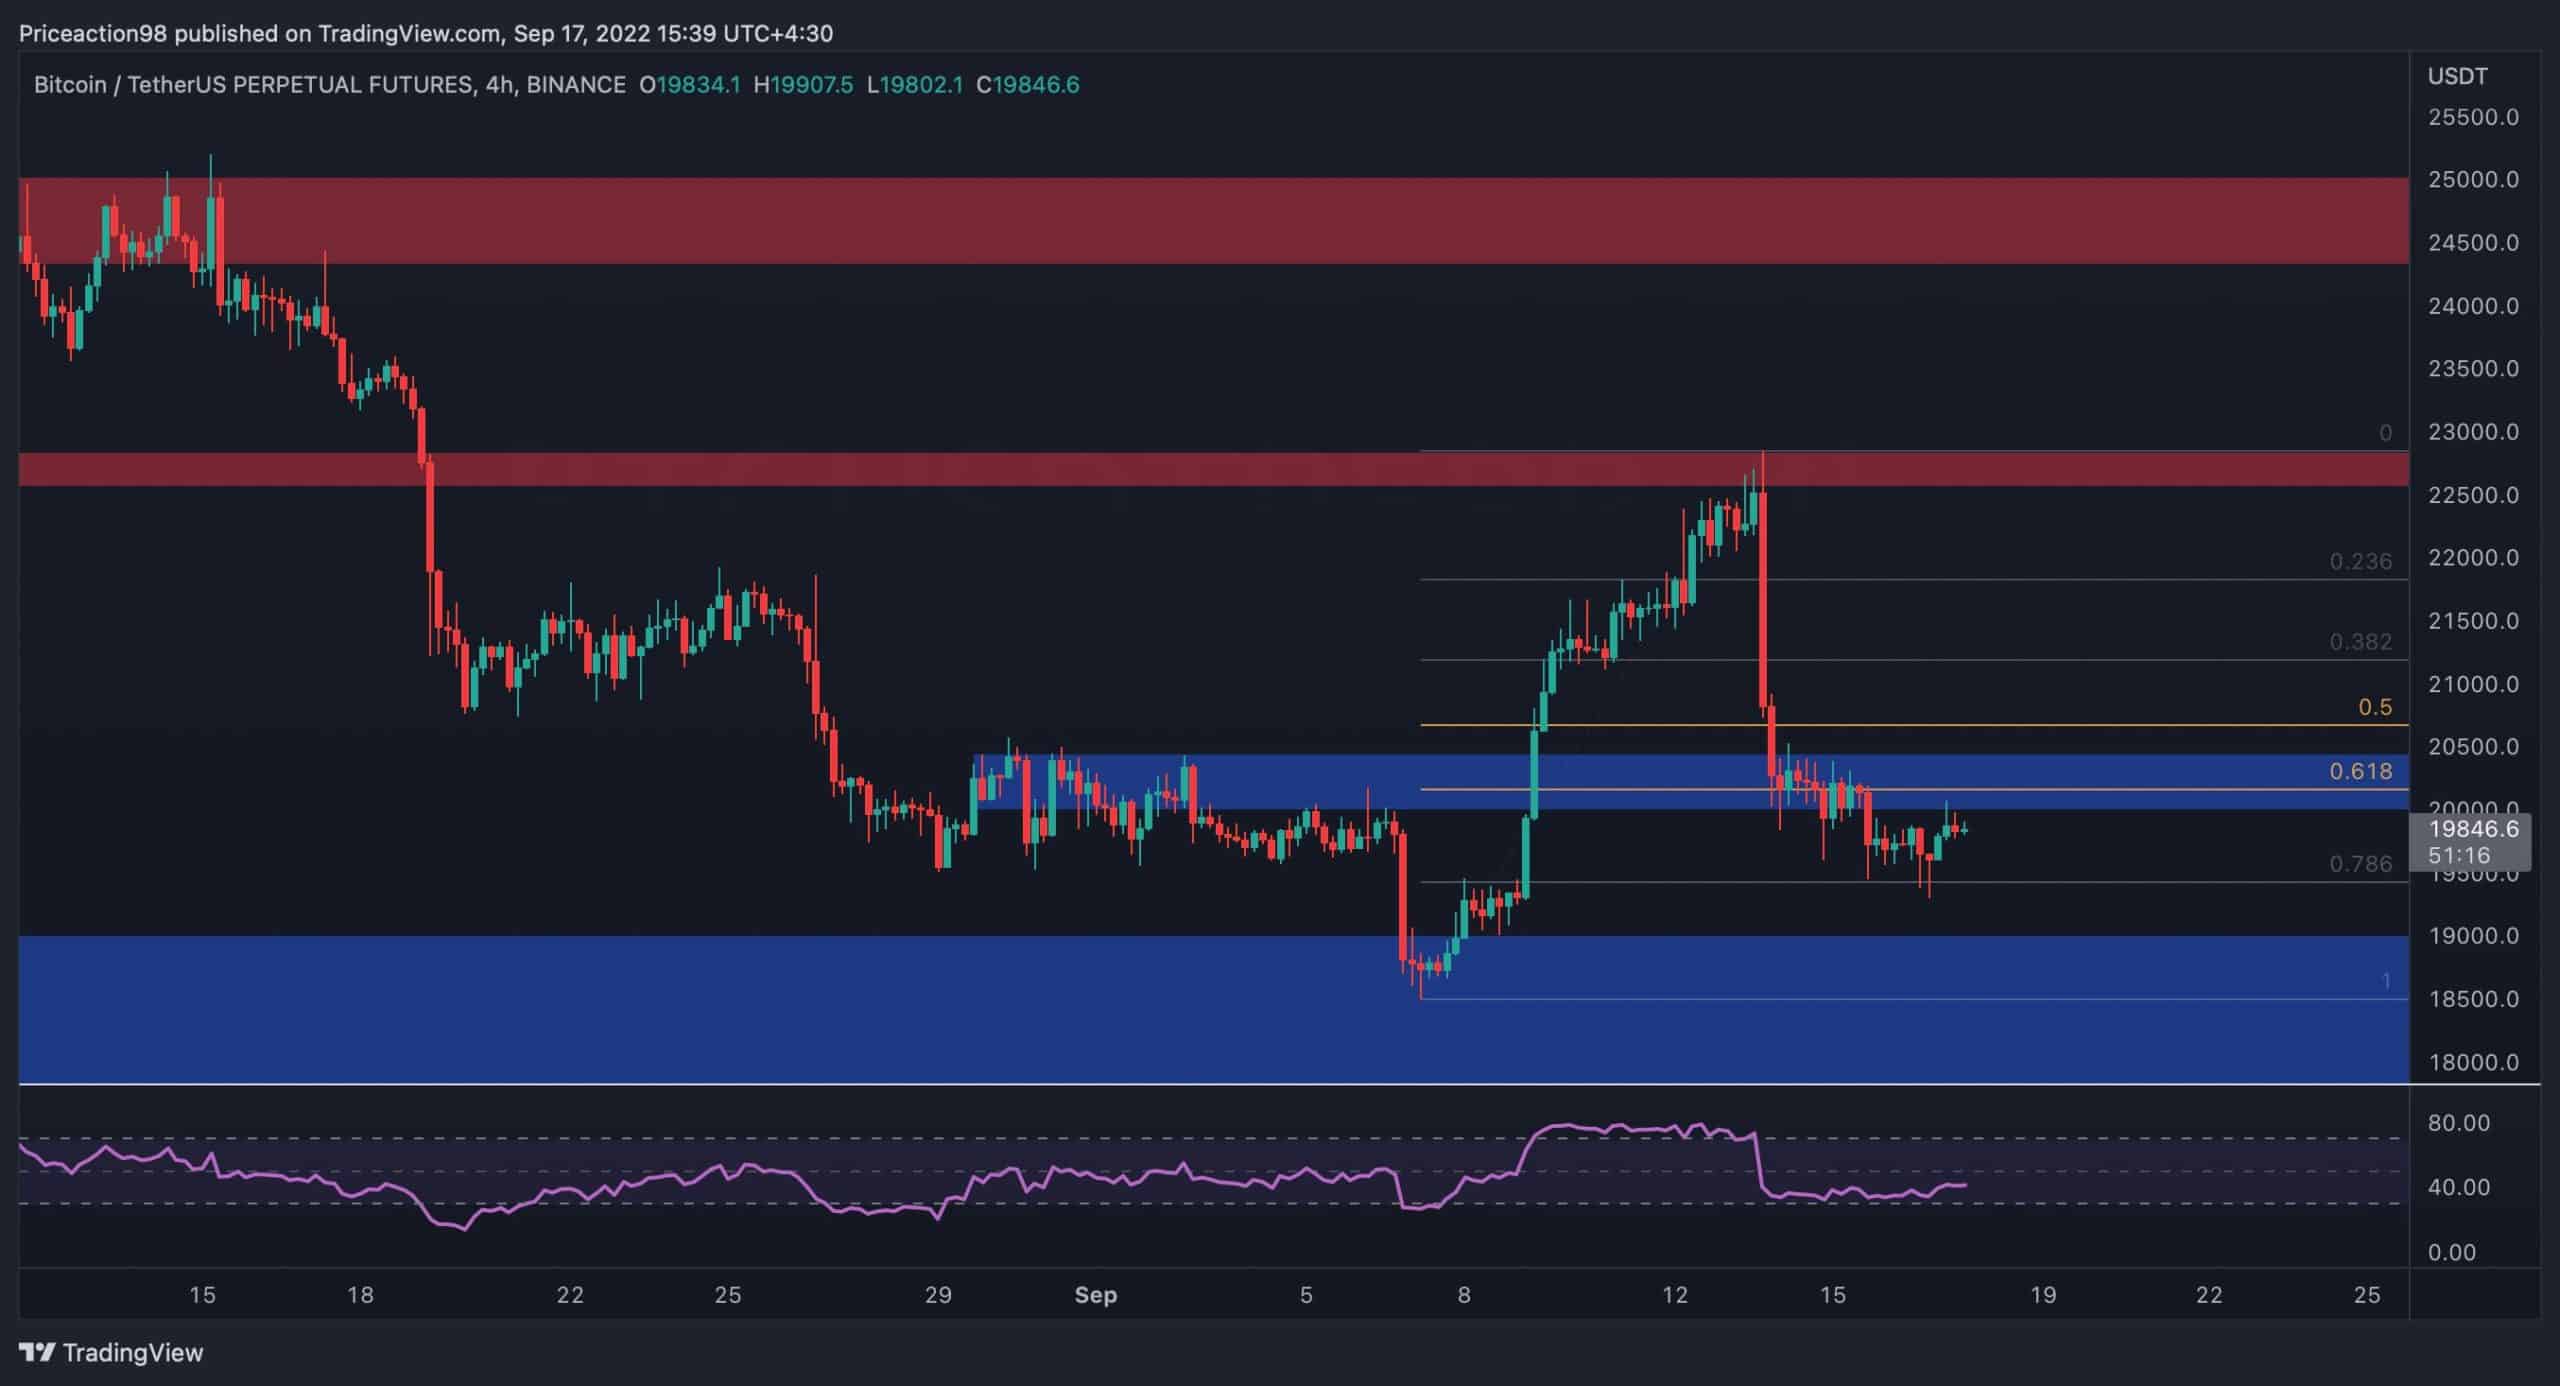
However, according to the RSI indicator, the more likely scenario is still a breakdown and bearish continuation in the short-term, as the momentum is in favor of the bears.
Onchain Analysis
By Shayan
Exchange Whale Ratio Metric
The whales are an important cohort among market participants. Hence, tracking their behavior might help in anticipating the trend. The Exchange Whale Ratio metric can be used to identify their activity by comparing the ratio of deposits by whales to the whole amount of deposits in a day.
According to the chart, it is apparent that the whales managed to distribute their coins during the first stages of a bear market and accumulate at lower prices.
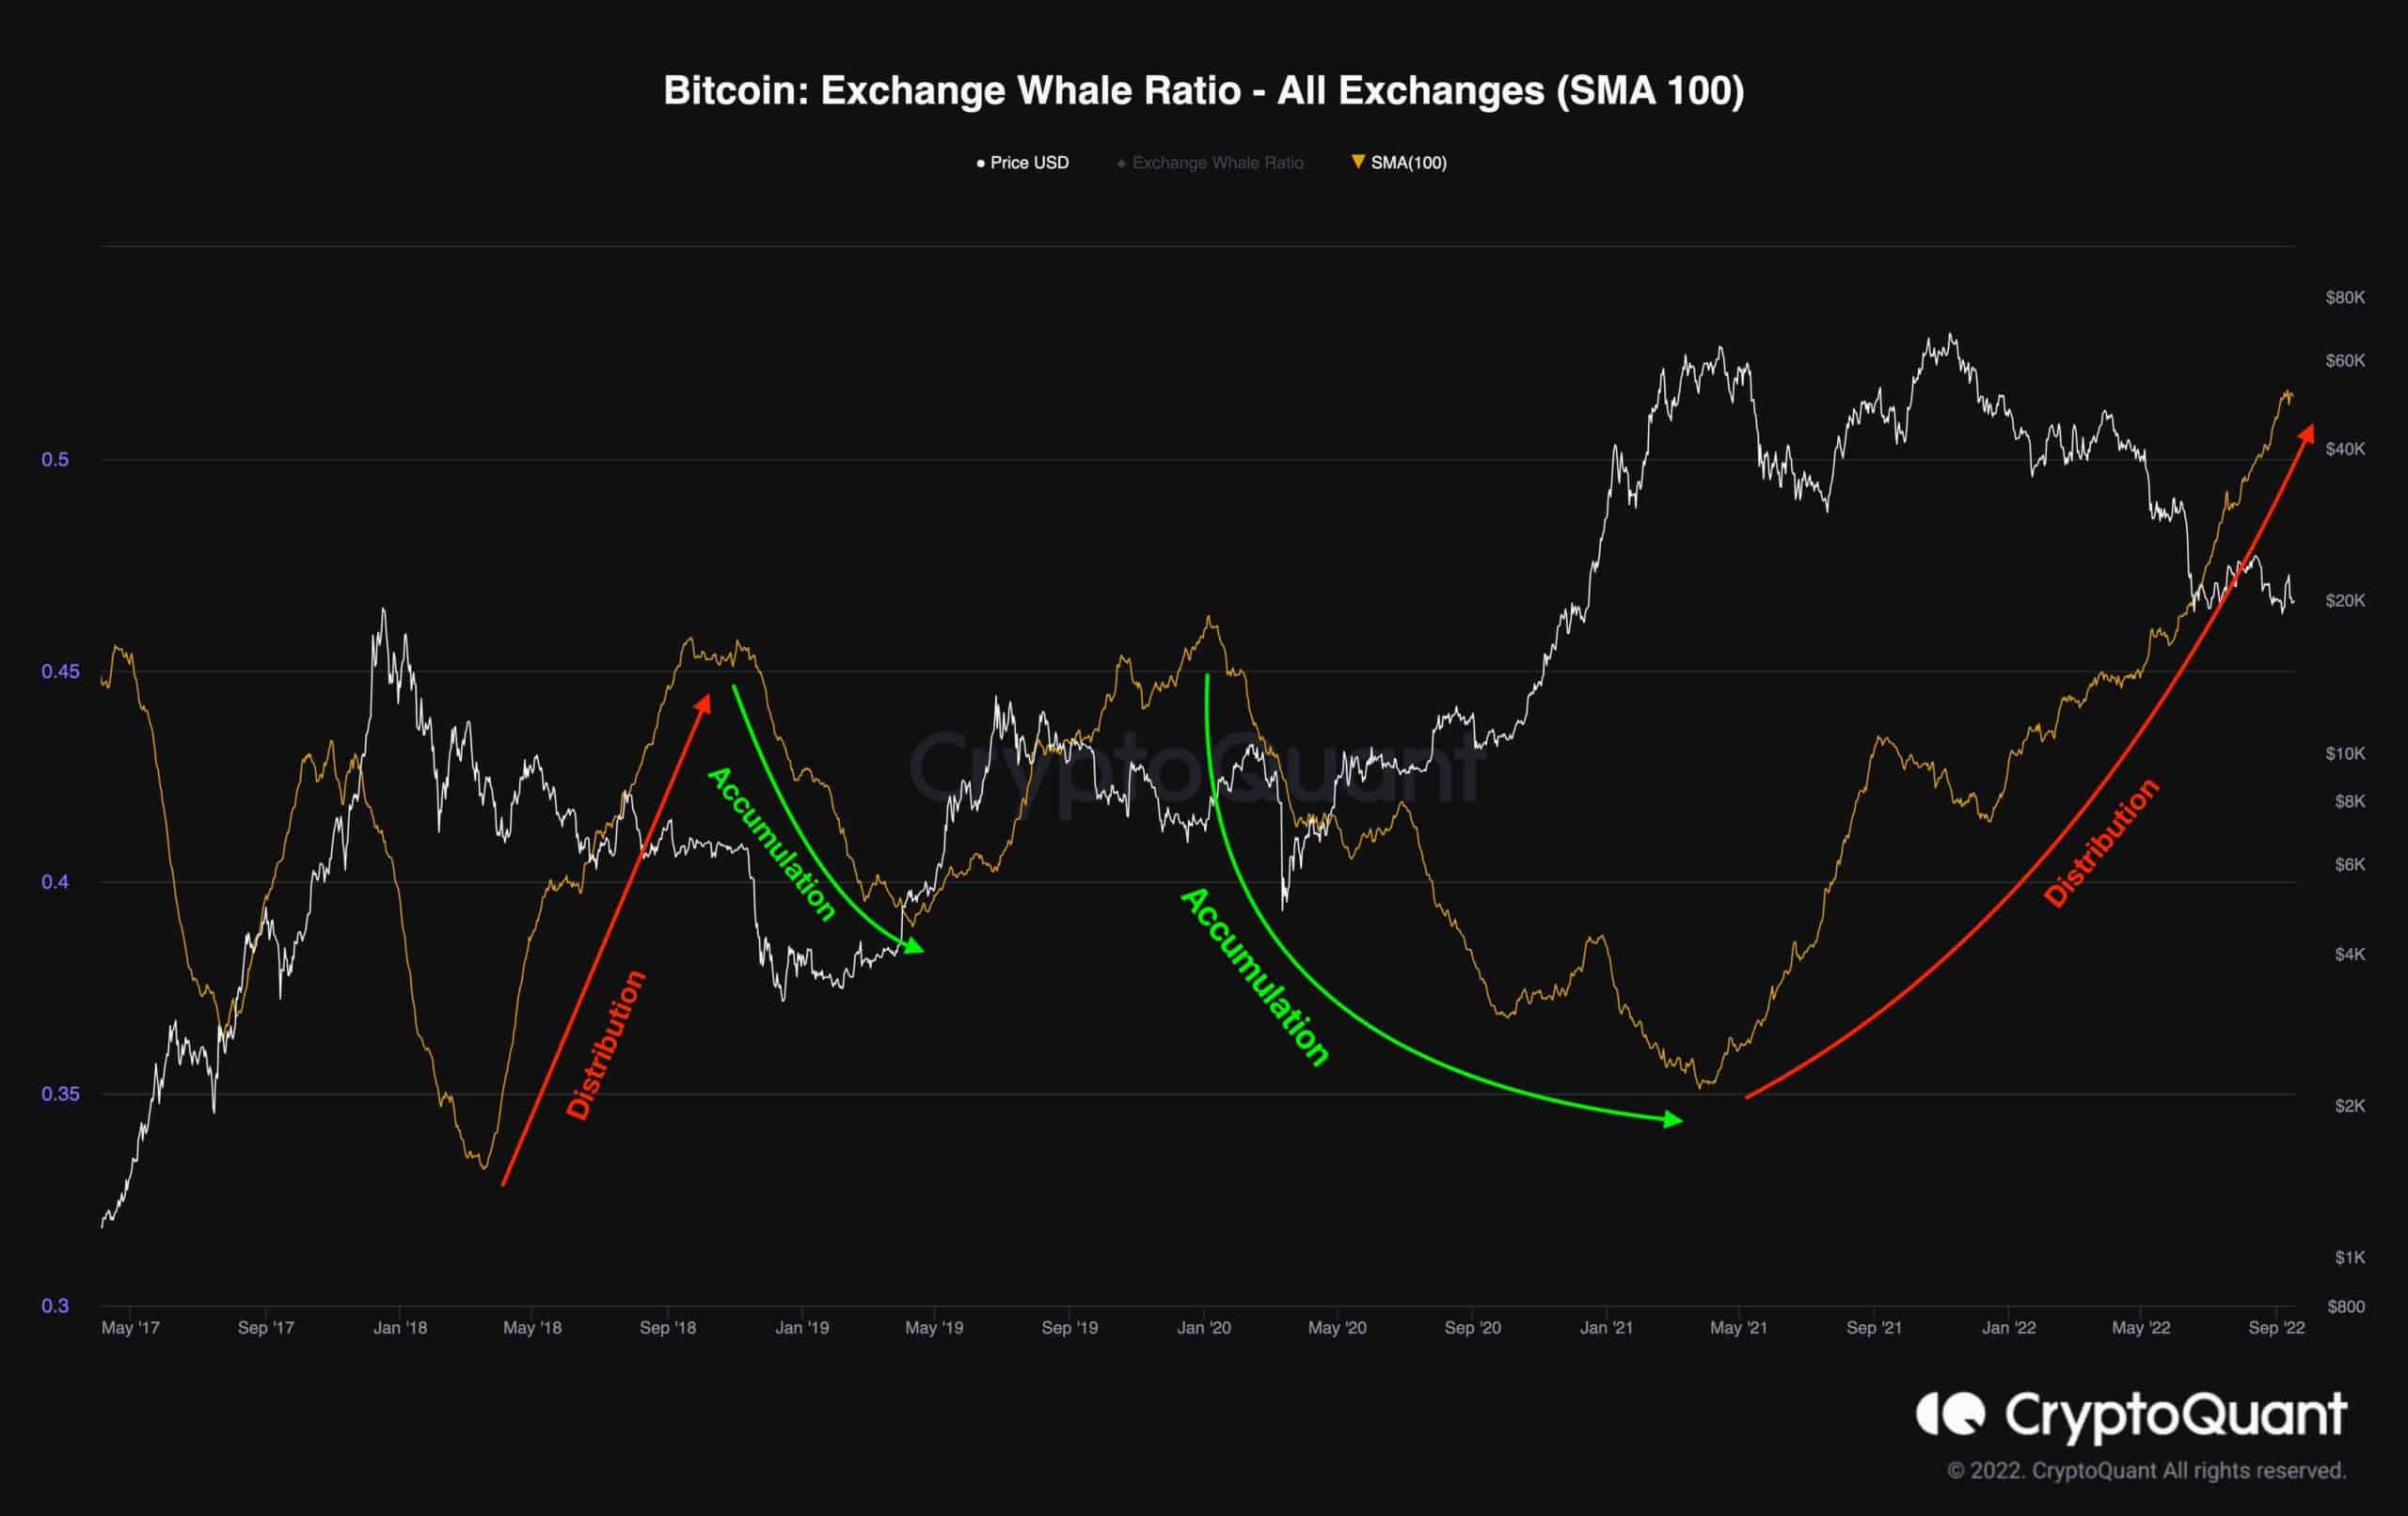
Currently, the metric is still in an upward rally, indicating distribution. Overall, the market appears far from bottoming out, and a final capitulation event might occur.