Aside from the weekly candle, which ended in the red, Bitcoin made no substantial move and still hovering around the K range. Technical Analysis By Grizzly The Daily Chart On the daily chart, Bitcoin is currently trading on top of the support zone between K to .5K (in yellow). Following June’s market crash, this support managed to prevent further decline. This was the second successful retest of this level. If BTC closes a candle below K, combined with increased selling pressure as a result of triggering stop losses, the asset will likely slip towards .2K, creating a new yearly low, whereas the next level lies at k (in green). Alternately, in order for Bitcoin to get back onto the bullish track, it must overcome the descending line resistance (in white).
Topics:
CryptoVizArt considers the following as important: Bitcoin (BTC) Price, BTC Analysis, btcusd, btcusdt
This could be interesting, too:
Chayanika Deka writes XRP, SOL, and ADA Inclusion in US Crypto Reserve Pushes Traders on Edge
Chayanika Deka writes Why Arthur Hayes Is Bullish on Bitcoin Under Trump’s Economic Strategy
Mandy Williams writes Why the Bitcoin Market Is Stuck—and the Key Metric That Could Change It: CryptoQuant CEO
Wayne Jones writes Metaplanet Acquires 156 BTC, Bringing Total Holdings to 2,391
Aside from the weekly candle, which ended in the red, Bitcoin made no substantial move and still hovering around the $19K range.
Technical Analysis
By Grizzly
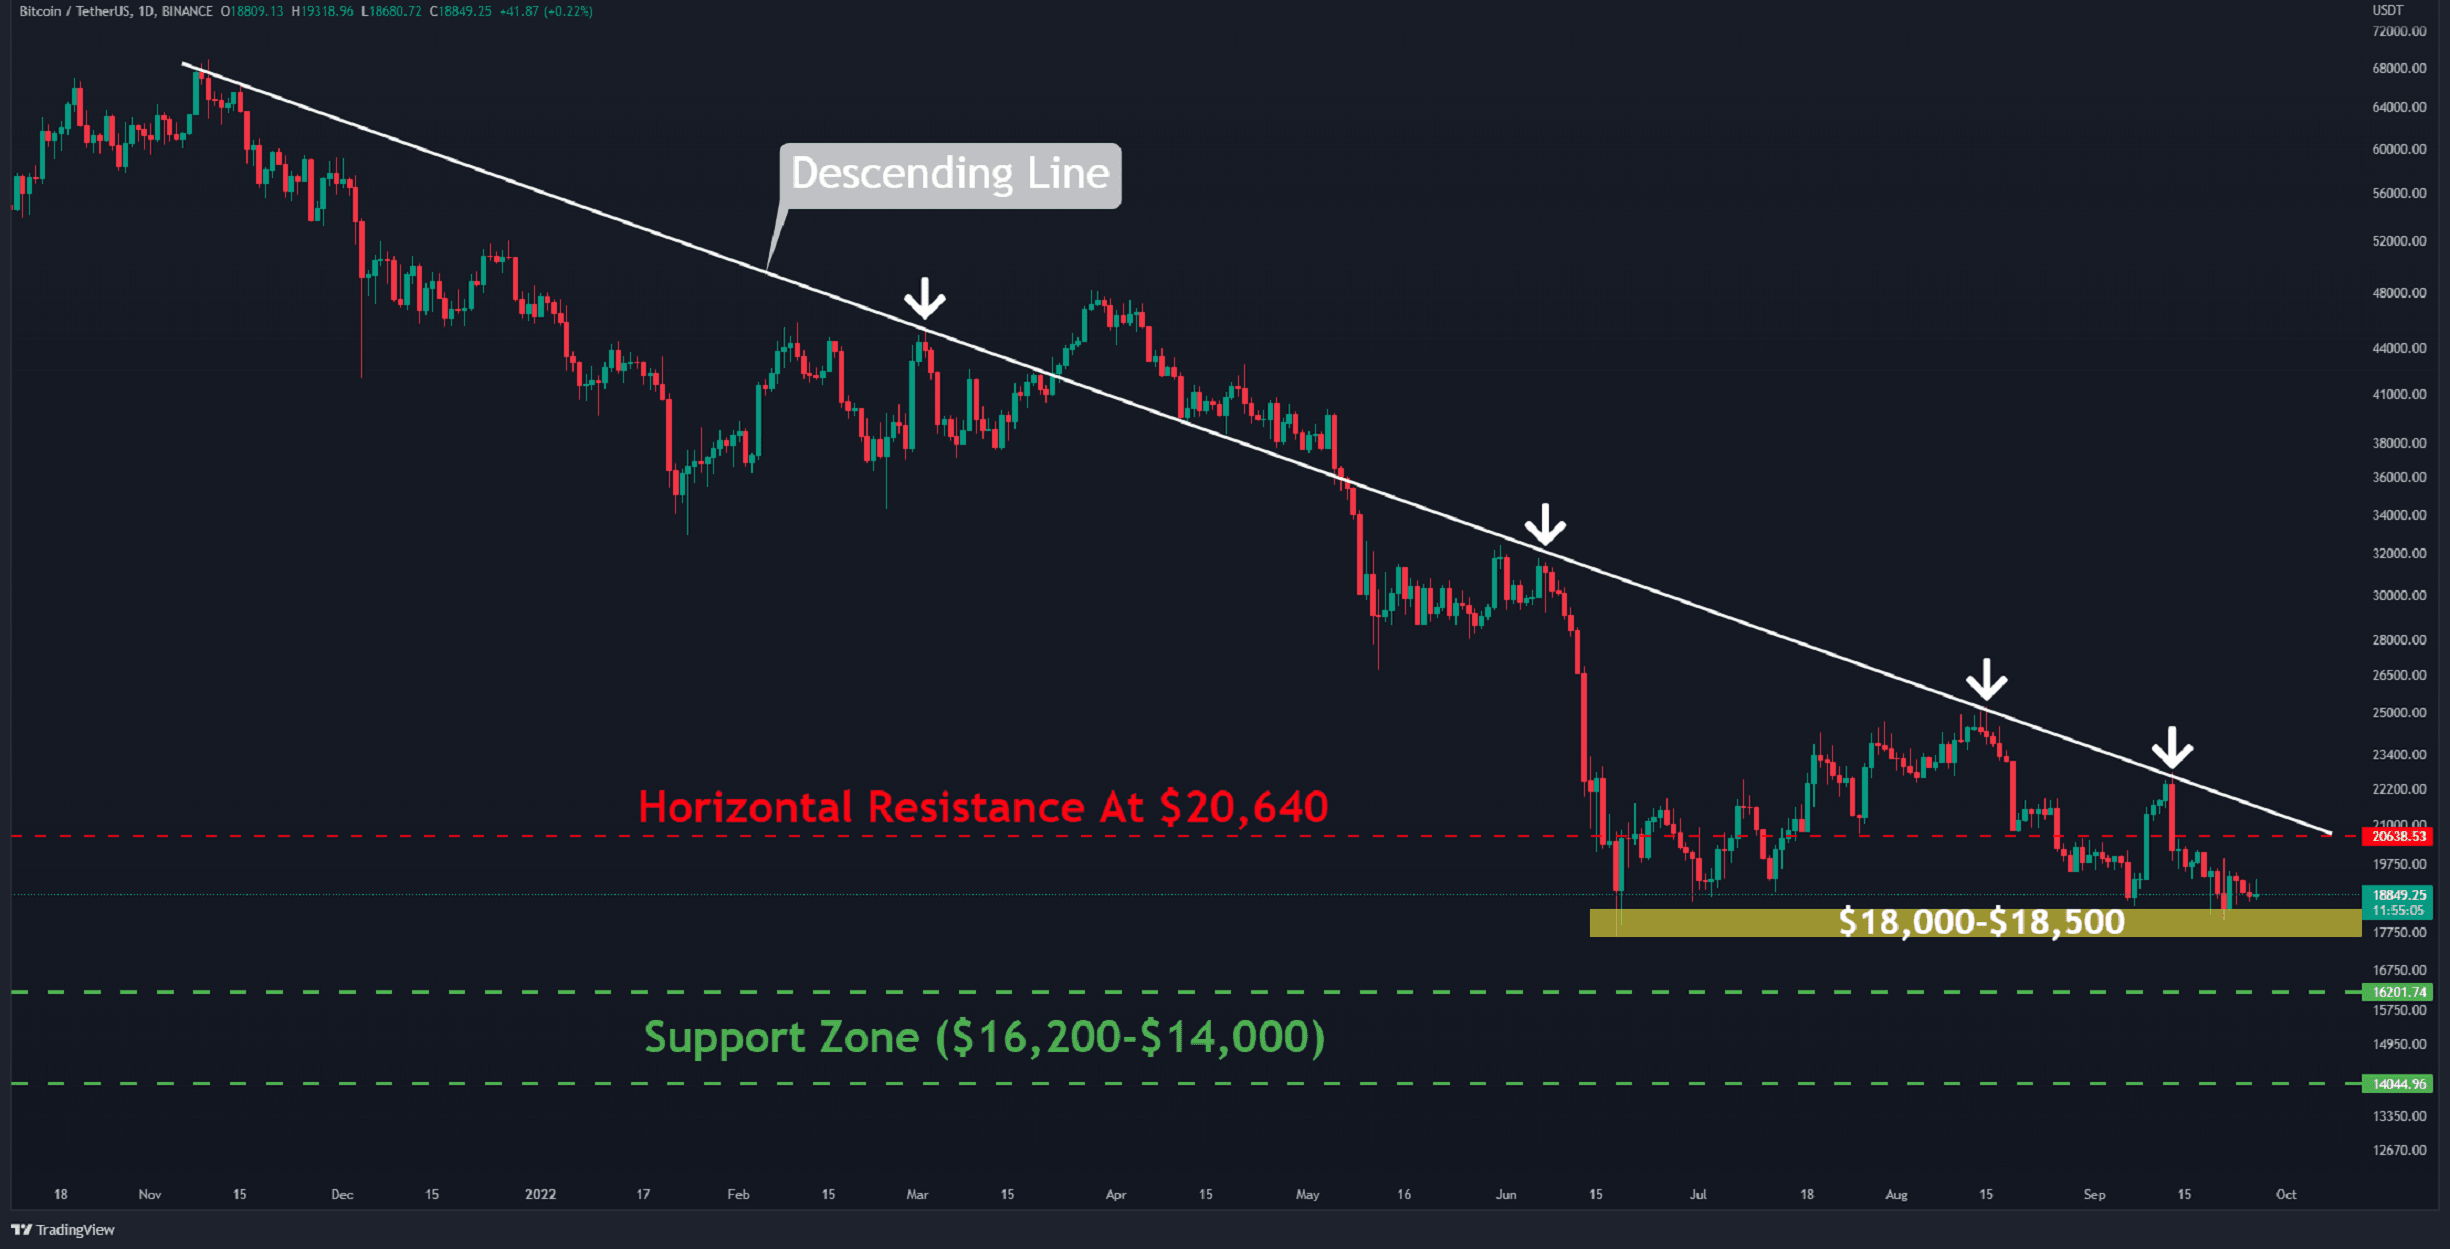
The Daily Chart
On the daily chart, Bitcoin is currently trading on top of the support zone between $18K to $18.5K (in yellow). Following June’s market crash, this support managed to prevent further decline. This was the second successful retest of this level.
If BTC closes a candle below $18K, combined with increased selling pressure as a result of triggering stop losses, the asset will likely slip towards $16.2K, creating a new yearly low, whereas the next level lies at $14k (in green).
Alternately, in order for Bitcoin to get back onto the bullish track, it must overcome the descending line resistance (in white). The price has repeatedly pushed against this barrier since the all-time high was recorded.
This also merges with the horizontal resistance at $20.6K. In case of a bullish breakout, the next target is likely at $22.7K.
Key Support Levels: $18K & $16.2K
Key Resistance Levels: $20.6K & $22.7K
Daily Moving Averages:
MA20: $19884
MA50: $20960
MA100: $21244
MA200: $28638
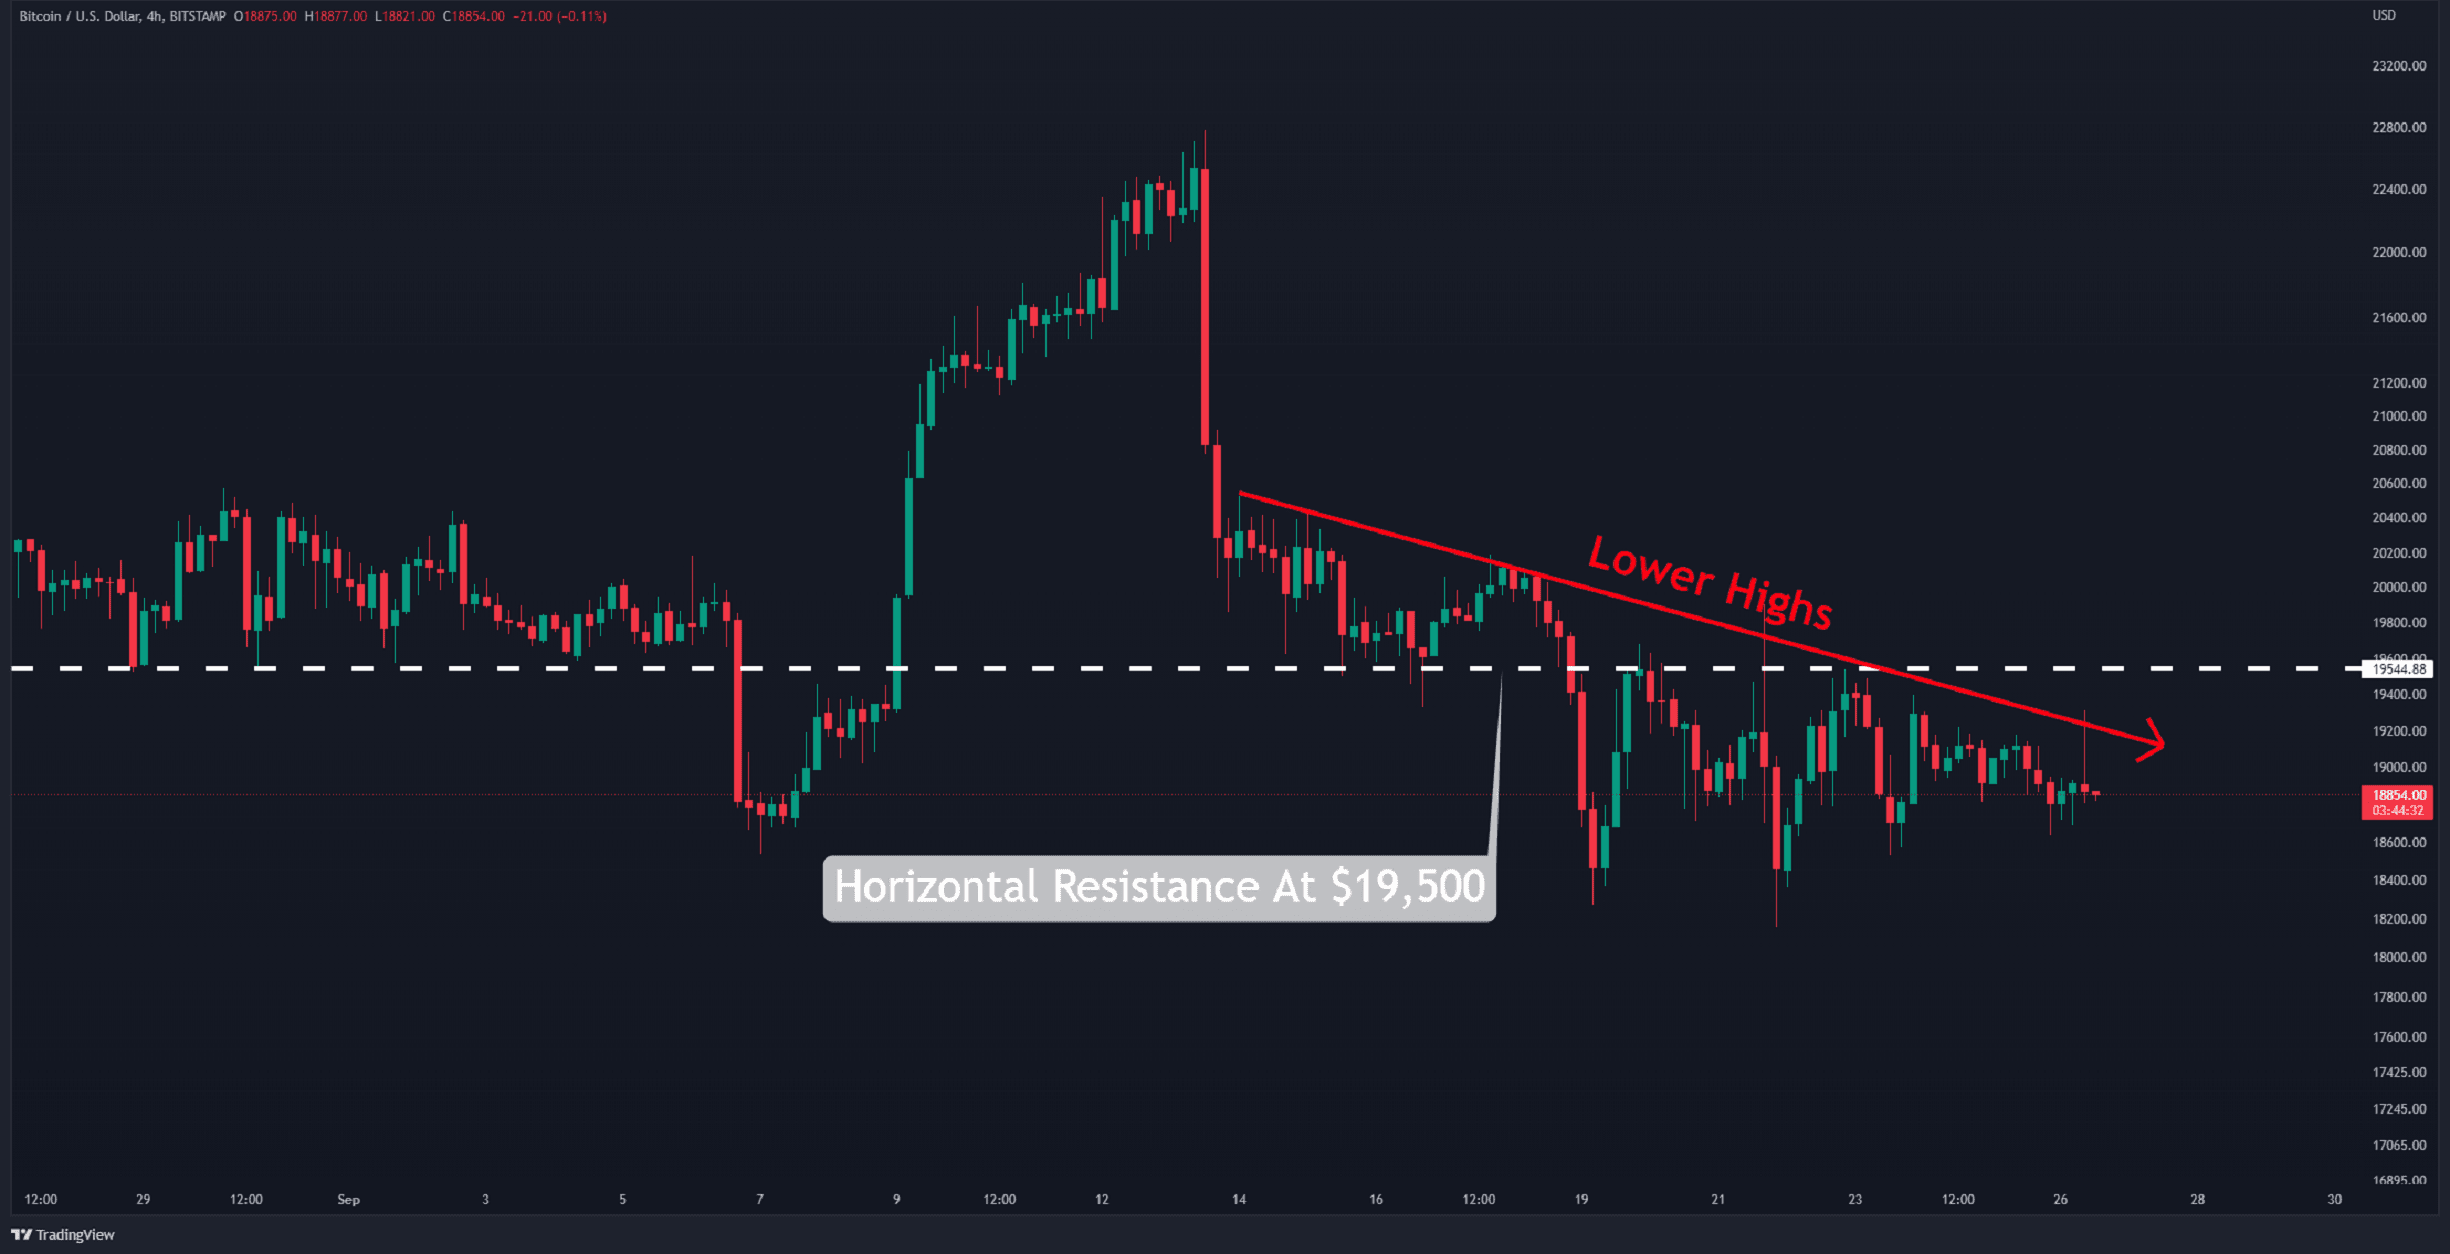
The 4-Hour Chart
Lower highs were formed due to the current downward trend of Bitcoin’s price (in red). The high selling pressure in the market is evident in this chart, whereas BTC could not close a candle above $19.5K last week.
Pushing the price beyond the resistance line is needed for the positive trend to continue. If $19.5K gets breached, the next resistance lies at $20.4K.
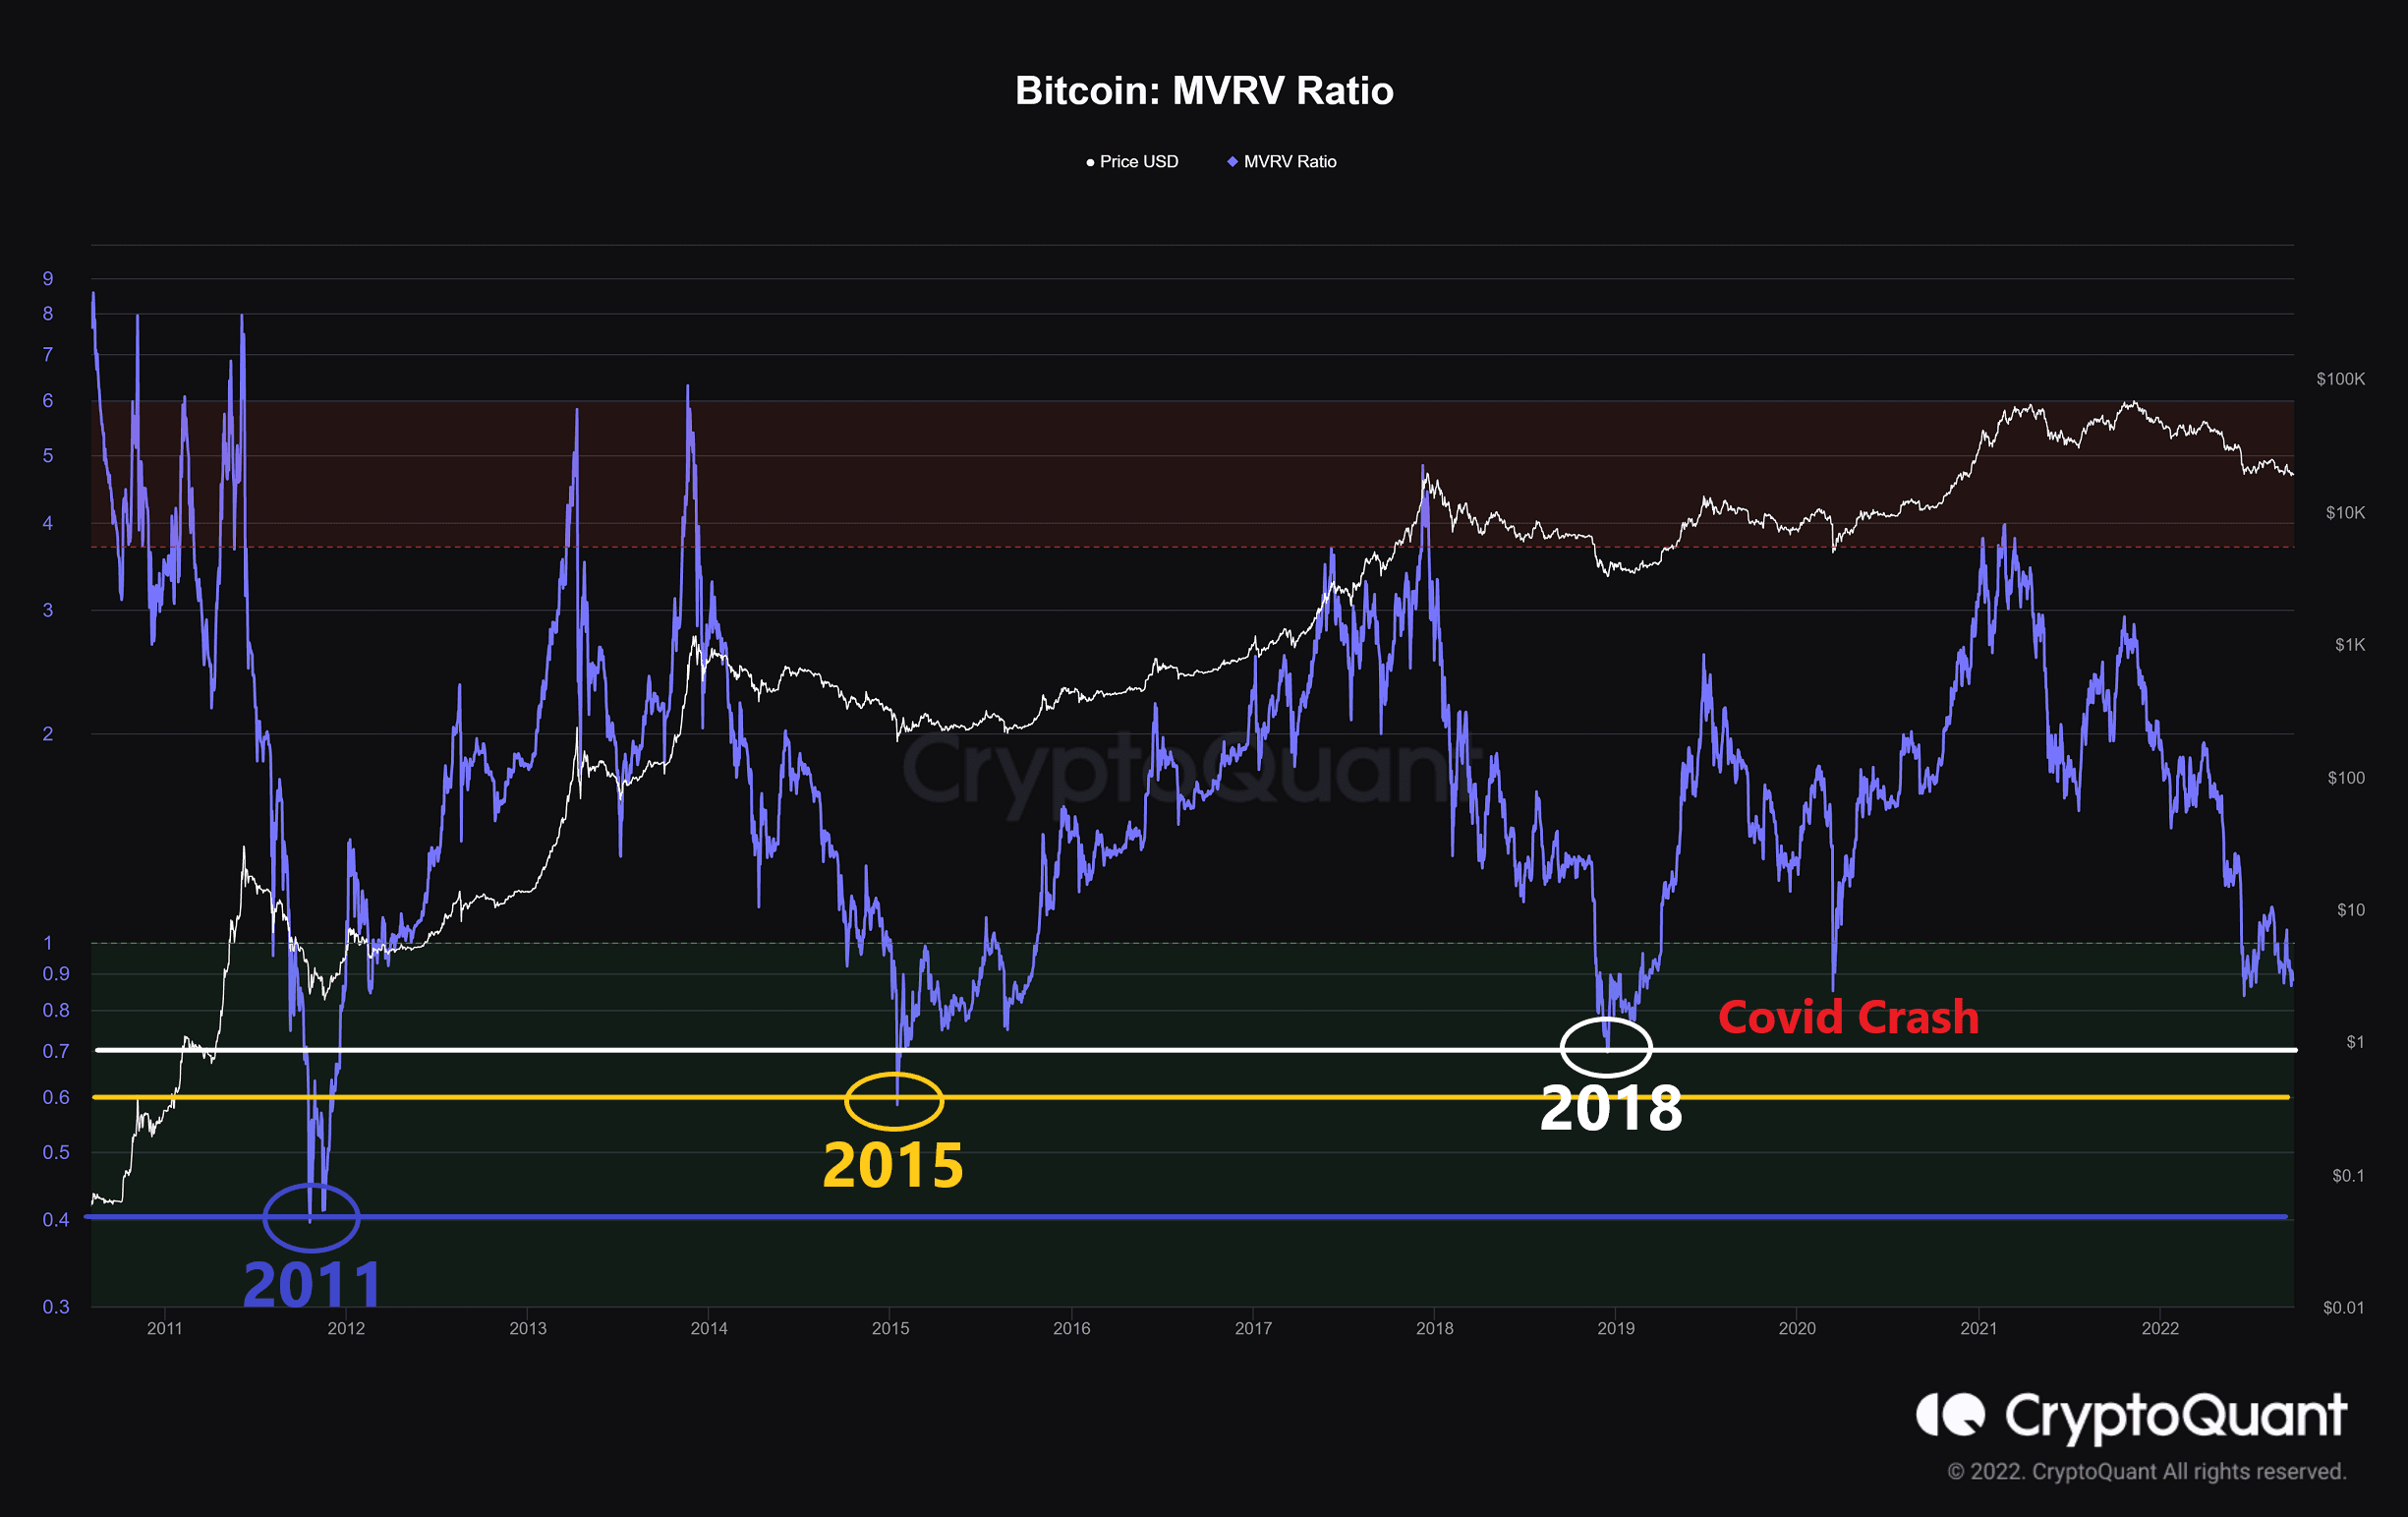
On-chain Analysis: MVRV Ratio
Definition: The ratio of coins, Market Cap to Realized Cap, which indicates whether the price is overvalued or undervalued.
Historically, Values over 3.7 indicated a top price, while values below ‘1’ indicated a bottom price. Although both long-term and short-term holders have been losing money, this bottom hasn’t been as negative as others.
The below chart shows how low the index historically reached. This index is currently at levels that it touched prior to the COVID-19 crash (March 2020). When MVRV gains momentum above 1 and climbs to higher levels, a bullish rally is anticipated.