Bitcoin’s relief rally from the K area seems to be coming to an end, as the K resistance level is rejecting the price once again. The 100-day moving average also acts as a resistance near the same level. Technical Analysis By Edris The Daily Chart: The 50-day moving average, which is currently located around the K level, could provide some support and initiate a rally above the K resistance level. In this case, a rapid rise towards the K supply zone would be more likely. Source: TradingViewHowever, a bullish breakout above the 200-day moving average, which is currently trending around K, would be necessary to call the beginning of a new bull market. On the other hand, if the 50-day moving average fails to hold the price, a retest of the K-K support
Topics:
CryptoVizArt considers the following as important: Bitcoin (BTC) Price, BTC Analysis, BTCEUR, BTCGBP, btcusd, btcusdt
This could be interesting, too:
Chayanika Deka writes XRP, SOL, and ADA Inclusion in US Crypto Reserve Pushes Traders on Edge
Chayanika Deka writes Why Arthur Hayes Is Bullish on Bitcoin Under Trump’s Economic Strategy
Mandy Williams writes Why the Bitcoin Market Is Stuck—and the Key Metric That Could Change It: CryptoQuant CEO
Wayne Jones writes Metaplanet Acquires 156 BTC, Bringing Total Holdings to 2,391
Bitcoin’s relief rally from the $20K area seems to be coming to an end, as the $24K resistance level is rejecting the price once again. The 100-day moving average also acts as a resistance near the same level.
Technical Analysis
By Edris
The Daily Chart:
The 50-day moving average, which is currently located around the $22K level, could provide some support and initiate a rally above the $24K resistance level. In this case, a rapid rise towards the $30K supply zone would be more likely.
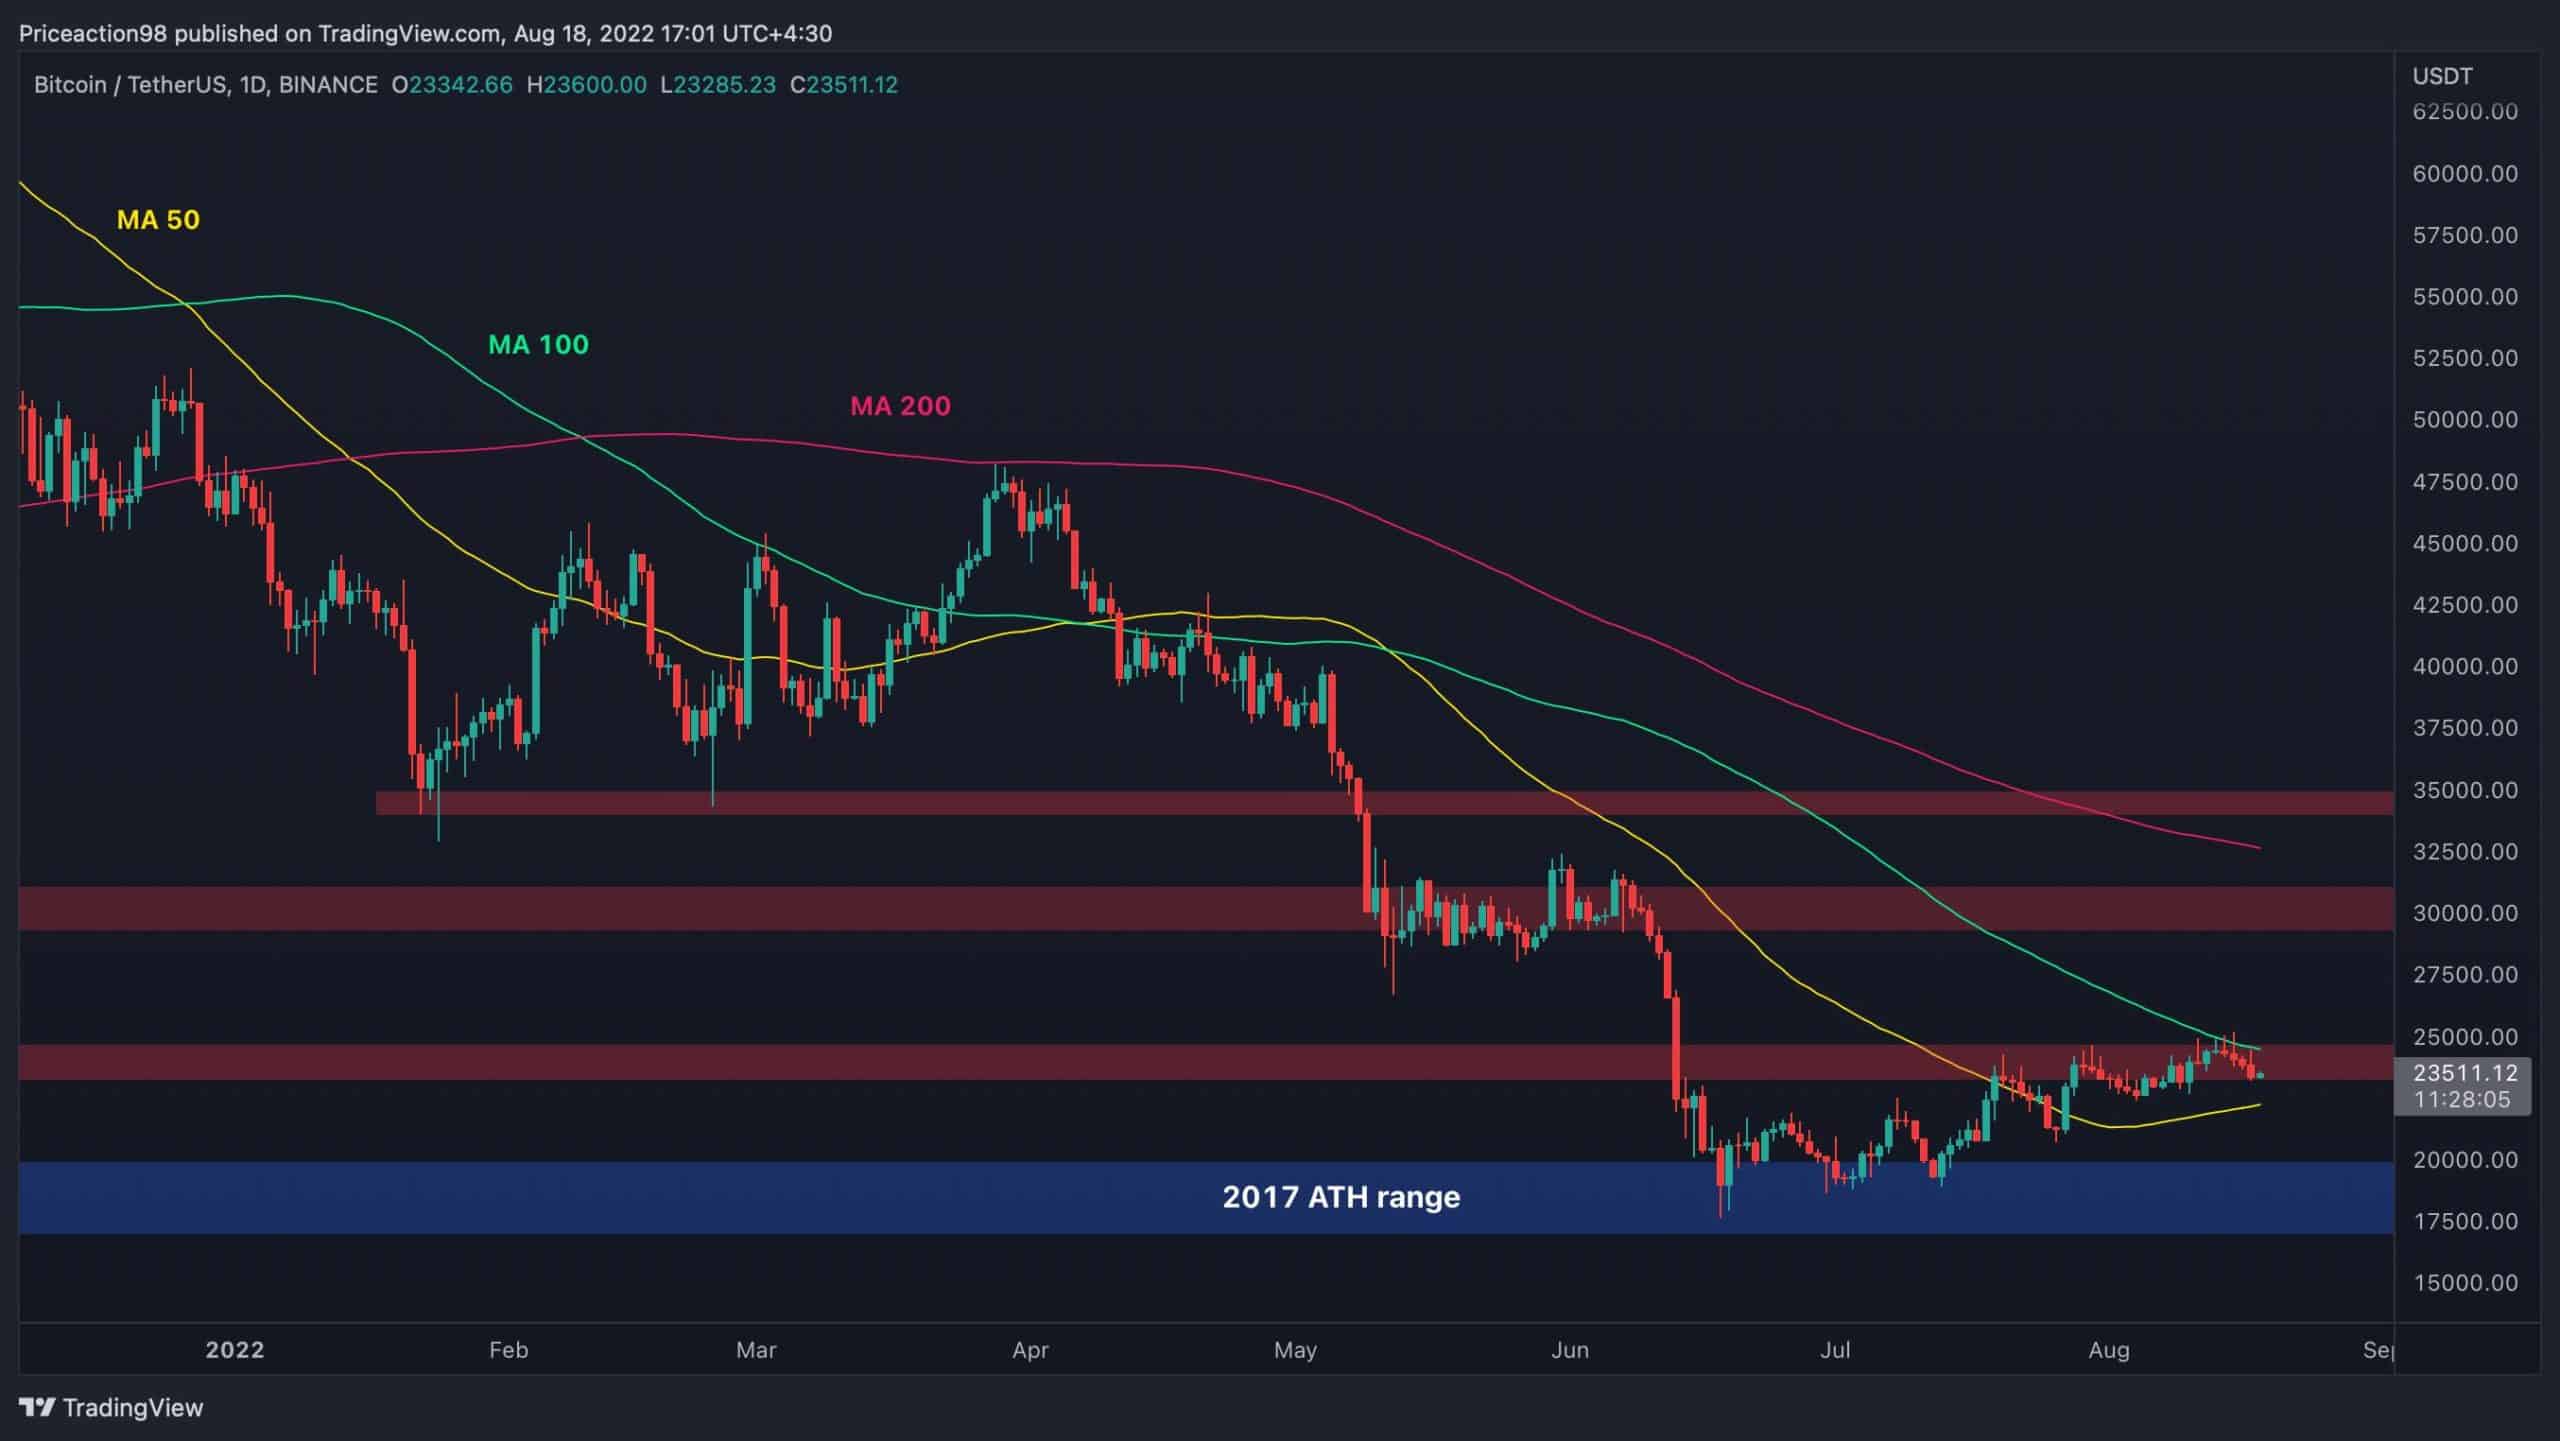
However, a bullish breakout above the 200-day moving average, which is currently trending around $33K, would be necessary to call the beginning of a new bull market. On the other hand, if the 50-day moving average fails to hold the price, a retest of the $17K-$20K support area would be more probable in the short-term.
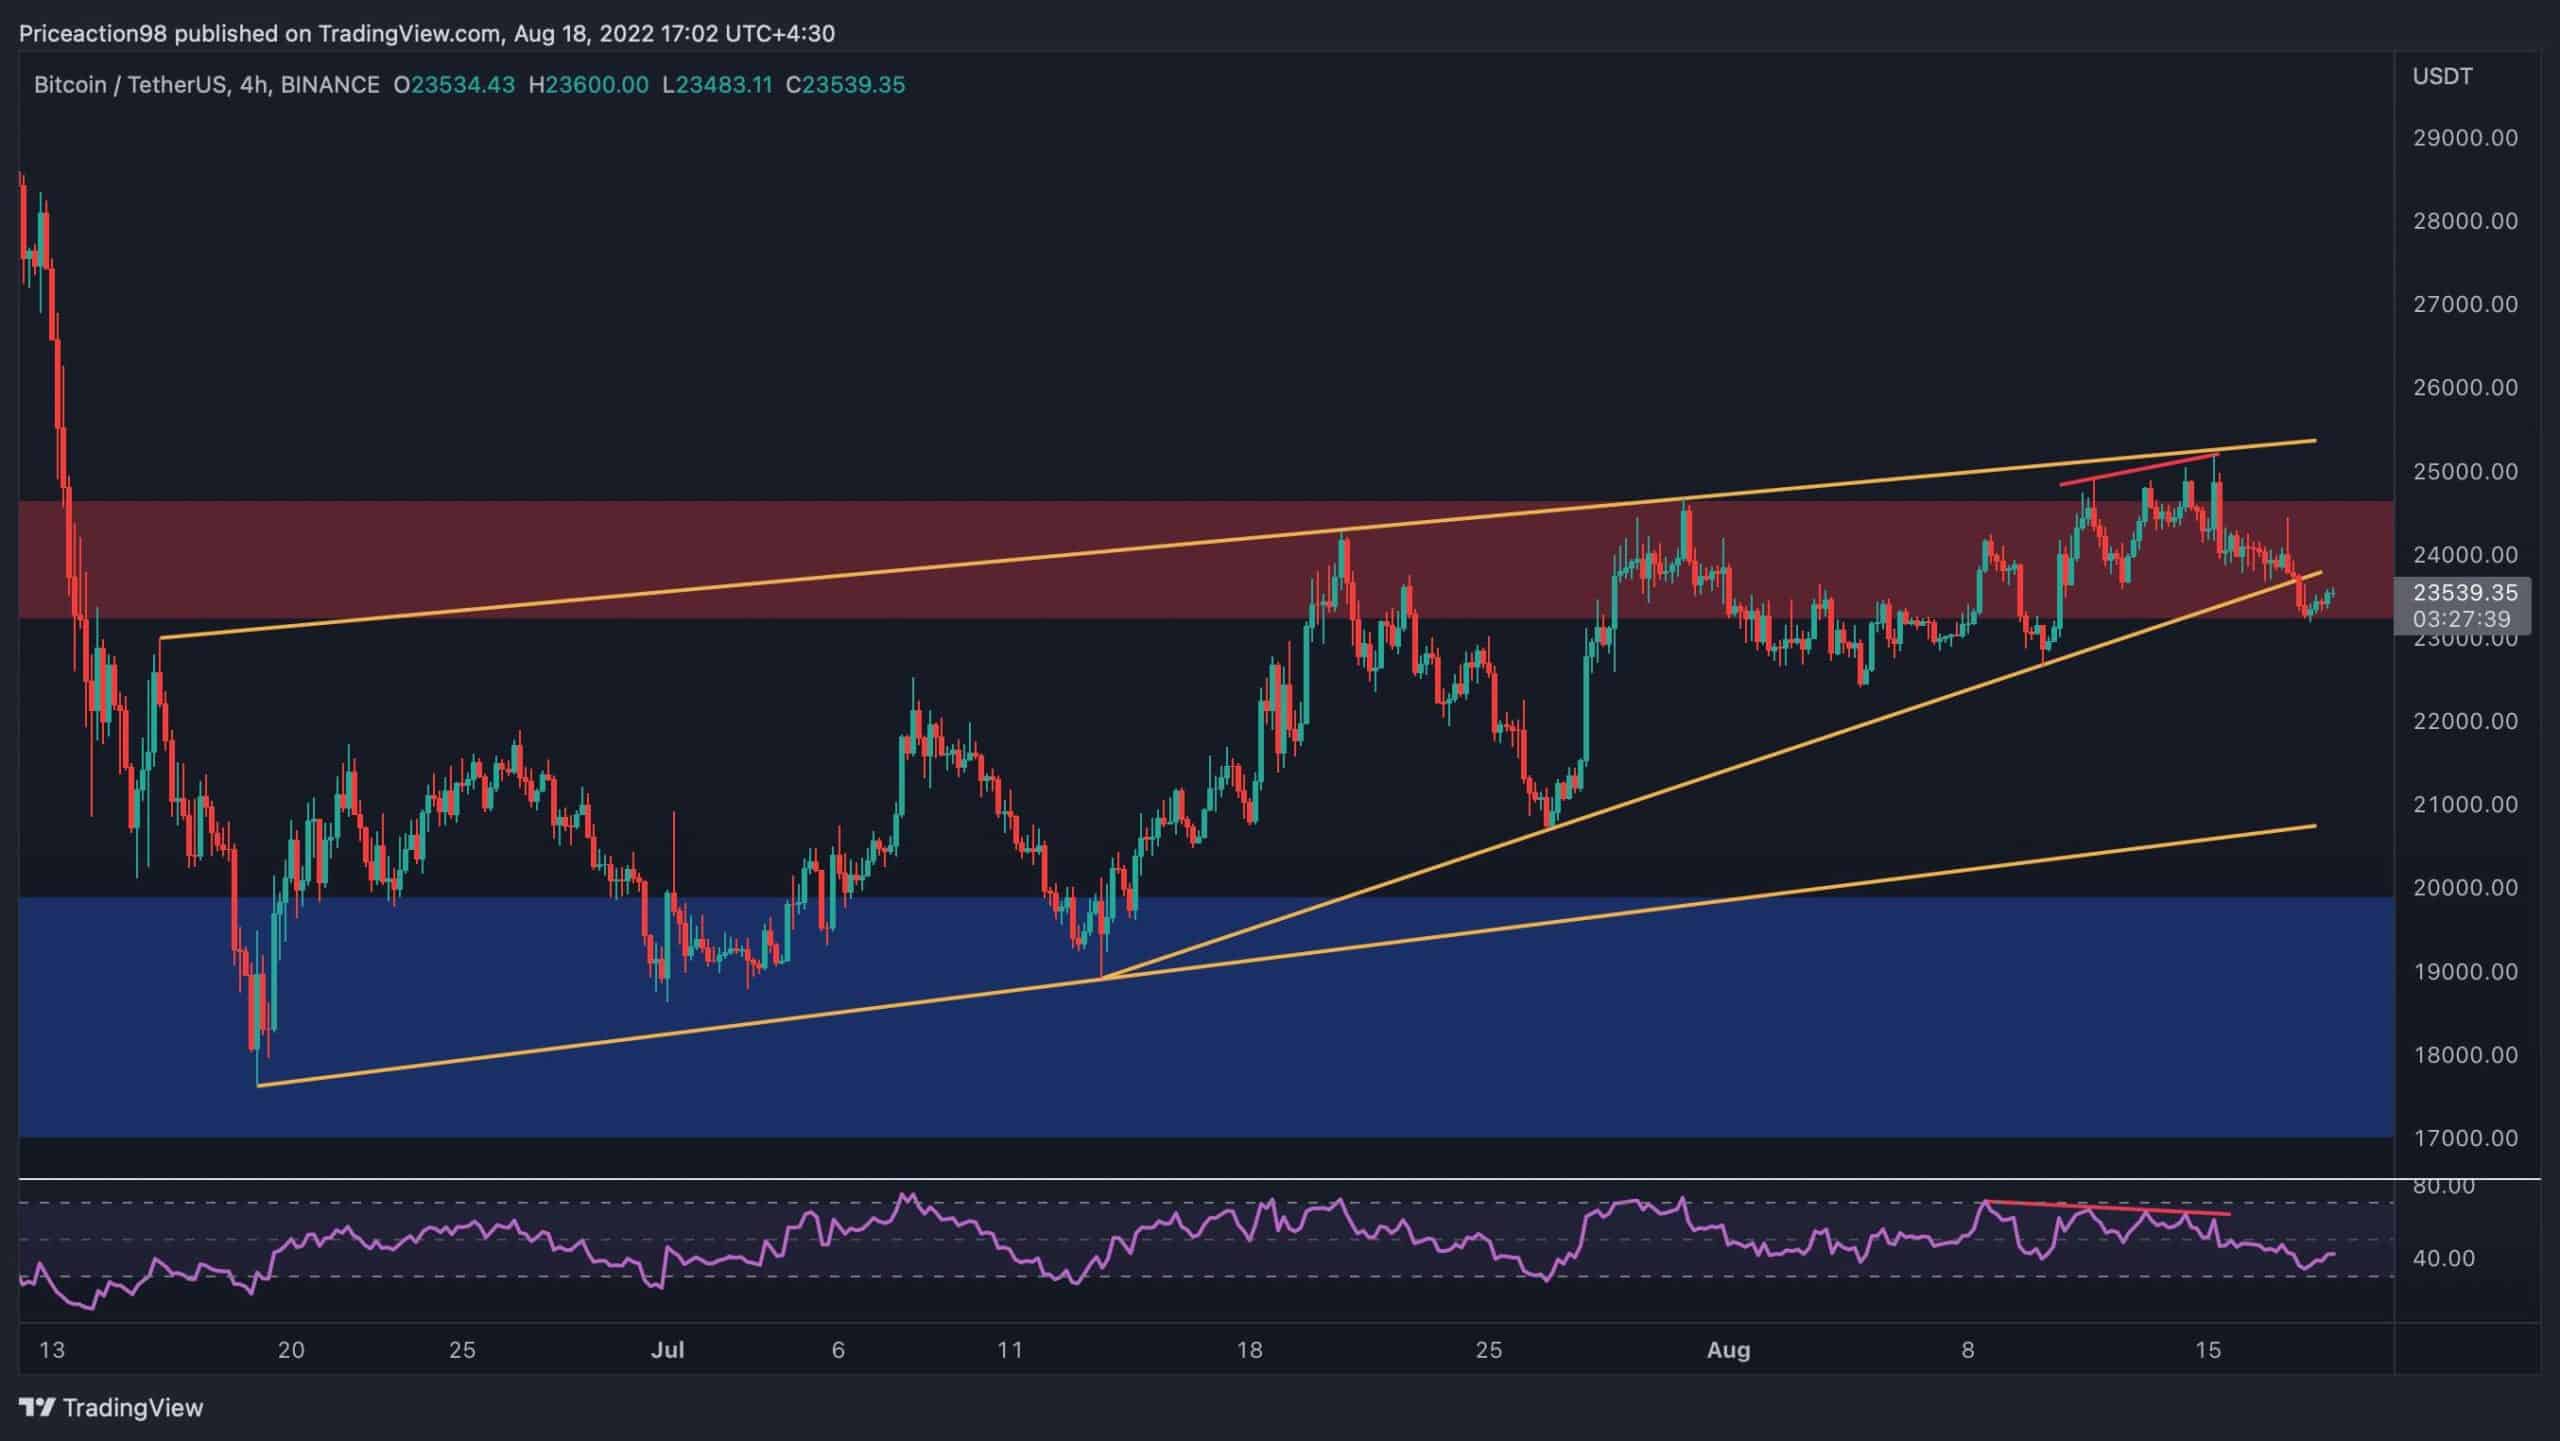
The 4-Hour Chart:
On the 4-hour timeframe, the price has been rejected from the higher boundary of the large bearish flag pattern for the fourth time. The RSI indicator signalled a massive bearish divergence between the last few highs, pointing to a potential reversal.
The price has currently broken below the bullish trendline demonstrated on the chart and seems to be pulling back for a retest and eventual continuation towards the lower boundary of the flag. In this case, it would be highly unlikely that the price rebounds from the lower trendline, and a bearish breakout and continuation towards the $17K level and even lower would be the most likely outcome.