After a slight recovery towards the K level, the 100-day moving average has successfully rejected the price. The result was the breakout of the 50-day moving average. Since then, BTC has been dormant as uncertainty returns to the market. Technical Analysis By: Shayan The Daily Chart The most recent price action for Bitcoin is not reassuring and has formed a clear bearish continuation correction wedge pattern and has been rejected three times from the upper boundary. Furthermore, if BTC goes through a pullback to the 50-day moving average, a rapid breakdown of K followed by a massive bearish leg would become more possible. On the other hand, the K level is a substantial sentimental support level for market participants. Considering the significant
Topics:
CryptoVizArt considers the following as important: Bitcoin (BTC) Price, BTC Analysis, btcusd, btcusdt
This could be interesting, too:
Chayanika Deka writes XRP, SOL, and ADA Inclusion in US Crypto Reserve Pushes Traders on Edge
Chayanika Deka writes Why Arthur Hayes Is Bullish on Bitcoin Under Trump’s Economic Strategy
Mandy Williams writes Why the Bitcoin Market Is Stuck—and the Key Metric That Could Change It: CryptoQuant CEO
Wayne Jones writes Metaplanet Acquires 156 BTC, Bringing Total Holdings to 2,391
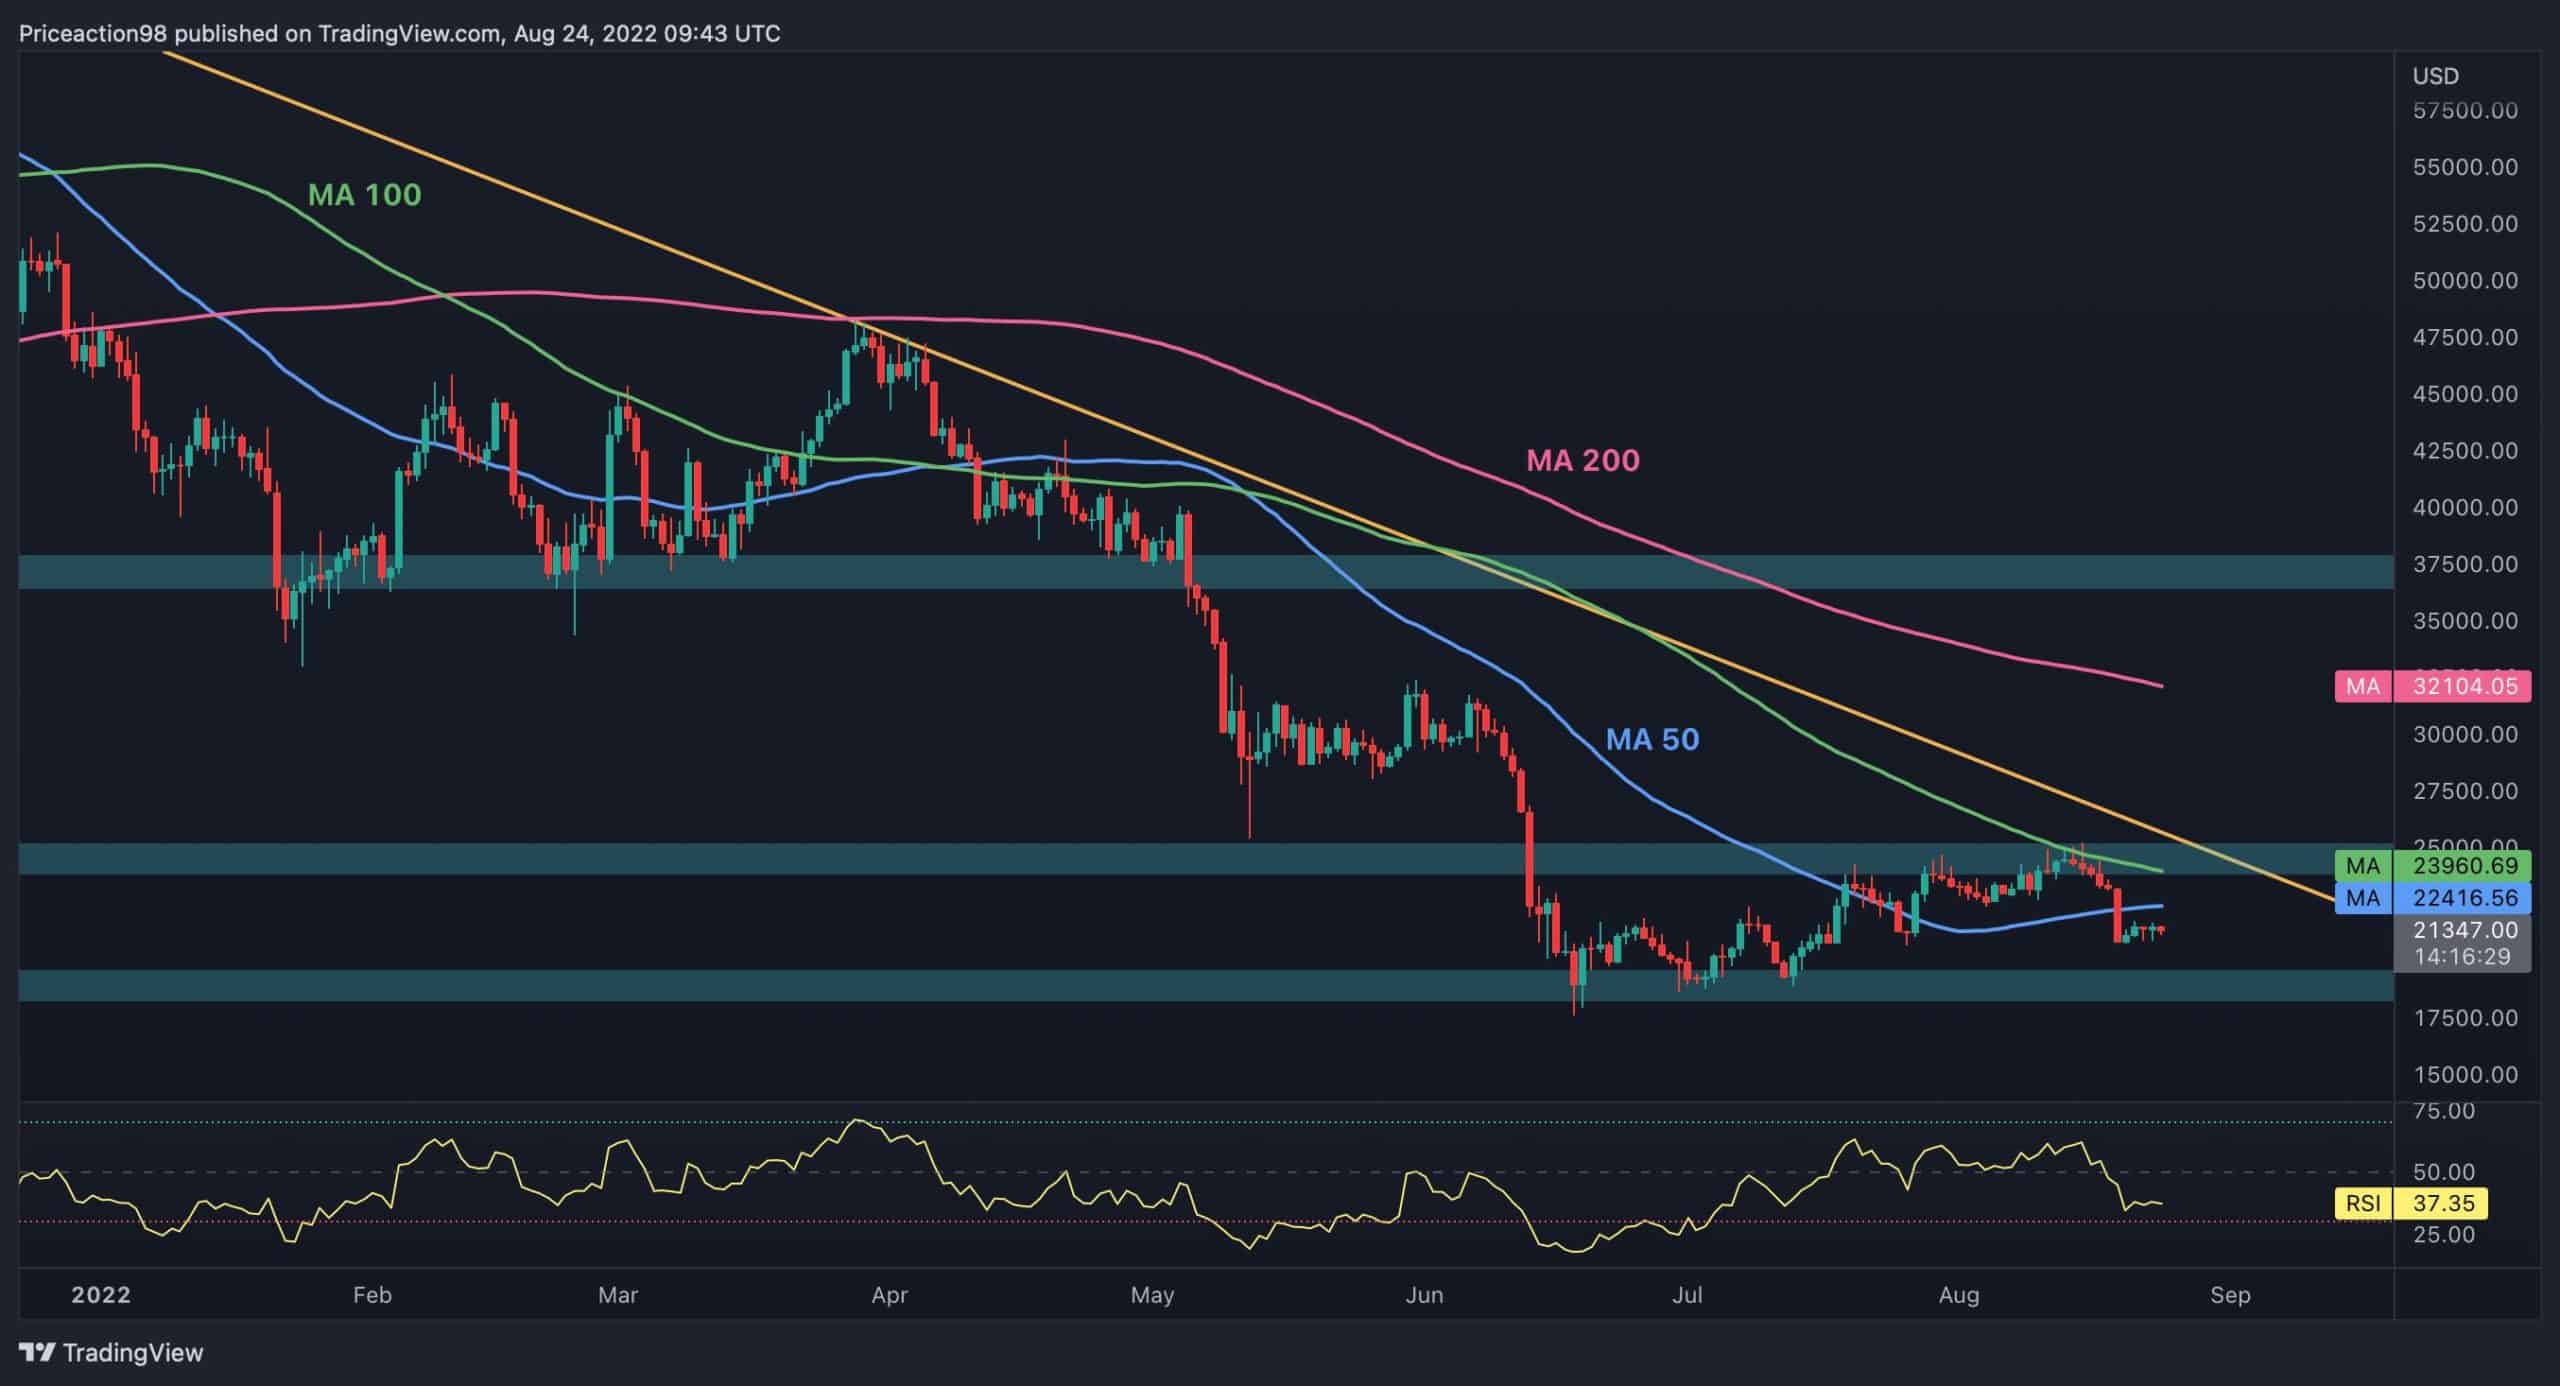
After a slight recovery towards the $24K level, the 100-day moving average has successfully rejected the price. The result was the breakout of the 50-day moving average. Since then, BTC has been dormant as uncertainty returns to the market.
Technical Analysis
By: Shayan
The Daily Chart
The most recent price action for Bitcoin is not reassuring and has formed a clear bearish continuation correction wedge pattern and has been rejected three times from the upper boundary. Furthermore, if BTC goes through a pullback to the 50-day moving average, a rapid breakdown of $20K followed by a massive bearish leg would become more possible.
On the other hand, the $20K level is a substantial sentimental support level for market participants. Considering the significant liquidity(retailers’ stops) resting below the mentioned level, the bearish momentum will likely act as a catalyst to the next downward move in case of a breakout.
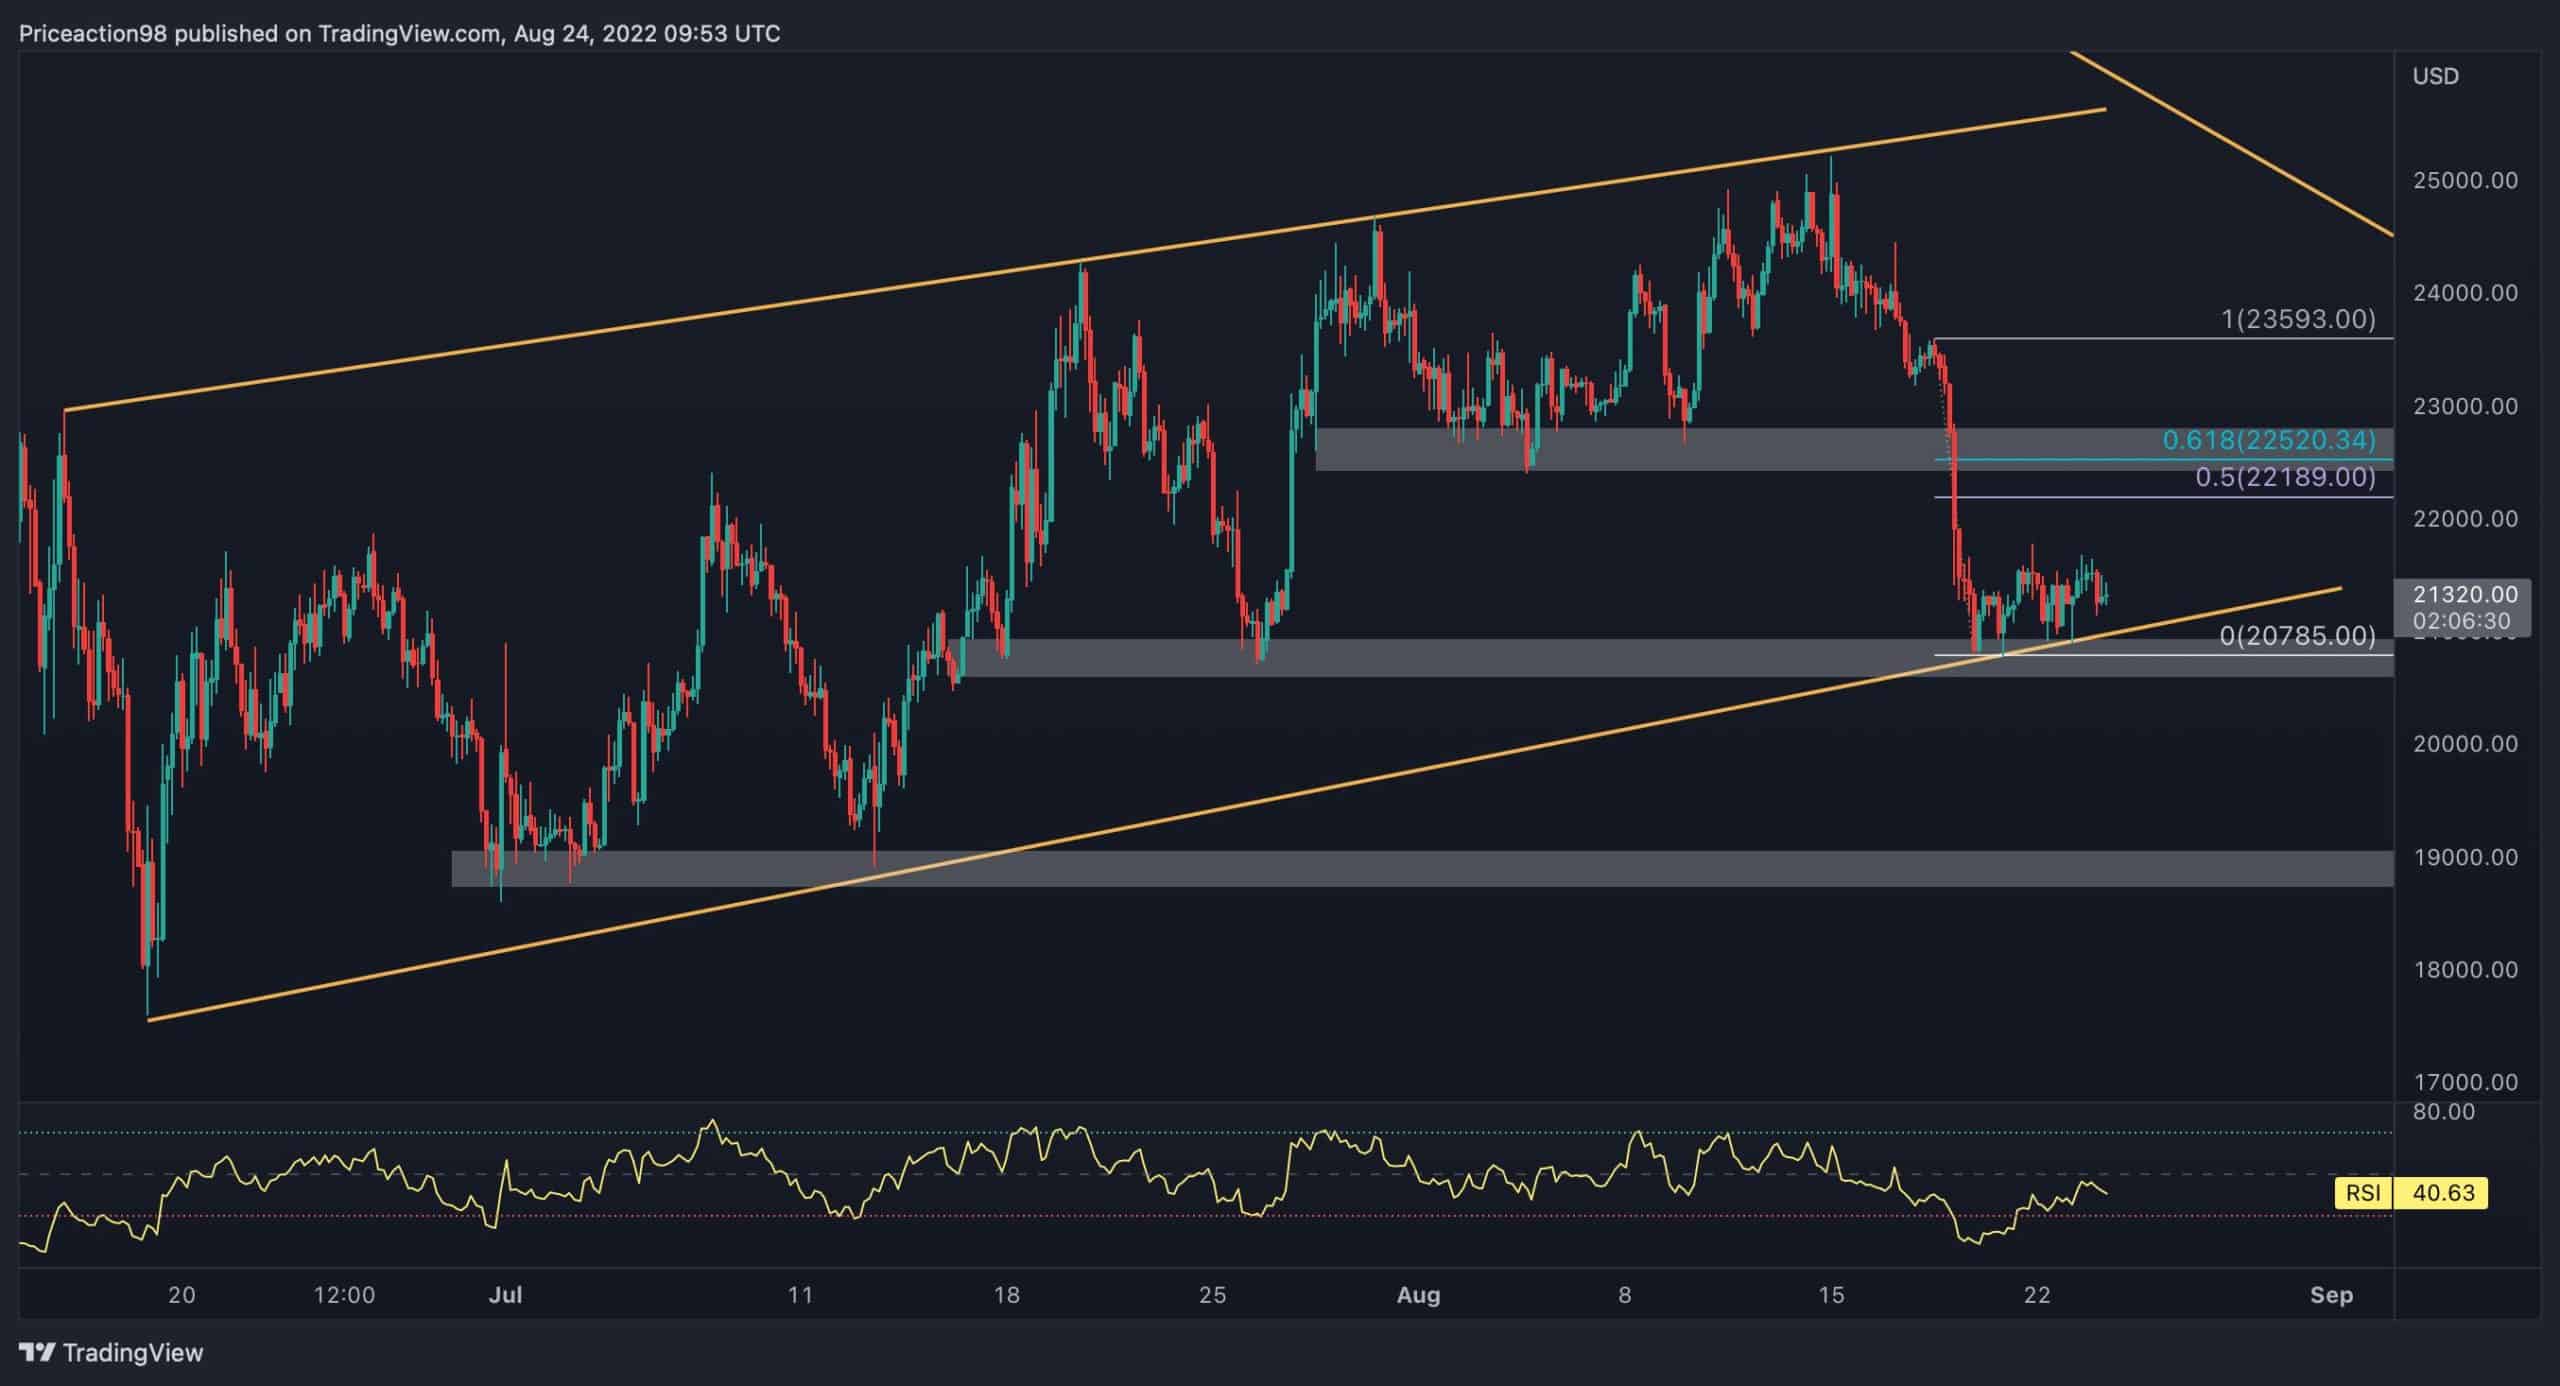
The 4-Hour Chart
The continuation correction wedge pattern is more evident in the 4-hour chart. The price was recently knocked back from the upper trendline and has fallen to the lower boundary of the wedge. There are no signs of strength in the price action showing.
However, each expansion move accompanies continuation corrections. The 61.8% level of the Fibonacci indicator is currently located at approximately $22.5K. As a result, the price might form a pullback to the 61.8% Fib level and begin the next bearish rally.
Nonetheless, there are three critical points to watch; the $21K and the $18K levels, which would provide significant support to the price, and the $22.5K resistance level. This is the main barrier for Bitcoin in the $20K-$25K price range.
Onchain Analysis
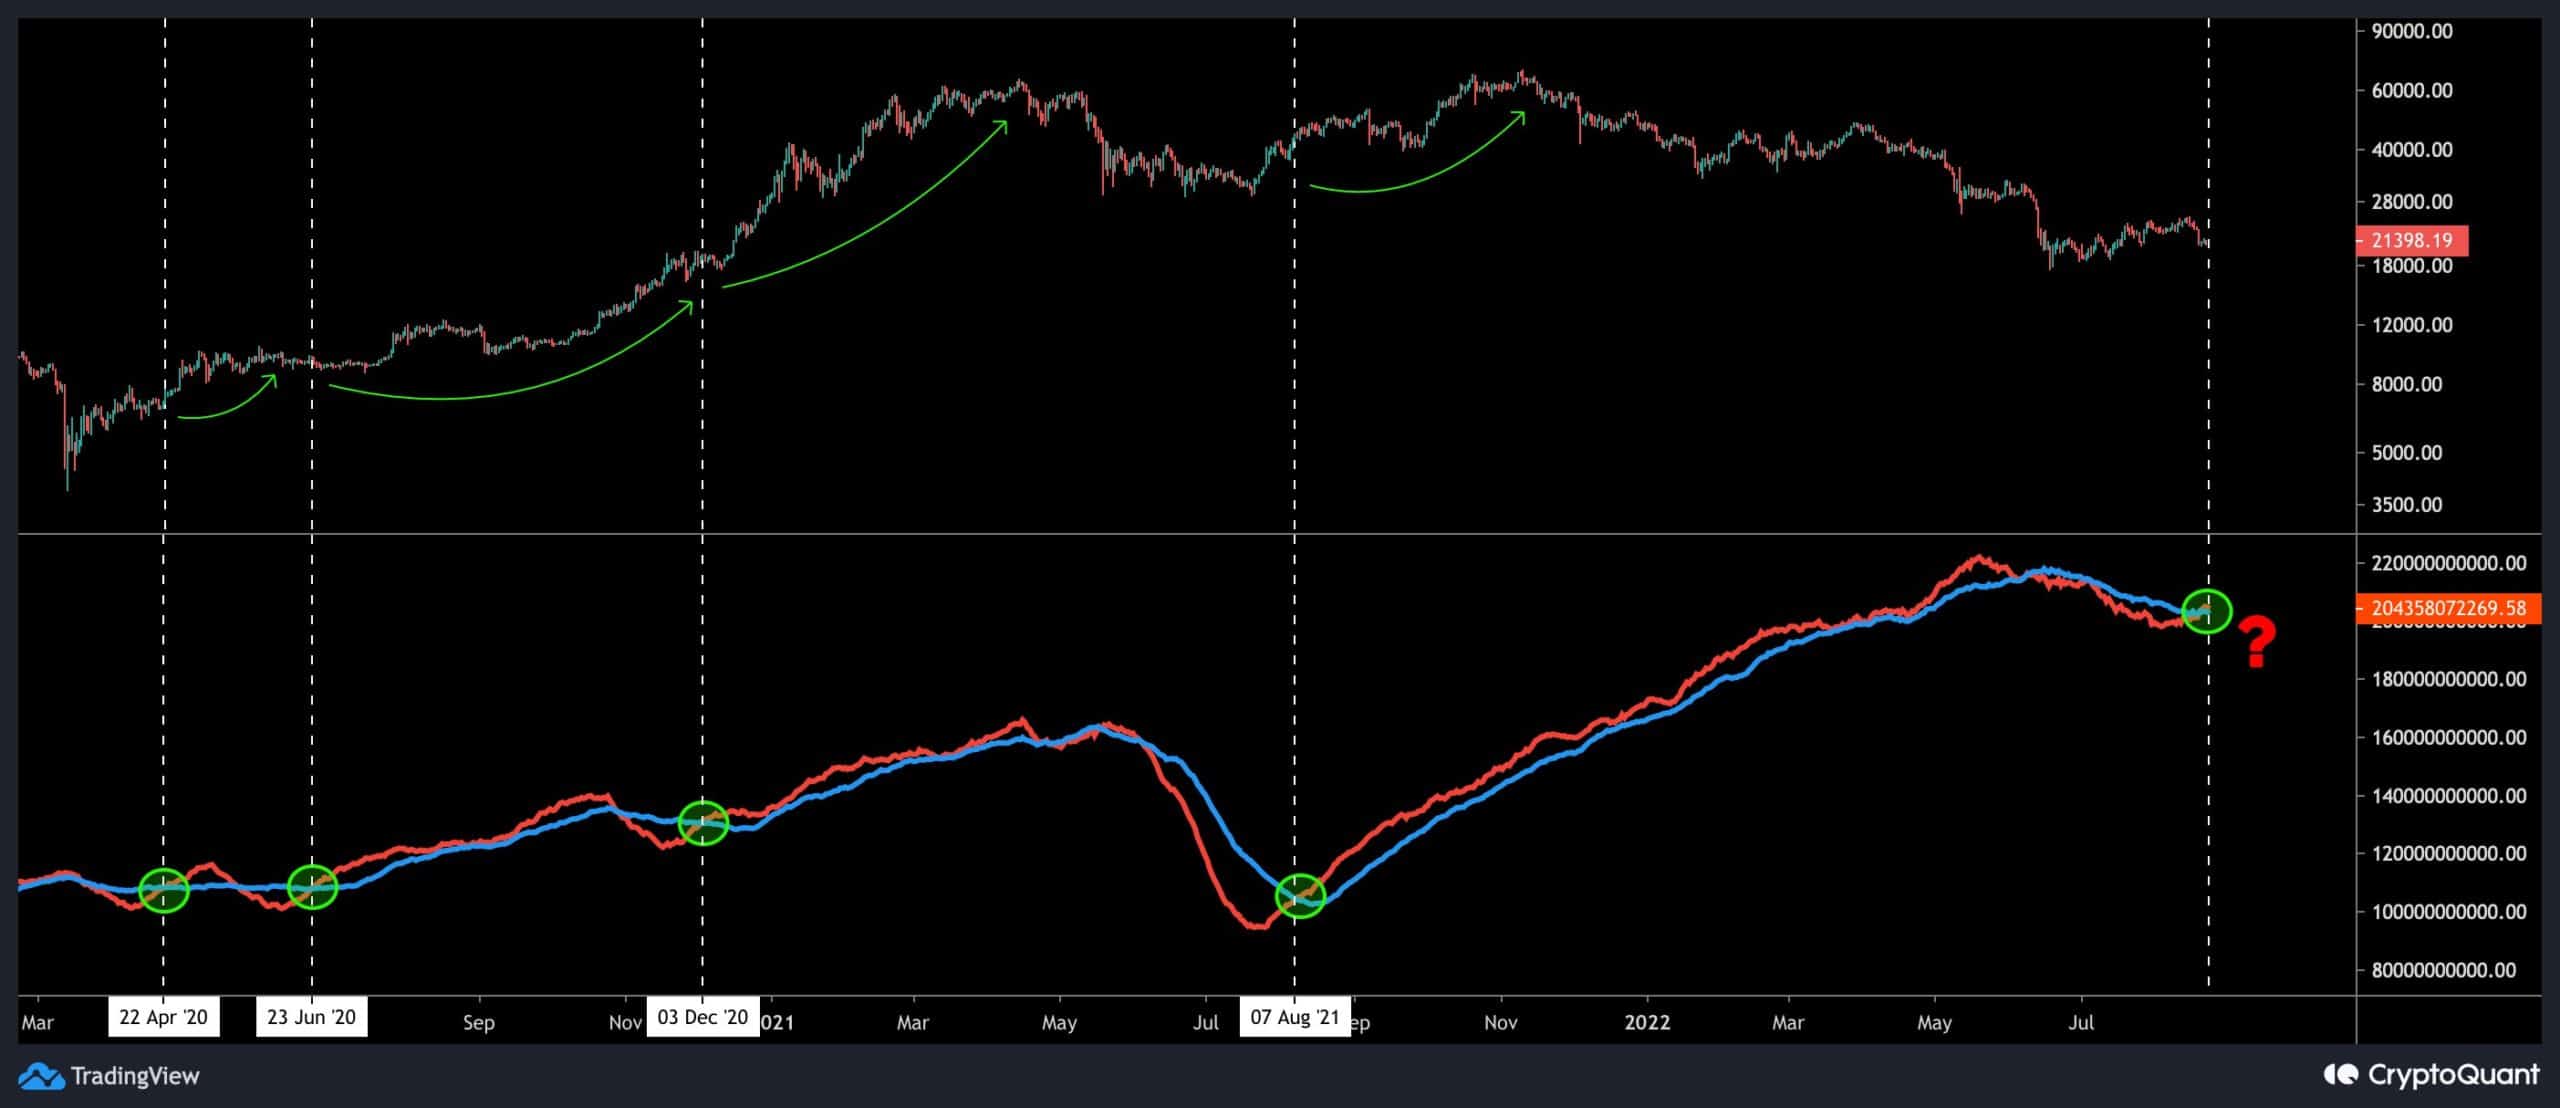
The best time to buy Bitcoin is often during the “miner capitulation” period. This is an outcome of the bearish sentiment and price action during prolonged bear markets and periods of miner surrender.
The following chart demonstrates the Bitcoin Hash Ribbon indicator, a simple 30-day and 60-day moving average of Bitcoin’s Hash Rate. It can be used to identify approximate cycle bottoms.
The miners’ capitulation is implied when the 30-day moving average crosses below the 60-day moving average; the contrary situation occurs after the capitulation is over. When the 30-day moving average crosses above the 60-day moving average beside a price spike, bullish signals are recorded.
Presently, the metric has printed a bullish sign indicating that the capitulation phase might be over. Each time it had marked a bullish sign, the price experienced a long-term bullish rally.