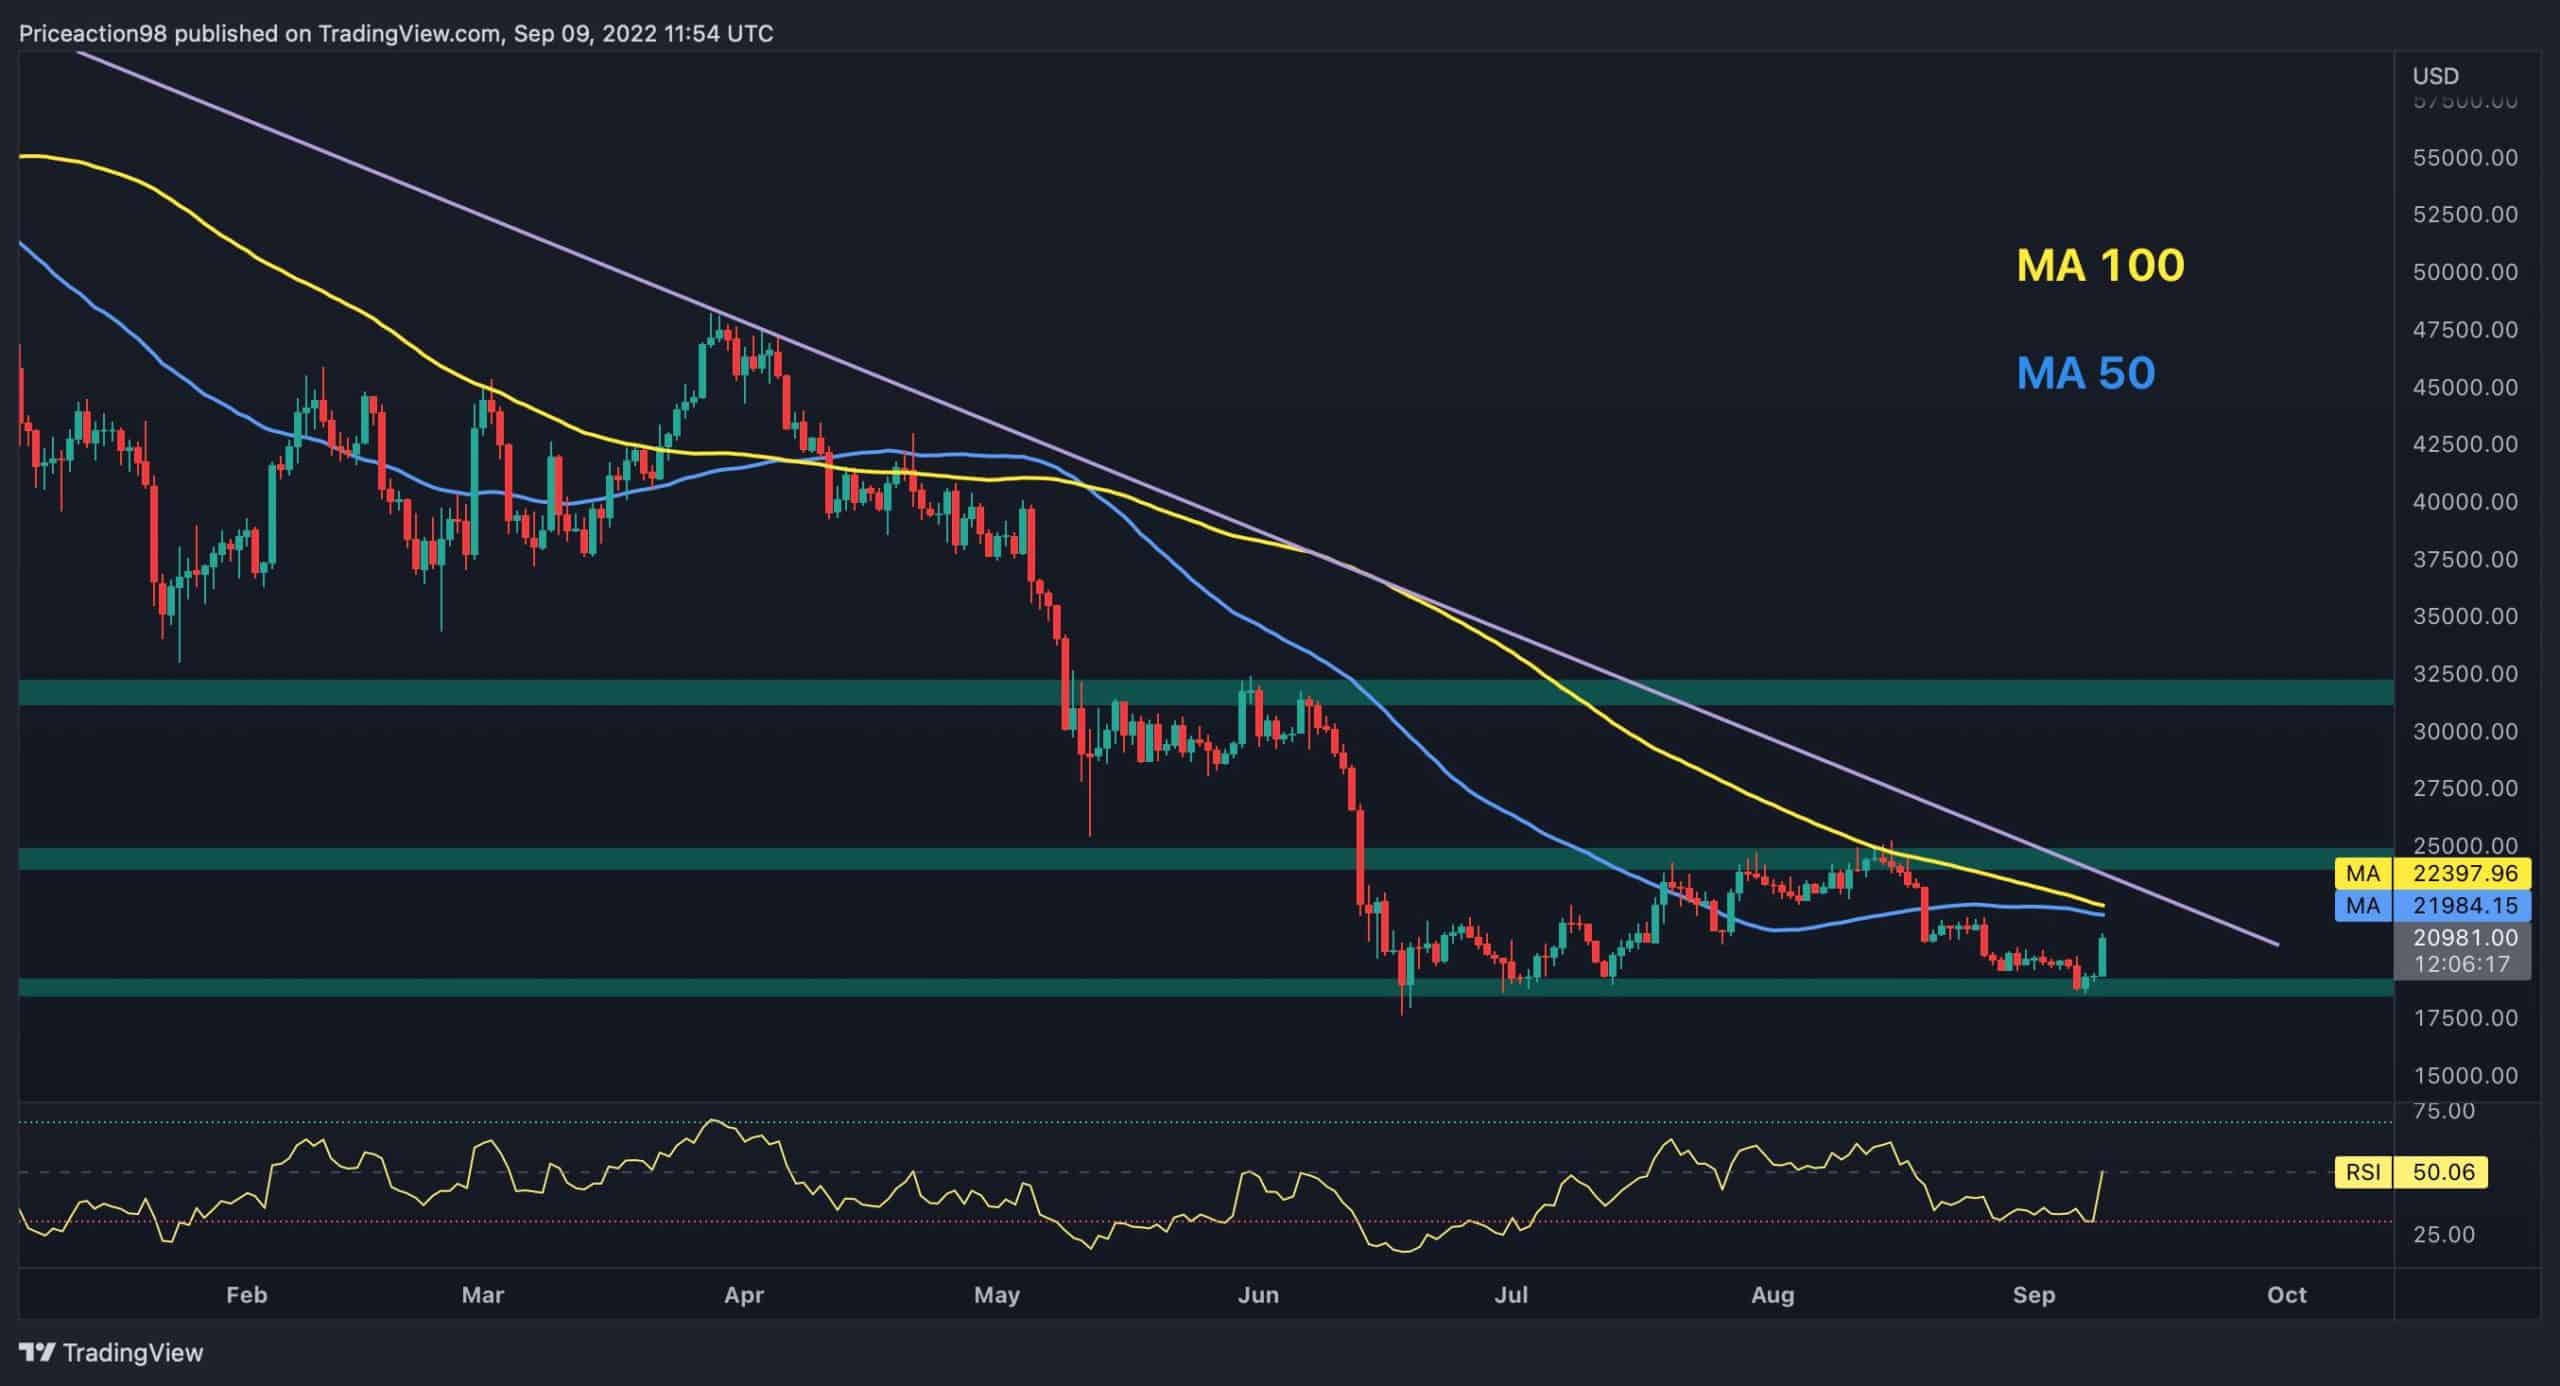
Bitcoin is finally showing signs of strength and increased by a considerable 9%. This follows a consolidation phase. The K level supported the price once again, proving its sentimental power. Technical Analysis By: Shayan The Daily Chart The K-K support appears to be the most crucial level for the bulls to hold. If they fail to do so, the market could fall toward K. Bitcoin’s price has been supported for the fourth time and is now aiming for the 50-day MA at .9K. The 50-day moving average line is about to cross the 100-day moving average line, which can be identified as a bullish signal. If the cryptocurrency successfully breaks the 50-day and the 100-day MA lines, a mid-term bullish phase will become more likely. Also, these lines currently act as critical
Topics:
CryptoVizArt considers the following as important: Bitcoin (BTC) Price, BTC Analysis, btcusd, btcusdt
This could be interesting, too:
Chayanika Deka writes XRP, SOL, and ADA Inclusion in US Crypto Reserve Pushes Traders on Edge
Chayanika Deka writes Why Arthur Hayes Is Bullish on Bitcoin Under Trump’s Economic Strategy
Mandy Williams writes Why the Bitcoin Market Is Stuck—and the Key Metric That Could Change It: CryptoQuant CEO
Wayne Jones writes Metaplanet Acquires 156 BTC, Bringing Total Holdings to 2,391
Bitcoin is finally showing signs of strength and increased by a considerable 9%. This follows a consolidation phase. The $18K level supported the price once again, proving its sentimental power.
Technical Analysis
By: Shayan
The Daily Chart
The $18K-$19K support appears to be the most crucial level for the bulls to hold. If they fail to do so, the market could fall toward $15K.
Bitcoin’s price has been supported for the fourth time and is now aiming for the 50-day MA at $21.9K. The 50-day moving average line is about to cross the 100-day moving average line, which can be identified as a bullish signal.
If the cryptocurrency successfully breaks the 50-day and the 100-day MA lines, a mid-term bullish phase will become more likely. Also, these lines currently act as critical resistance levels.
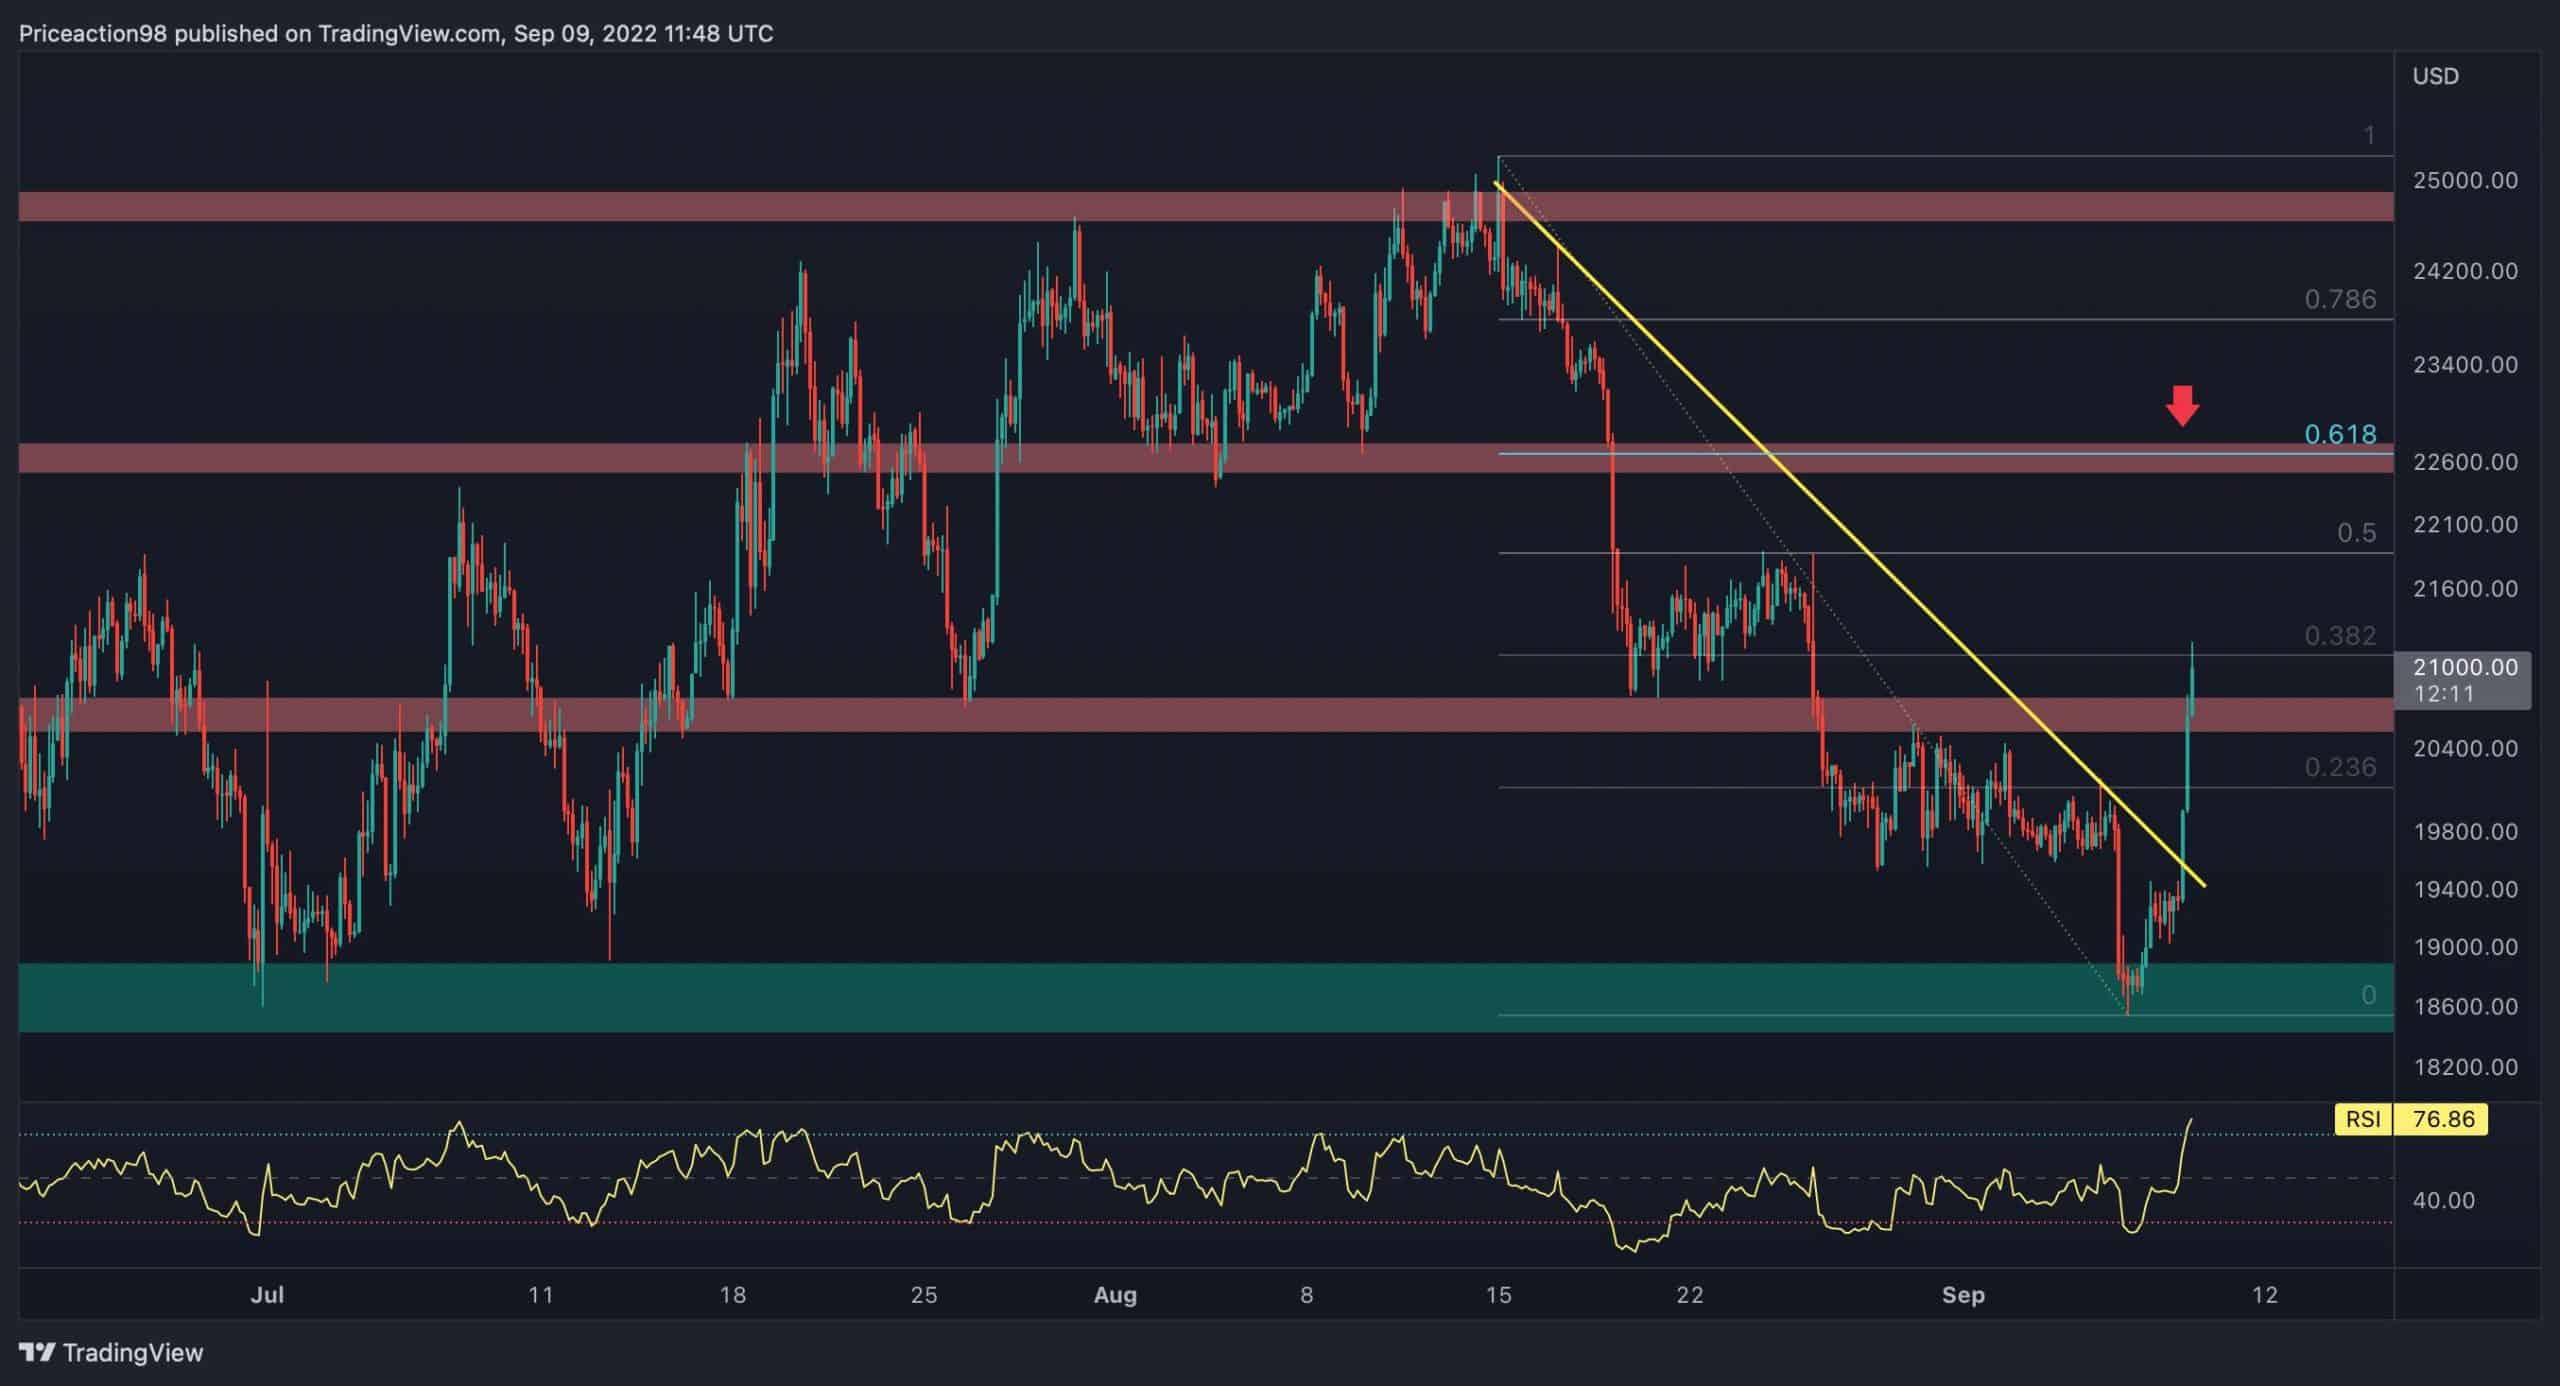
The 4-Hour Chart
The $18K level has shown its sentimental power again. The price has increased by around 9% after testing it for the fourth time. As a result, BTC broke the multi-week descending trendline and continued to surge.
The Fibonacci retracement indicator for the recent bearish expansion move reveals that the 61.8% level of the retracement aligns with the $22.5K resistance. The price must surpass the above-mentioned levels in order to go on with the bullish rally.
Sentiment Analysis
By: Edris
Coinbase Premium Index
Coinbase is the most popular crypto exchange in the United States and has the largest trading volume in the country. It is the only publicly traded crypto exchange in the world. This is a significant characteristic attracting American institutions and wealthy investors who are looking to put their money into the industry.
The chart below demonstrates the Coinbase Premium Index – the Bitcoin price gap percentage between Coinbase Pro and Binance. Values above 0 are interpreted as significant buying pressure in Coinbase and values below 0 indicate higher selling pressure.
This metric has rapidly dropped into negative territory as the price broke below the $30K level a few months back. This led to massive selling pressure by the US investors and institutions after almost 2 years of constant accumulation.
However, US institutions and investors have started the accumulation once again at the $20K level. This behavior could be a sign that the bear market bottom is near as it shows that the supply from Coinbase has dried out and demand is returning to the market.
