Cardano, one of the altcoins with exceptional performance in 2021, has now dropped 75 percent from its ATH. Recently, ADA lost the critical support level at . The price is now declining, forming a falling wedge, accompanied by 100-day MA (marked by a white line on the daily chart). The Daily Chart (USD Pair) Technical analysis by Grizzly The OBV indicator is also dropping below its downtrend line. Assessing these bearish signals, breaking above the red zone (static resistance) is the first condition for shifting back to a bullish trend. The current key support/resistance levels are shown in the chart below. Key support levels: %excerpt%.73 and %excerpt%.45 Key resistance levels: and .2 The Daily Chart (BTC Pair) The ADA price is at the intersection of dynamic and static support
Topics:
CryptoVizArt considers the following as important: ADABTC, ADAUSD, Cardano (ADA) Price, Price Analysis
This could be interesting, too:
Jordan Lyanchev writes Cardano (ADA) Surpasses Dogecoin After 55% Surge
Jordan Lyanchev writes Trump Confirms Work on Strategic Crypto Reserve: XRP, ADA, SOL Included
Dimitar Dzhondzhorov writes Millions of ADA Sold by Cardano Whales During Market Crash – Will the Decline Continue?
Jordan Lyanchev writes Here’s How Cardano’s 17% Weekly Correction Can Help ADA Hit This Cycle: Analyst
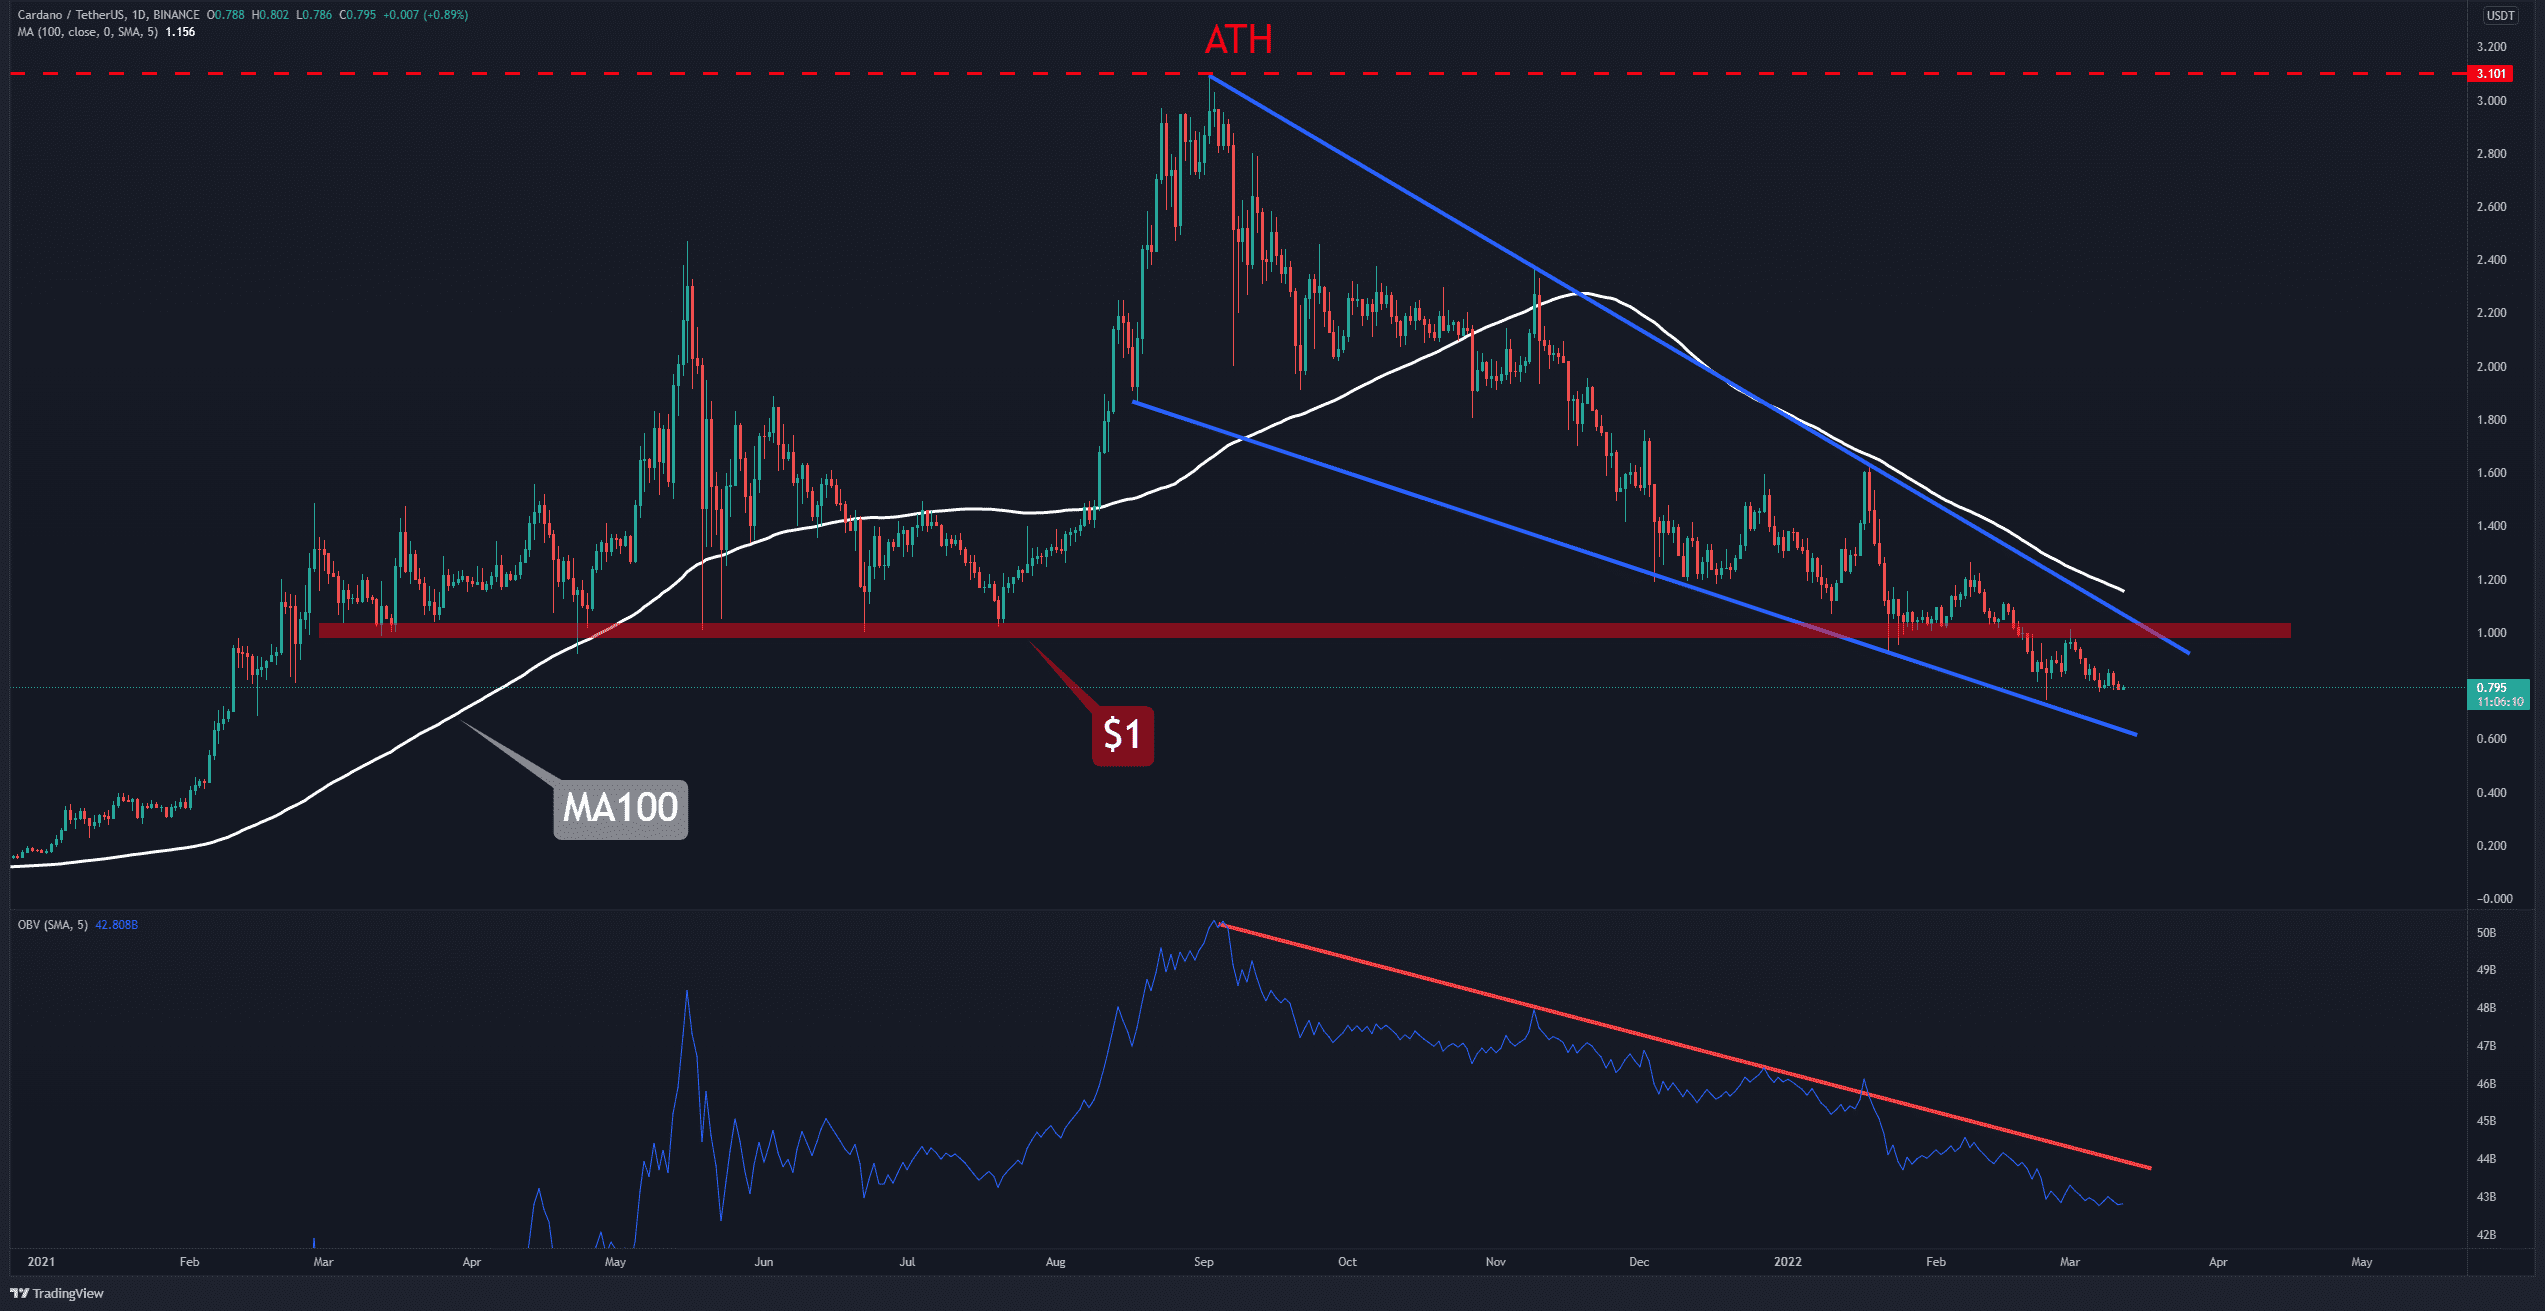
Cardano, one of the altcoins with exceptional performance in 2021, has now dropped 75 percent from its ATH. Recently, ADA lost the critical support level at $1. The price is now declining, forming a falling wedge, accompanied by 100-day MA (marked by a white line on the daily chart).
The Daily Chart (USD Pair)
Technical analysis by Grizzly
The OBV indicator is also dropping below its downtrend line. Assessing these bearish signals, breaking above the red zone (static resistance) is the first condition for shifting back to a bullish trend. The current key support/resistance levels are shown in the chart below.
Key support levels: $0.73 and $0.45
Key resistance levels: $1 and $1.2
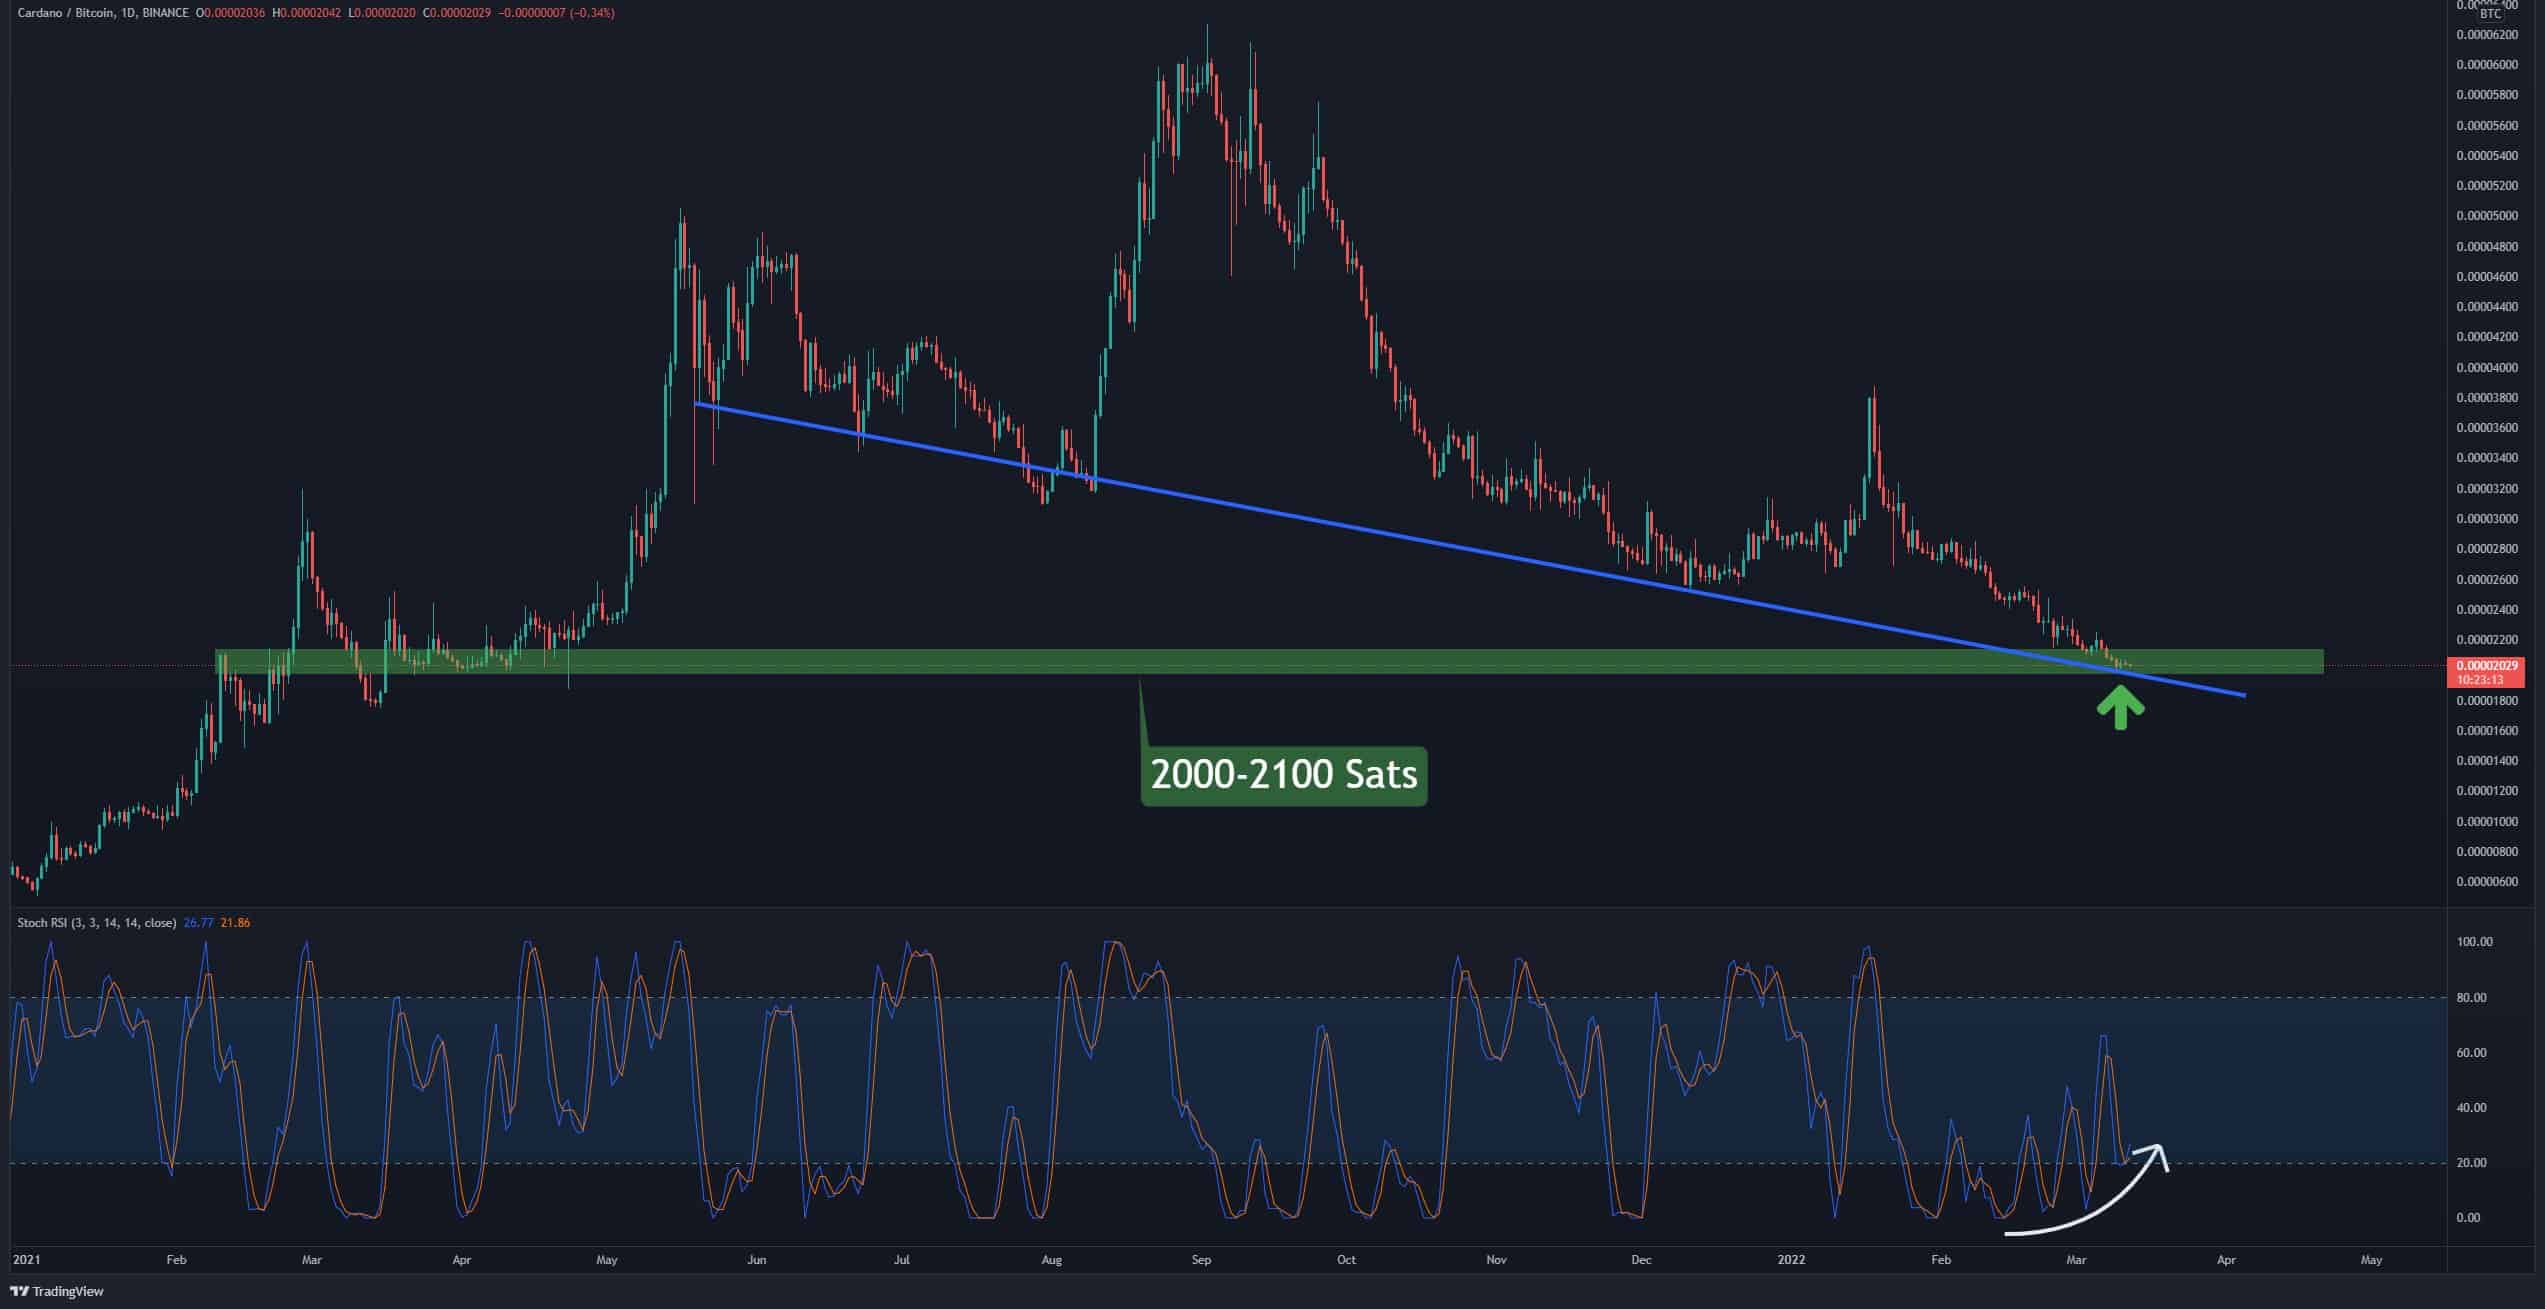
The Daily Chart (BTC Pair)
The ADA price is at the intersection of dynamic and static support against BTC (ADA/BTC). The majority of technical speculators expect a rebound due to the divergence and higher lows formed by the Stochastic RSI oscillator.
In general, according to the recent interviews of the project founder and fundamental news such as the increase of the TVL, the growth of long-term holders, staking value, and smart contracts on Cardano, positive price movements are possible in the mid to long term. The overall crypto sentiment might cause extra volatility in ADA in the short term.