After surging 60% from the bottom of the marked descending channel during the second half of March, Cardano has now reached a critical resistance level at the top of the channel. The bulls are trying to break out of it, however, they have so far failed in closing a daily candle above it. Unlike BTC and ETH, which are struggling at the daily MA-200 line, ADA has not yet managed to touch it. The important moving average currently lies around .5. Technical analysis by Grizzly The Daily Chart Cardano has now calmed down following a 2-week solid increase. From the bullish side, the major challenge that ADA is currently facing is the static resistance at .26. Breaking above this resistance is critical in order to continue the uptrend. If the price can break above this
Topics:
CryptoVizArt considers the following as important: ADABTC, ADAUSD, Cardano (ADA) Price, Price Analysis
This could be interesting, too:
Jordan Lyanchev writes Cardano (ADA) Surpasses Dogecoin After 55% Surge
Jordan Lyanchev writes Trump Confirms Work on Strategic Crypto Reserve: XRP, ADA, SOL Included
Dimitar Dzhondzhorov writes Millions of ADA Sold by Cardano Whales During Market Crash – Will the Decline Continue?
Jordan Lyanchev writes Here’s How Cardano’s 17% Weekly Correction Can Help ADA Hit This Cycle: Analyst
After surging 60% from the bottom of the marked descending channel during the second half of March, Cardano has now reached a critical resistance level at the top of the channel.
The bulls are trying to break out of it, however, they have so far failed in closing a daily candle above it.
Unlike BTC and ETH, which are struggling at the daily MA-200 line, ADA has not yet managed to touch it. The important moving average currently lies around $1.5.
Technical analysis by Grizzly
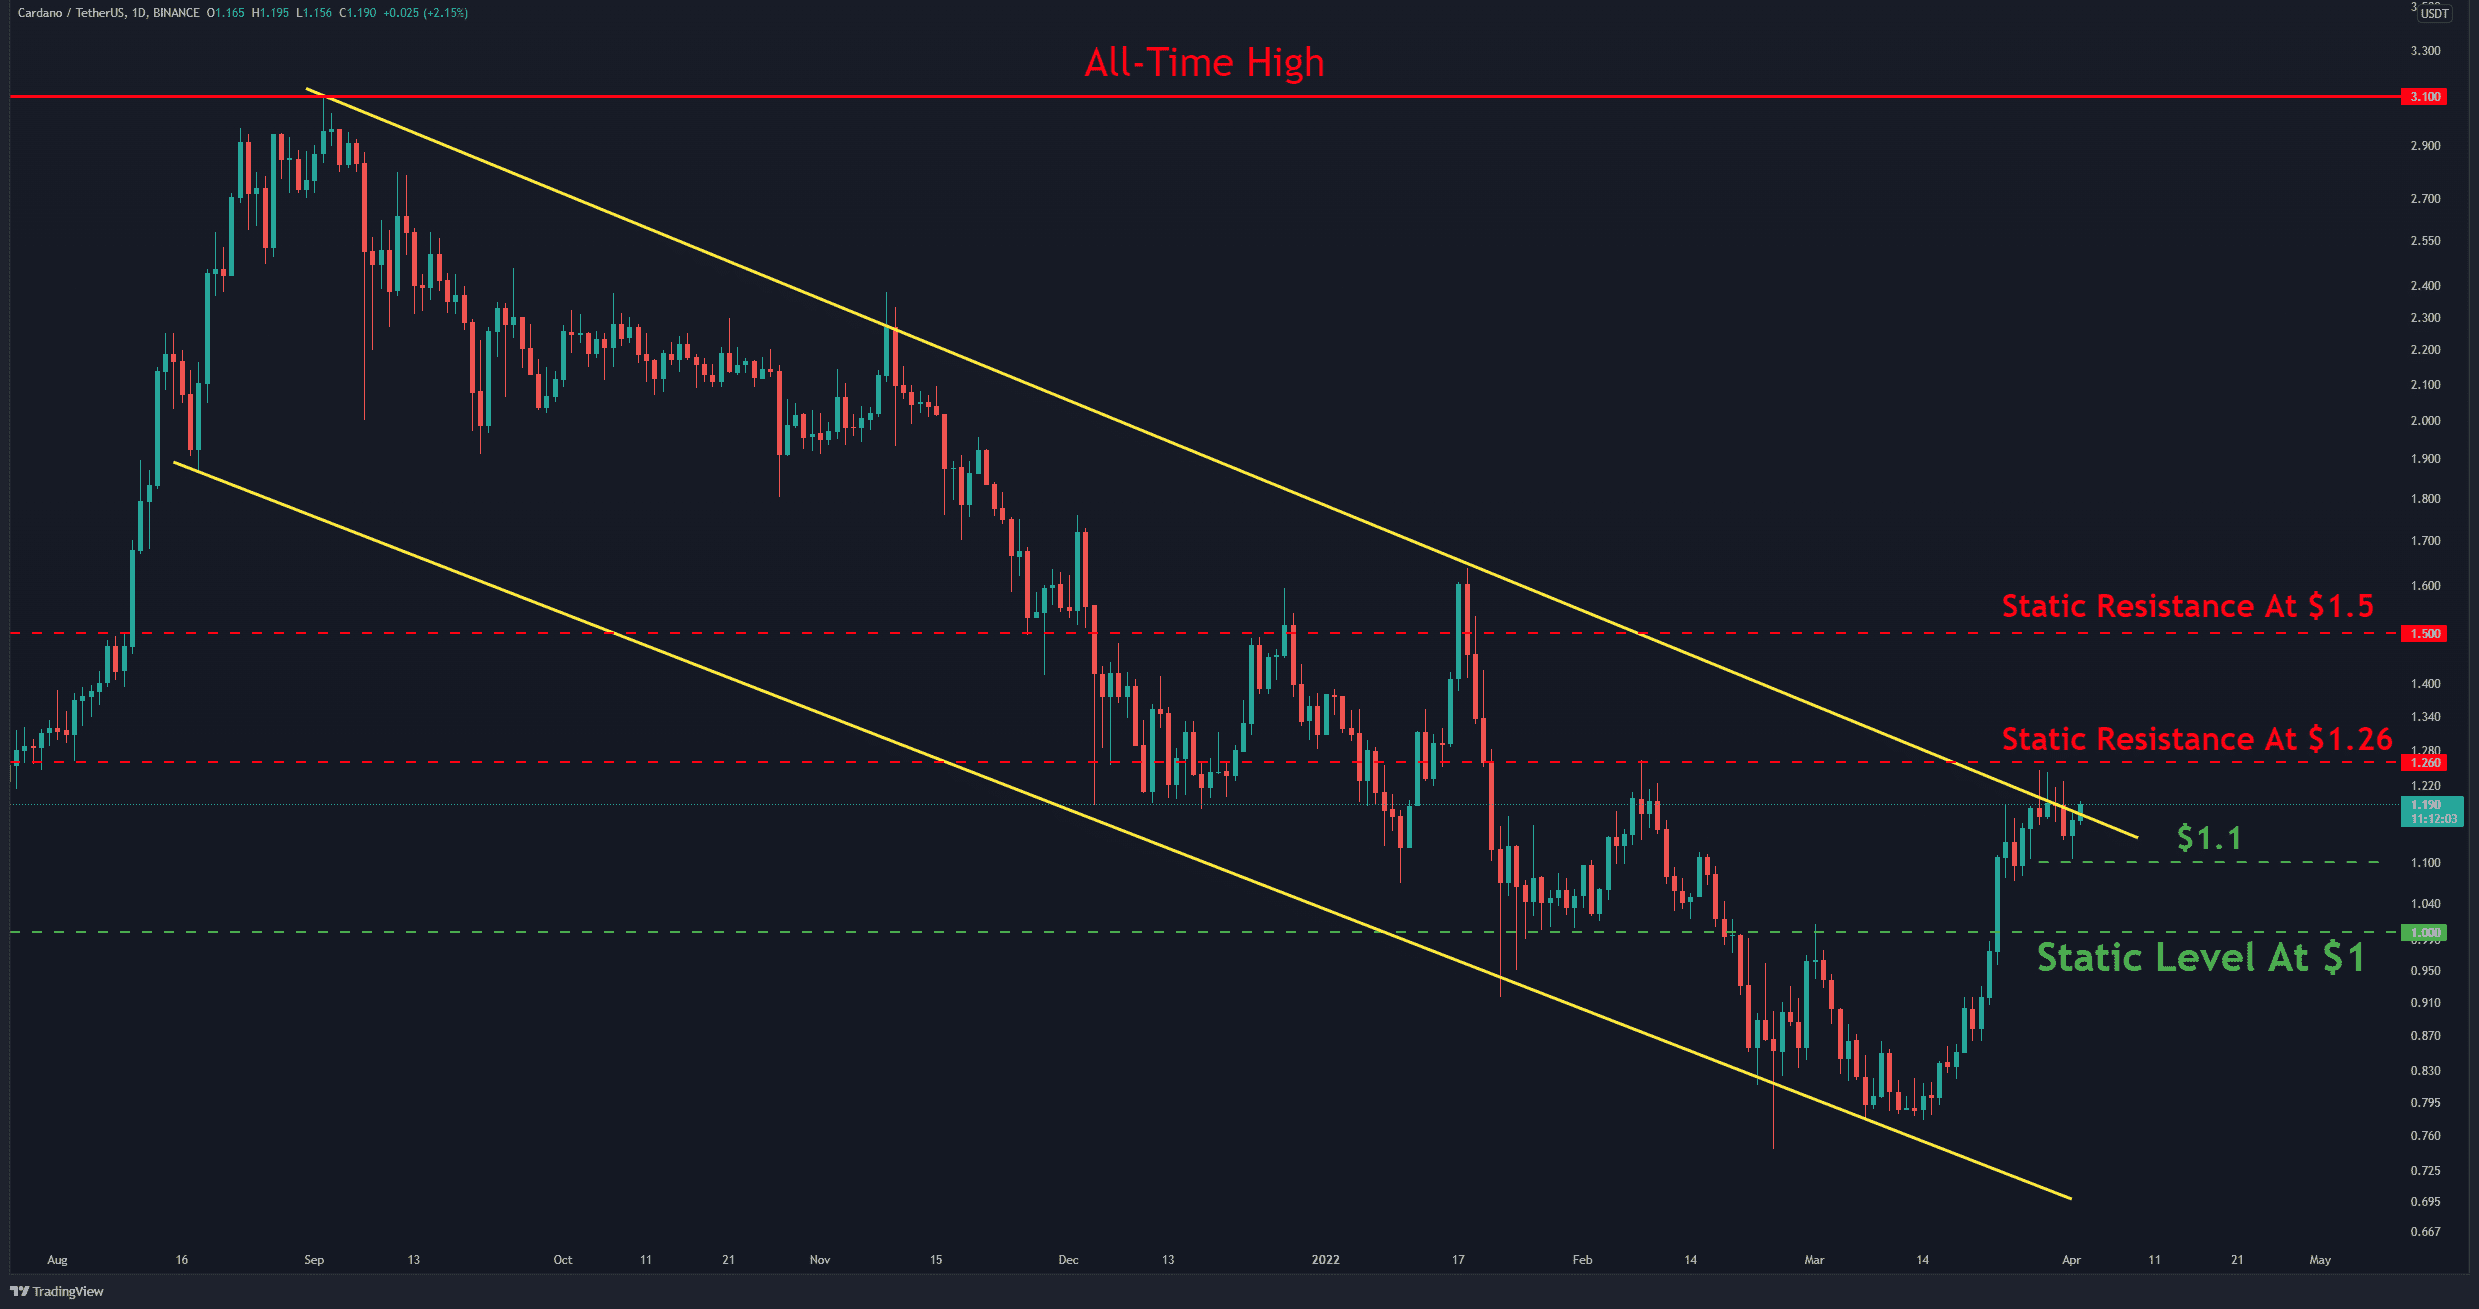
The Daily Chart
Cardano has now calmed down following a 2-week solid increase. From the bullish side, the major challenge that ADA is currently facing is the static resistance at $1.26.
Breaking above this resistance is critical in order to continue the uptrend. If the price can break above this barrier, the next resistance lies at $1.5, intersecting with the daily MA200.
On the other hand, the first major support lies at $1.1 and then at $1. Considering the market conditions, it is more likely that ADA will retest the key resistance.
RSI 30-day: Moving upward in bullish zone towards the marked descending line.
Moving Averages Levels
MA20: $1.02
MA50: $0.95
MA100: $1.09
MA200: $1.5
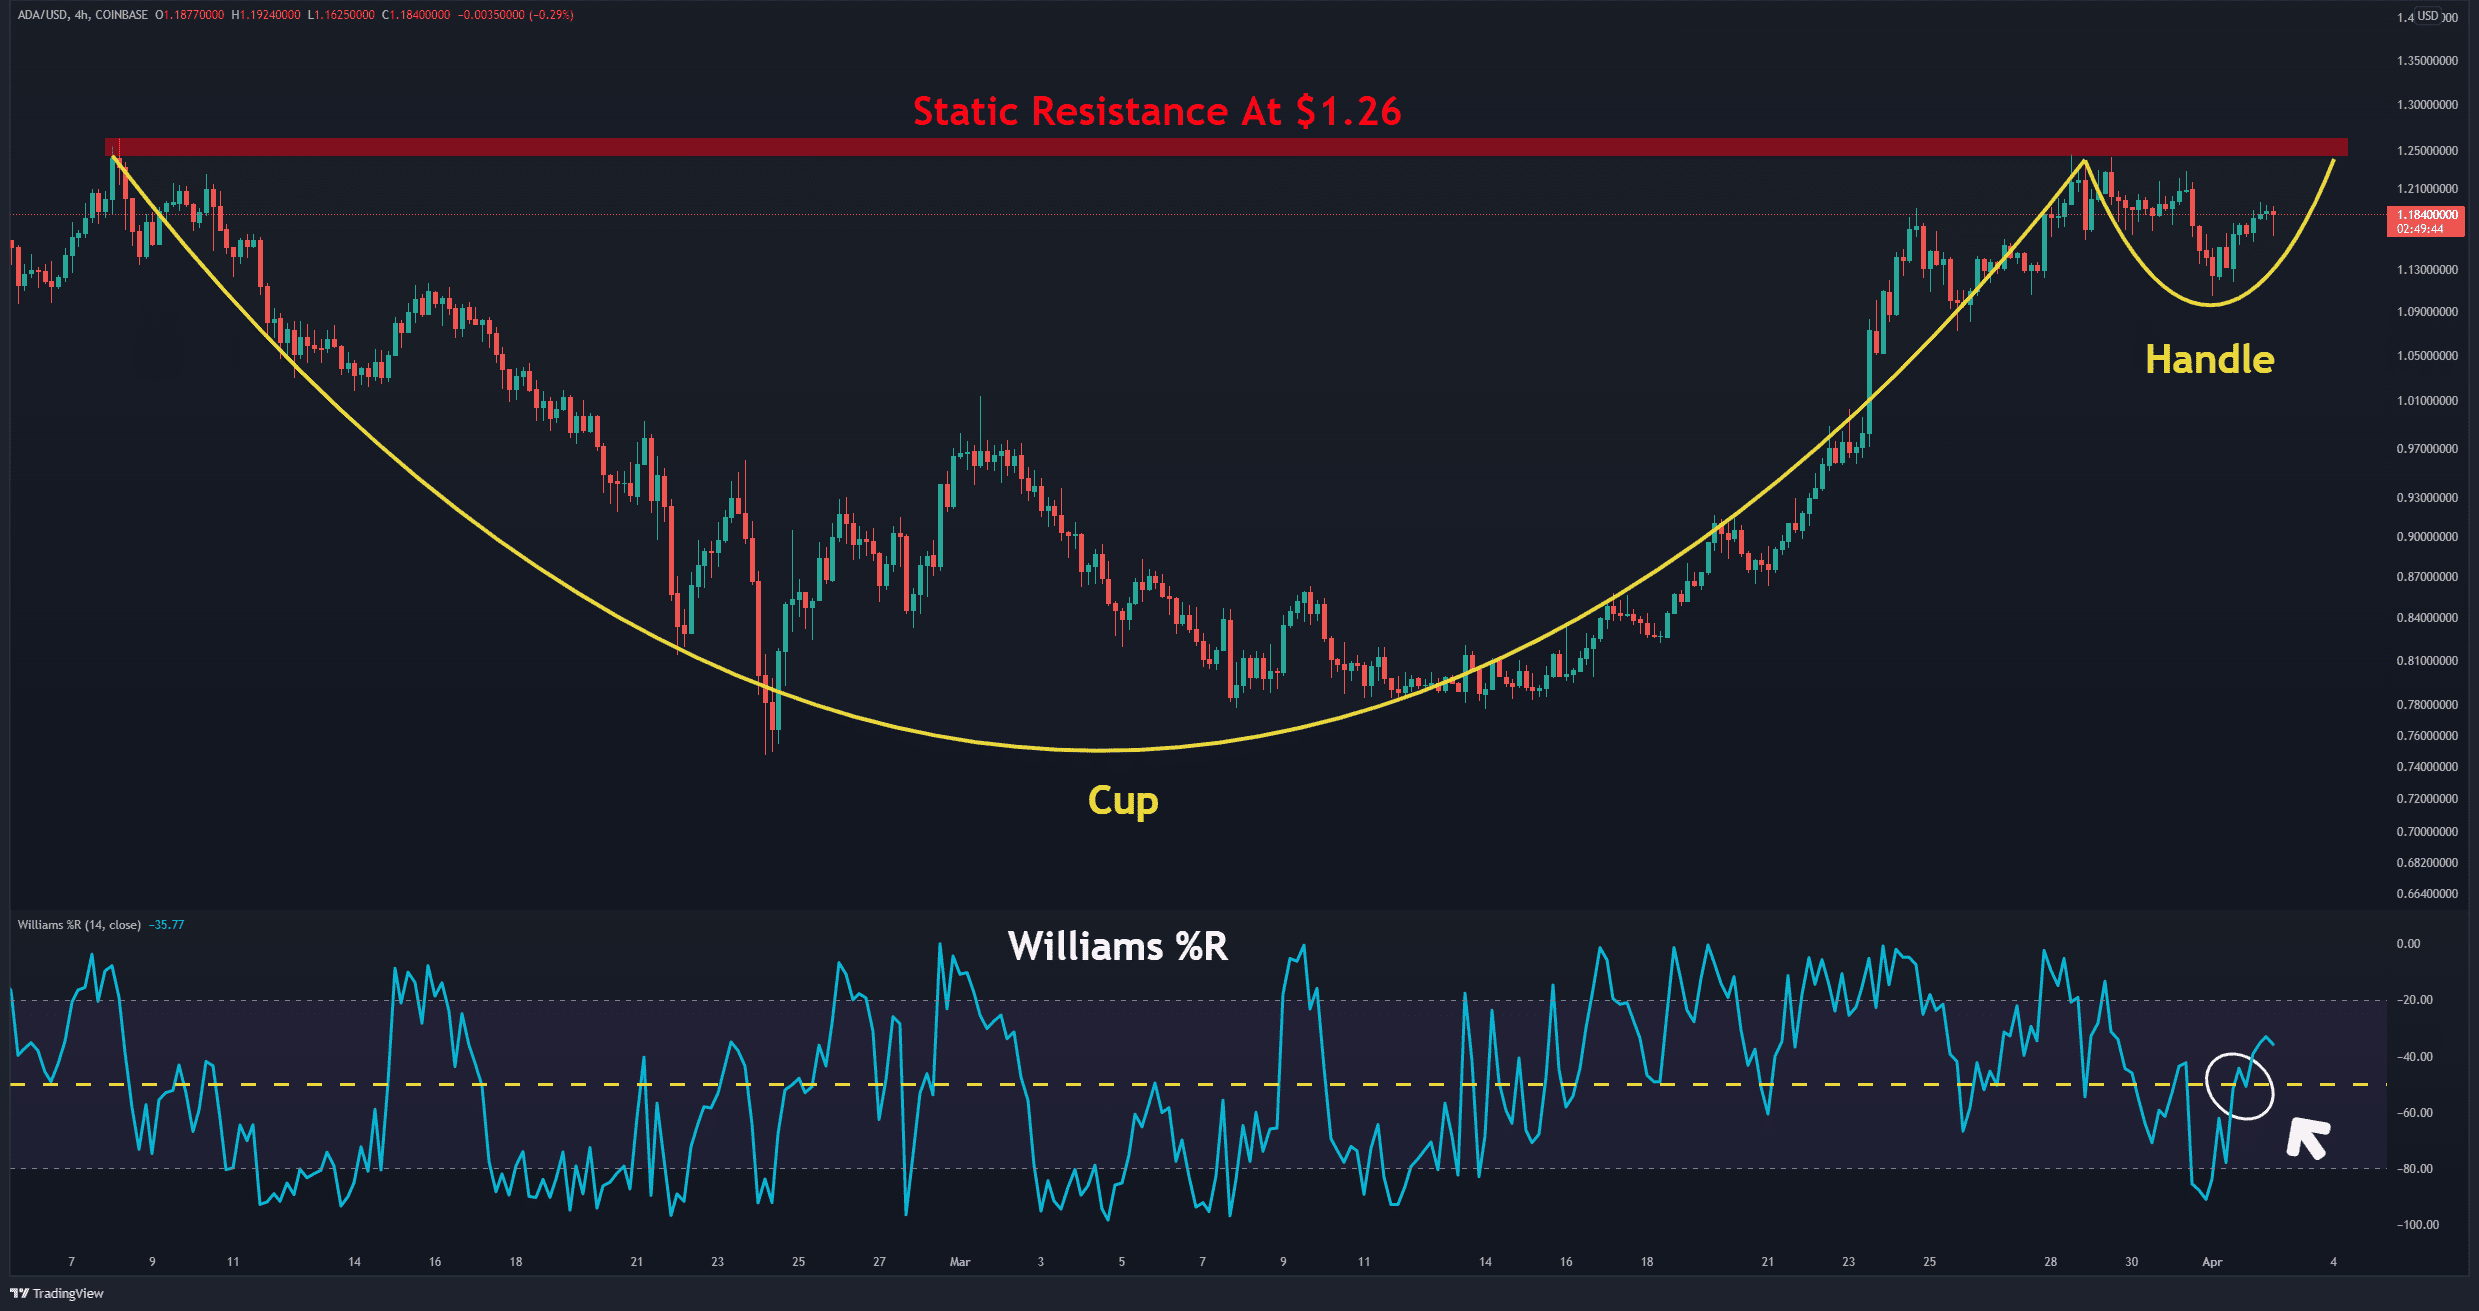
The 4-Hour Chart
On the 4-hour timeframe, the resistance at $1.26, which was mentioned above, caused ADA to form a Cup & Handle pattern (marked by yellow).
Williams %R indicator has also entered bullish territory, which is a positive signal.
If the bulls can push the price higher and break this resistance (marked by red), Cardano’s path to the next resistance at $1.5 (MA200) will be smoother.
At the moment, all eyes are on Bitcoin. If BTC can break above the daily MA200 barrier and continue its upward path, the whole market will probably follow.