After a few weeks of consolidation, Bitcoin was unable to increase and eventually broke to the downside. This resulted in a considerable liquidation cascade and a drop below the critical support level of K. Technical Analysis Technical Analysis Shayan The Daily Chart The market has now tapped the resting liquidity below the significant demand zone around K, but there are no signs of a reversal yet. Furthermore, the next support level for Bitcoin is K-K. The RSI indicator, on the other hand, has crossed into the oversold zone and is seeking to break above it. This might signal a short-term reversal to the previously broken K-K level. The bears, on the other hand, have complete power, and a collapse to the K-K demand zone remains possible. Source:
Topics:
CryptoVizArt considers the following as important: Bitcoin (BTC) Price, BTC Analysis, BTCEUR, BTCGBP, btcusd, btcusdt
This could be interesting, too:
Chayanika Deka writes XRP, SOL, and ADA Inclusion in US Crypto Reserve Pushes Traders on Edge
Chayanika Deka writes Why Arthur Hayes Is Bullish on Bitcoin Under Trump’s Economic Strategy
Mandy Williams writes Why the Bitcoin Market Is Stuck—and the Key Metric That Could Change It: CryptoQuant CEO
Wayne Jones writes Metaplanet Acquires 156 BTC, Bringing Total Holdings to 2,391
After a few weeks of consolidation, Bitcoin was unable to increase and eventually broke to the downside. This resulted in a considerable liquidation cascade and a drop below the critical support level of $30K.
Technical Analysis
Technical Analysis Shayan
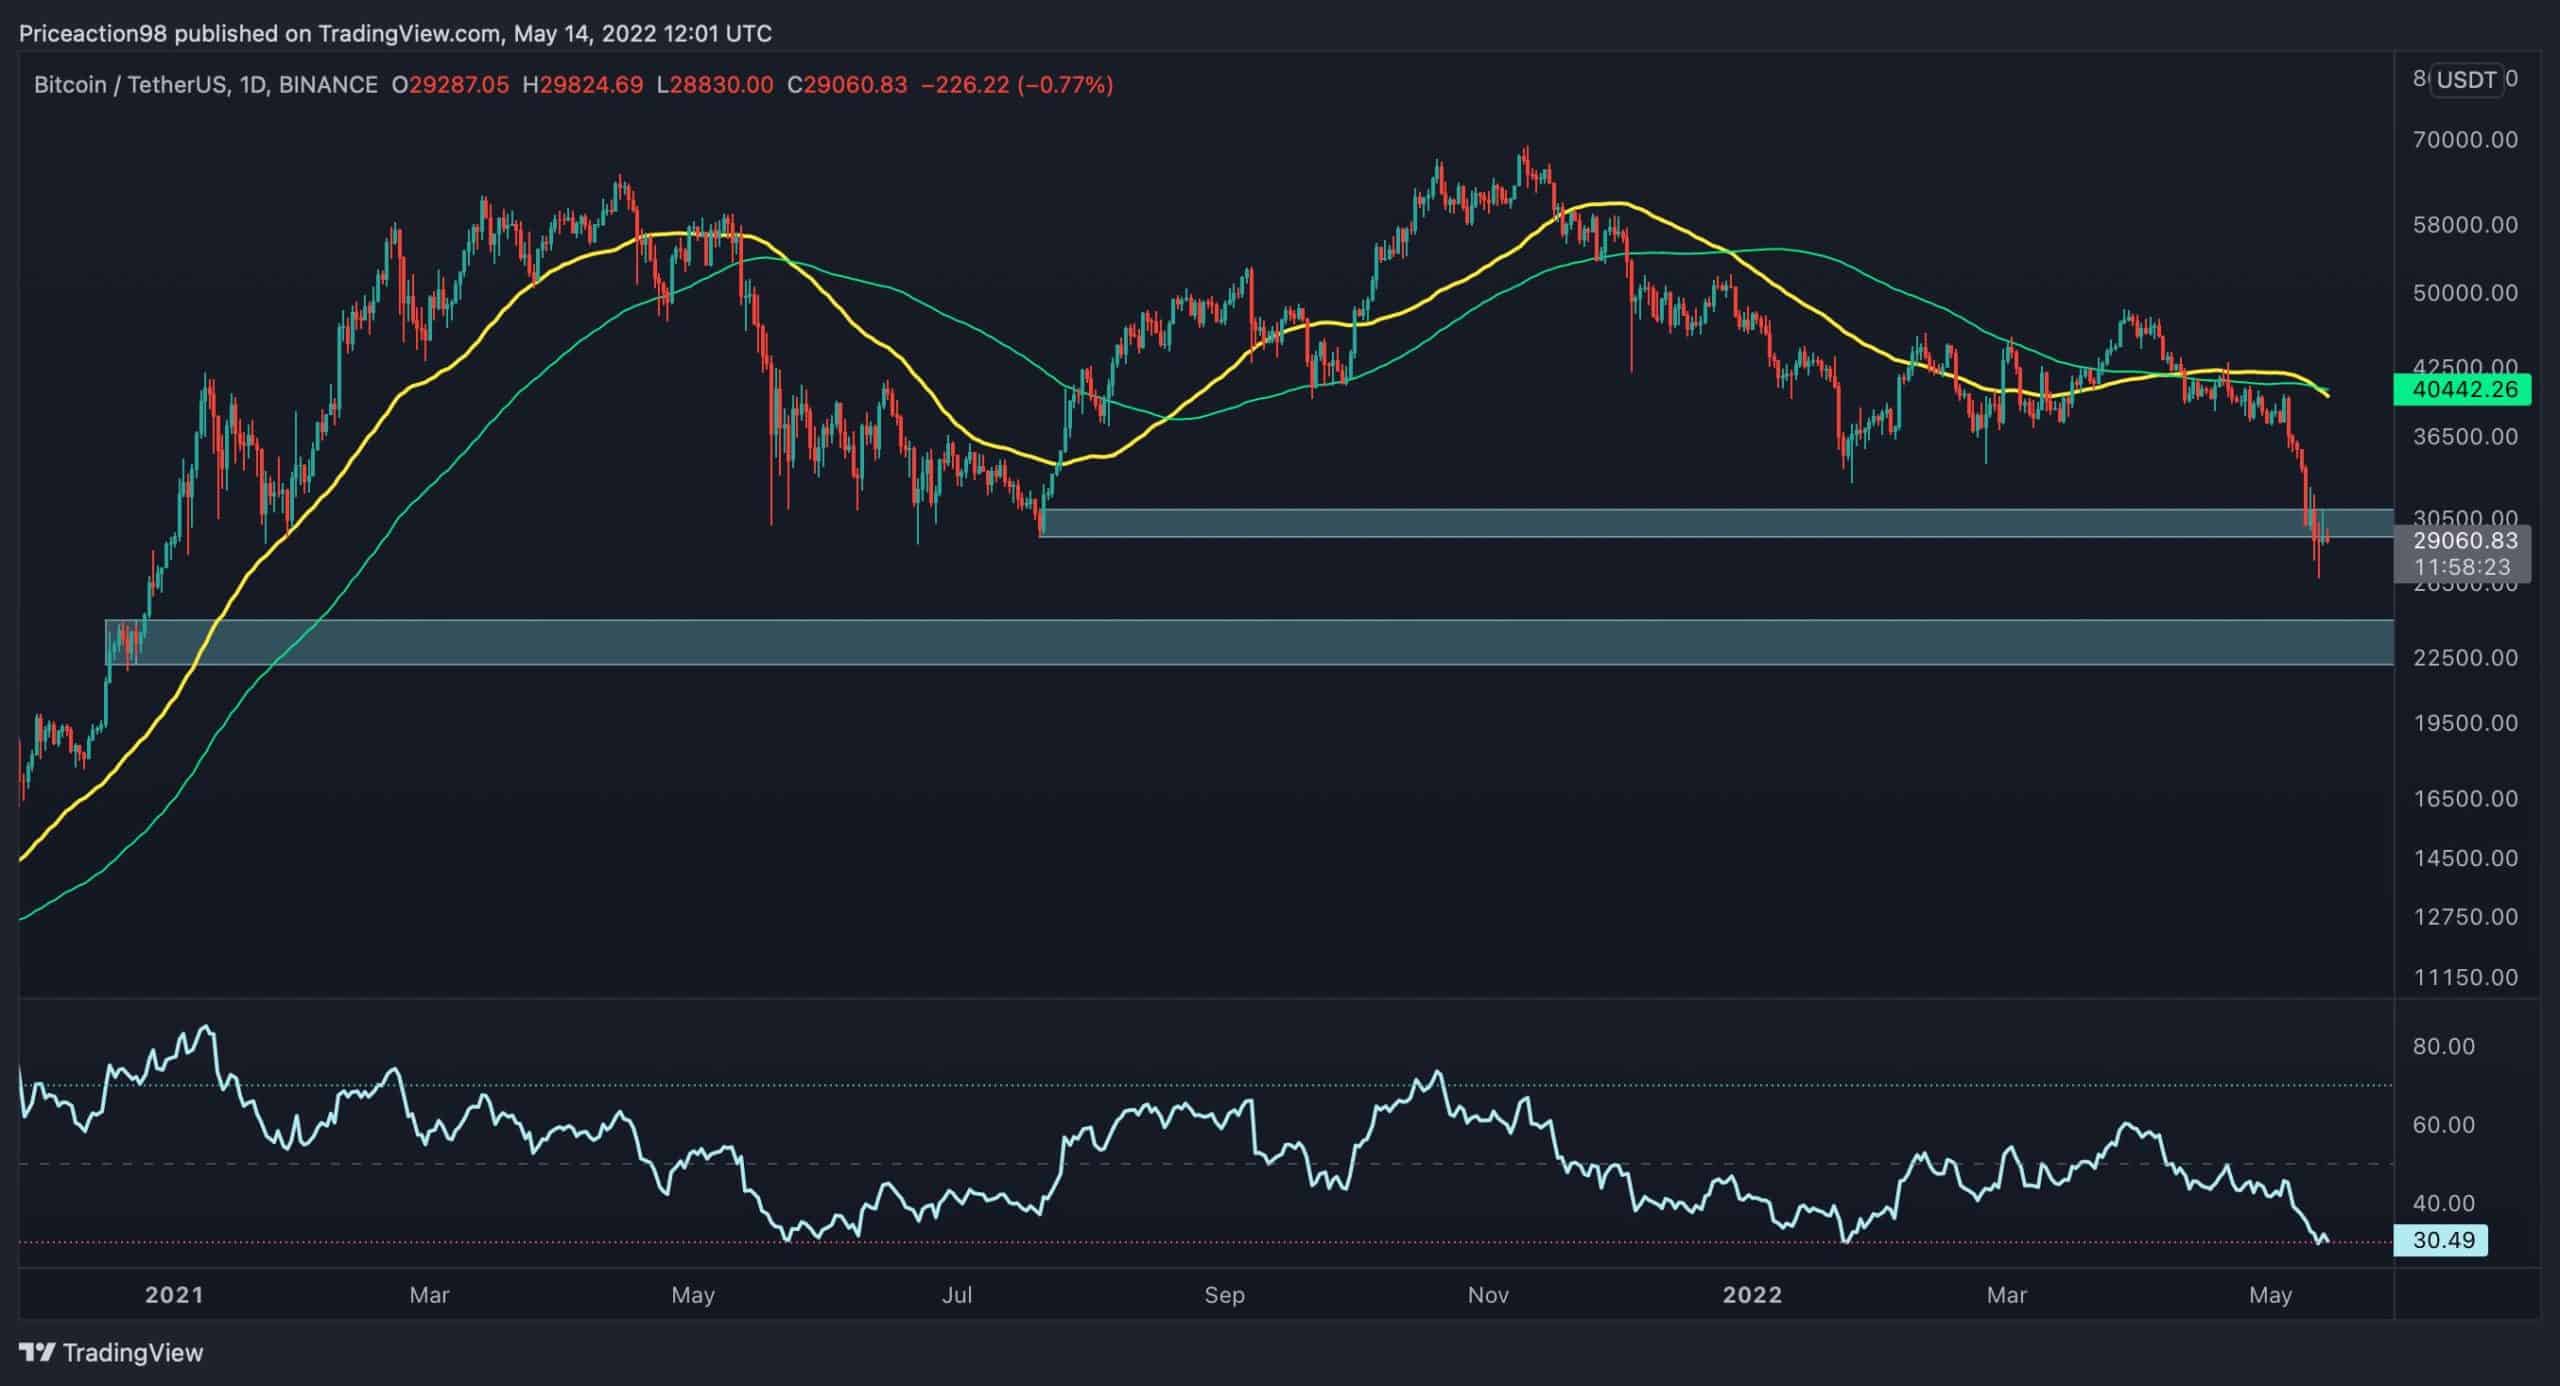
The Daily Chart
The market has now tapped the resting liquidity below the significant demand zone around $30K, but there are no signs of a reversal yet. Furthermore, the next support level for Bitcoin is $24K-$25K.
The RSI indicator, on the other hand, has crossed into the oversold zone and is seeking to break above it. This might signal a short-term reversal to the previously broken $30K-$32K level. The bears, on the other hand, have complete power, and a collapse to the $24K-$25K demand zone remains possible.
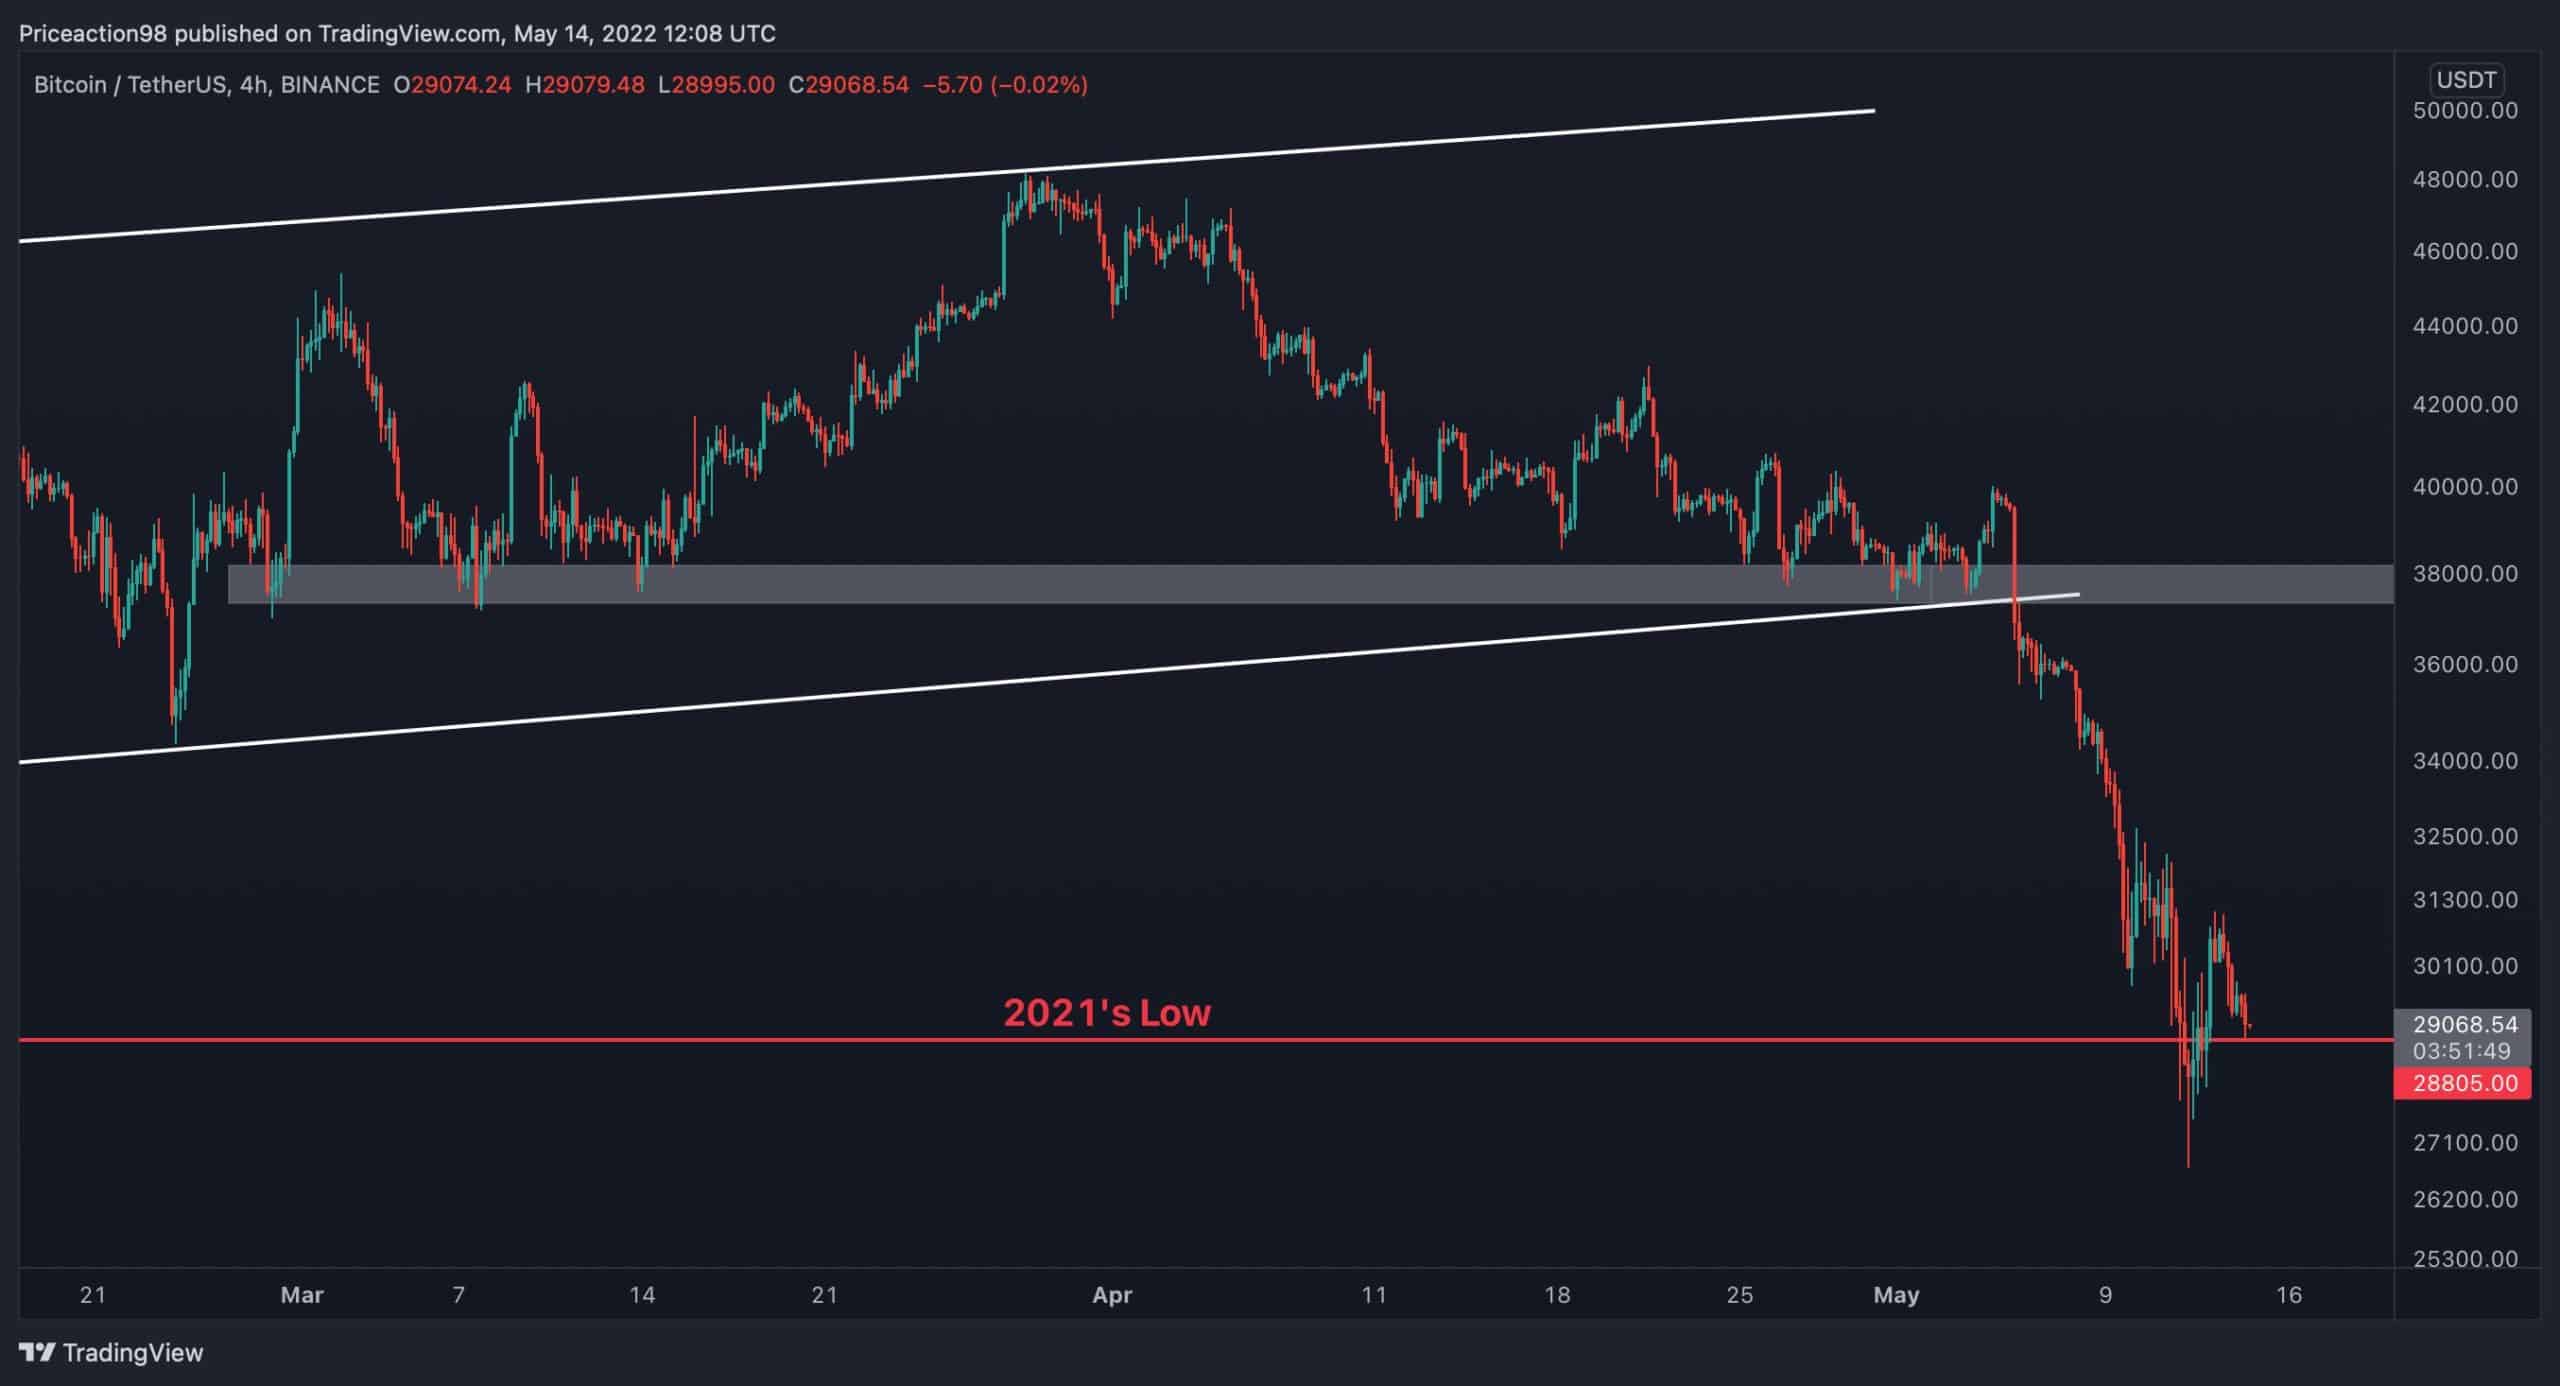
The 4-Hour Chart
Corrections are always present in a sustainable rally. After a massive bearish decline from $69K, Bitcoin has been building a continuation correction flag pattern and has lately broken below the lower trendline resulting in a massive cascade in the market. The price has finally broken the 2021’s low and registered a local bottom at $26K.
The last significant support at $37K has now become a key resistance level for the price, while the next support will be at the $24K-$25K demand region. Short-term consolidation and a range phase followed by choppy price action appear to be more likely in the coming weeks.
On-chain Analysis
By Shayan
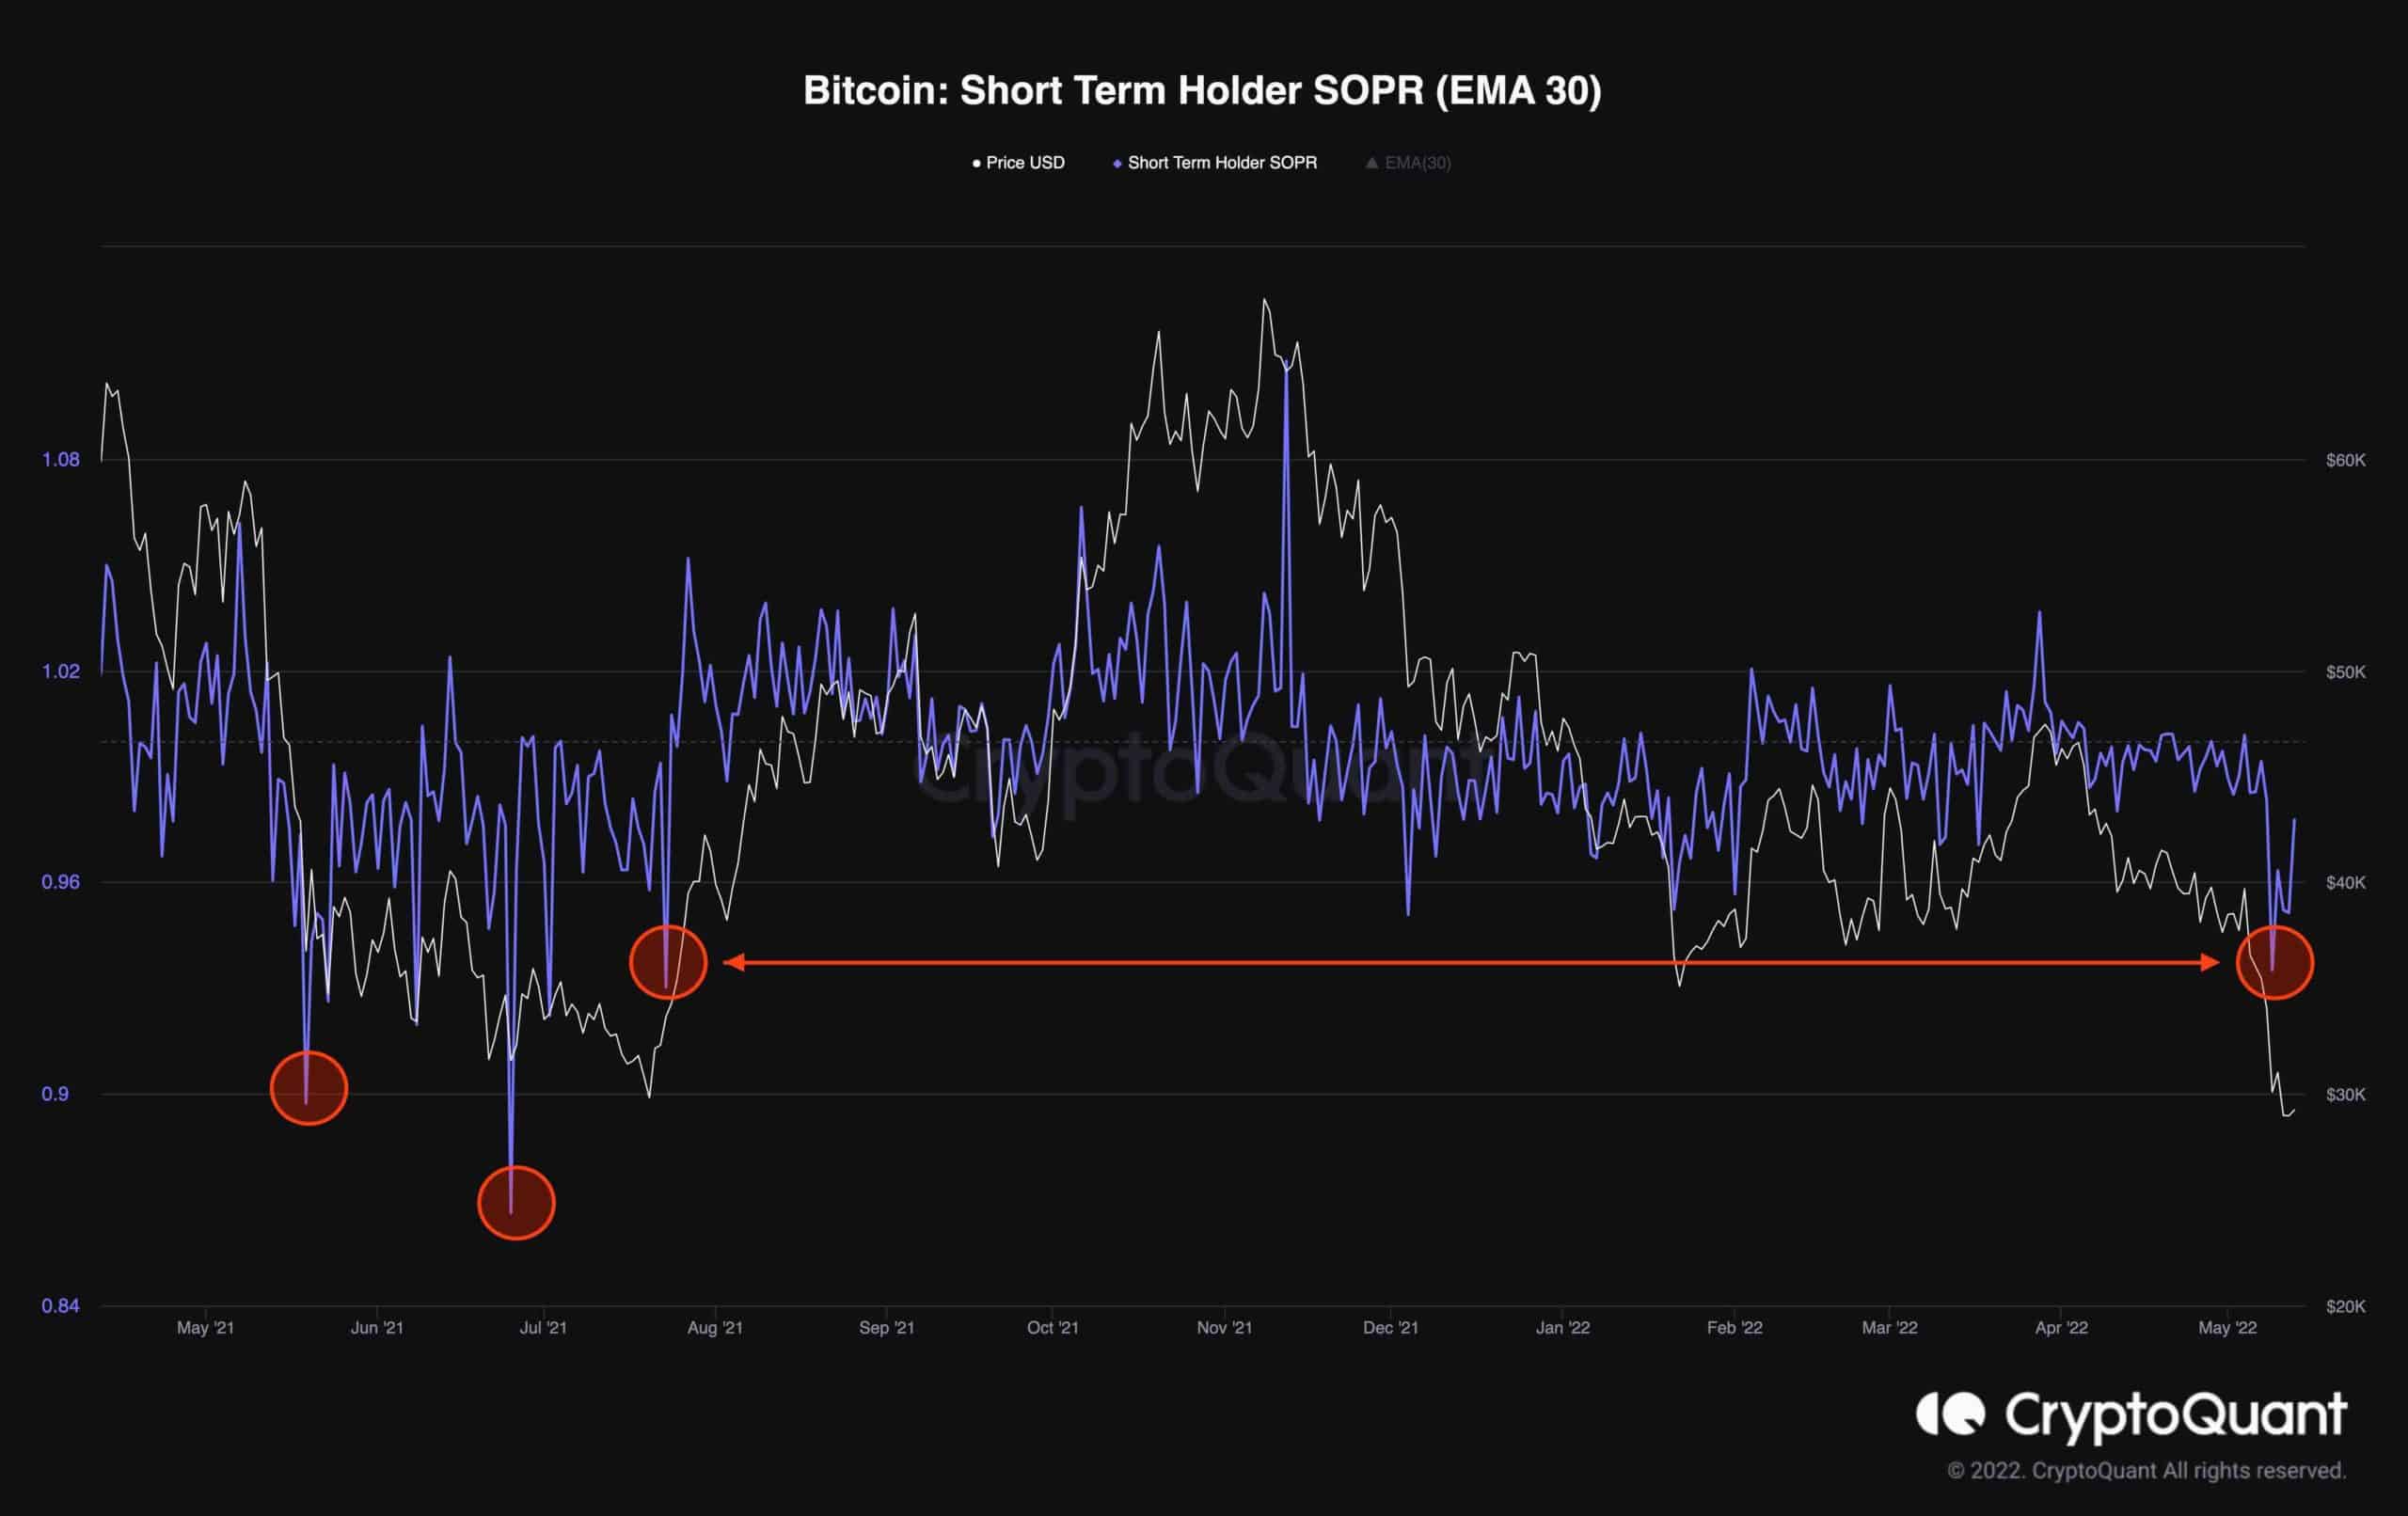
Bitcoin’s price collapsed to $26K recently. The Short-Term Holder SOPR has plummeted to a multi-month low, resulting in a severe crash, as shown in the chart.
The same situation occurred in July 2021, when Bitcoin plummeted to $29K before rebounding to a new high following the final capitulation. The STH-SOPR indicator, on the other hand, showed lower levels during the capitulation phase in May 2021 than it does presently. As a result, the market is in a state of panic and uncertainty, meaning that the pain might not be over yet.