Following the last red days, ETH has hit the support area between the white descending line and the price range at ,220-,280 (in green). So far, the bulls have successfully maintained the high selling pressure; however, the situation is still fragile. Looking at the bullish case, ETH must close above the key resistance at ,420 (in red). The first target of such a movement can be considered at 50. However, the danger is still here, and if the support range at 20 breaks, ETH is likely going for a retest of around K. Key Support Levels: 20 & 00 Key Resistance Levels: 20 & 50 Daily Moving Averages: MA20: 13MA50: 20MA100: 72MA200: 04 The ETH/BTC Chart Against BTC, ETH found support amid the 0.067 BTC level (in green) and was able to
Topics:
CryptoVizArt considers the following as important: ETH Analysis, ETHBTC, Ethereum (ETH) Price, ethusd
This could be interesting, too:
Mandy Williams writes Ethereum Derivatives Metrics Signal Modest Downside Tail Risk Ahead: Nansen
Jordan Lyanchev writes Weekly Bitcoin, Ethereum ETF Recap: Light at the End of the Tunnel for BTC
CryptoVizArt writes Will Weak Momentum Drive ETH to .5K? (Ethereum Price Analysis)
Jordan Lyanchev writes Bybit Hack Fallout: Arthur Hayes, Samson Mow Push for Ethereum Rollback
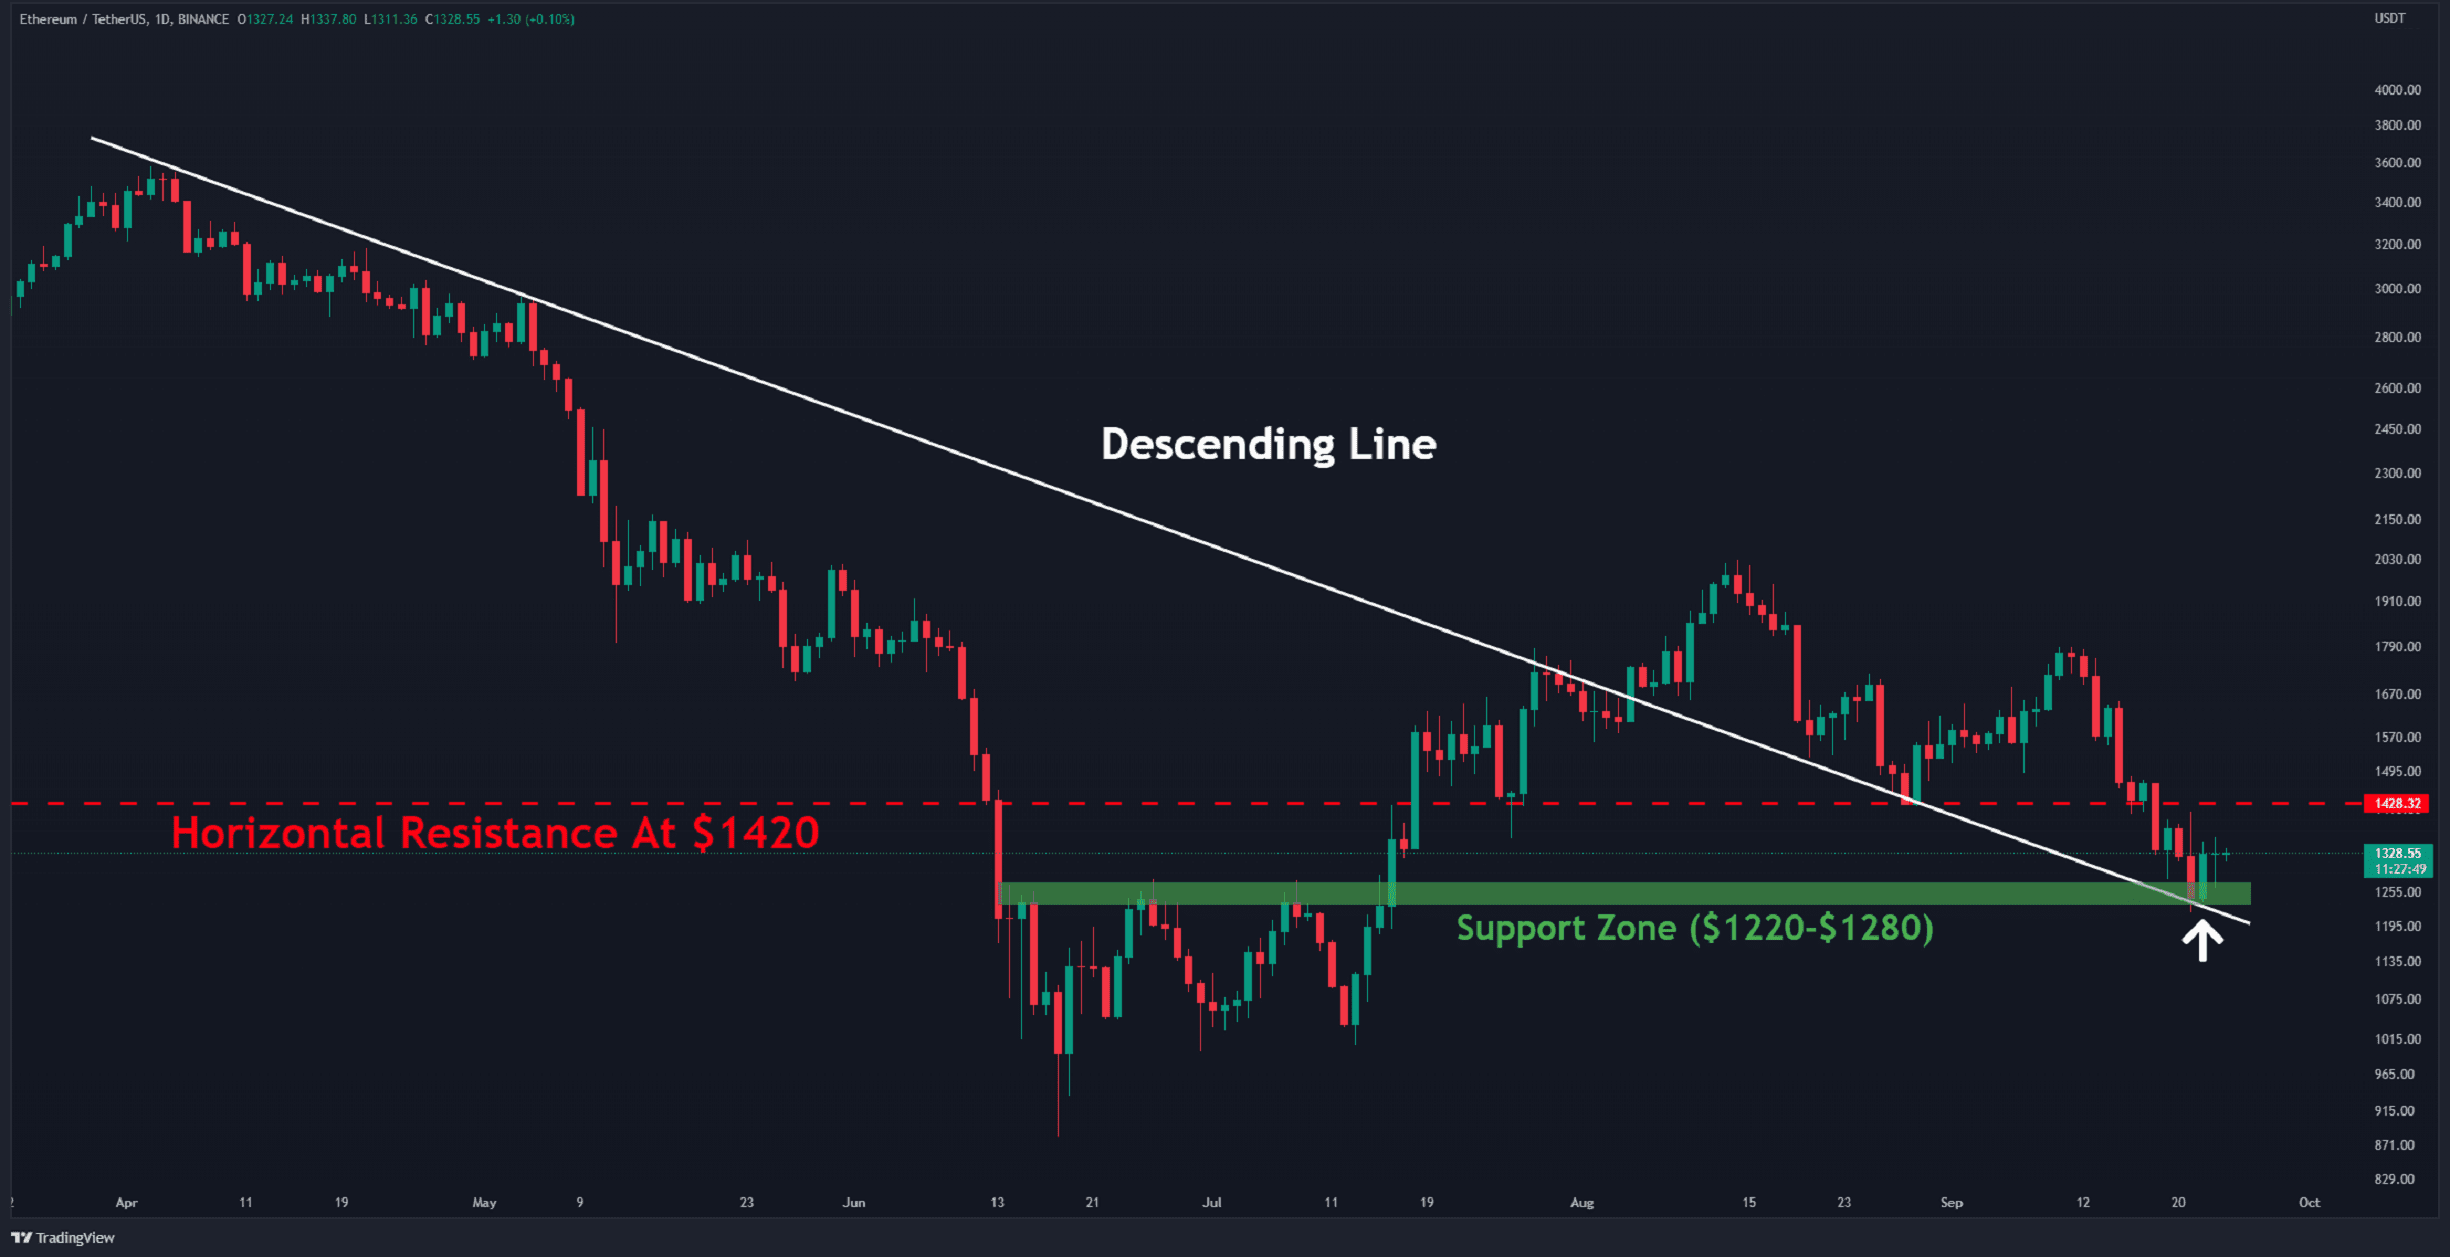
Following the last red days, ETH has hit the support area between the white descending line and the price range at $1,220-$1,280 (in green). So far, the bulls have successfully maintained the high selling pressure; however, the situation is still fragile.
Looking at the bullish case, ETH must close above the key resistance at $1,420 (in red). The first target of such a movement can be considered at $1650. However, the danger is still here, and if the support range at $1220 breaks, ETH is likely going for a retest of around $1K.
Key Support Levels: $1220 & $1000
Key Resistance Levels: $1420 & $1650
Daily Moving Averages:
MA20: $1513
MA50: $1620
MA100: $1472
MA200: $2004
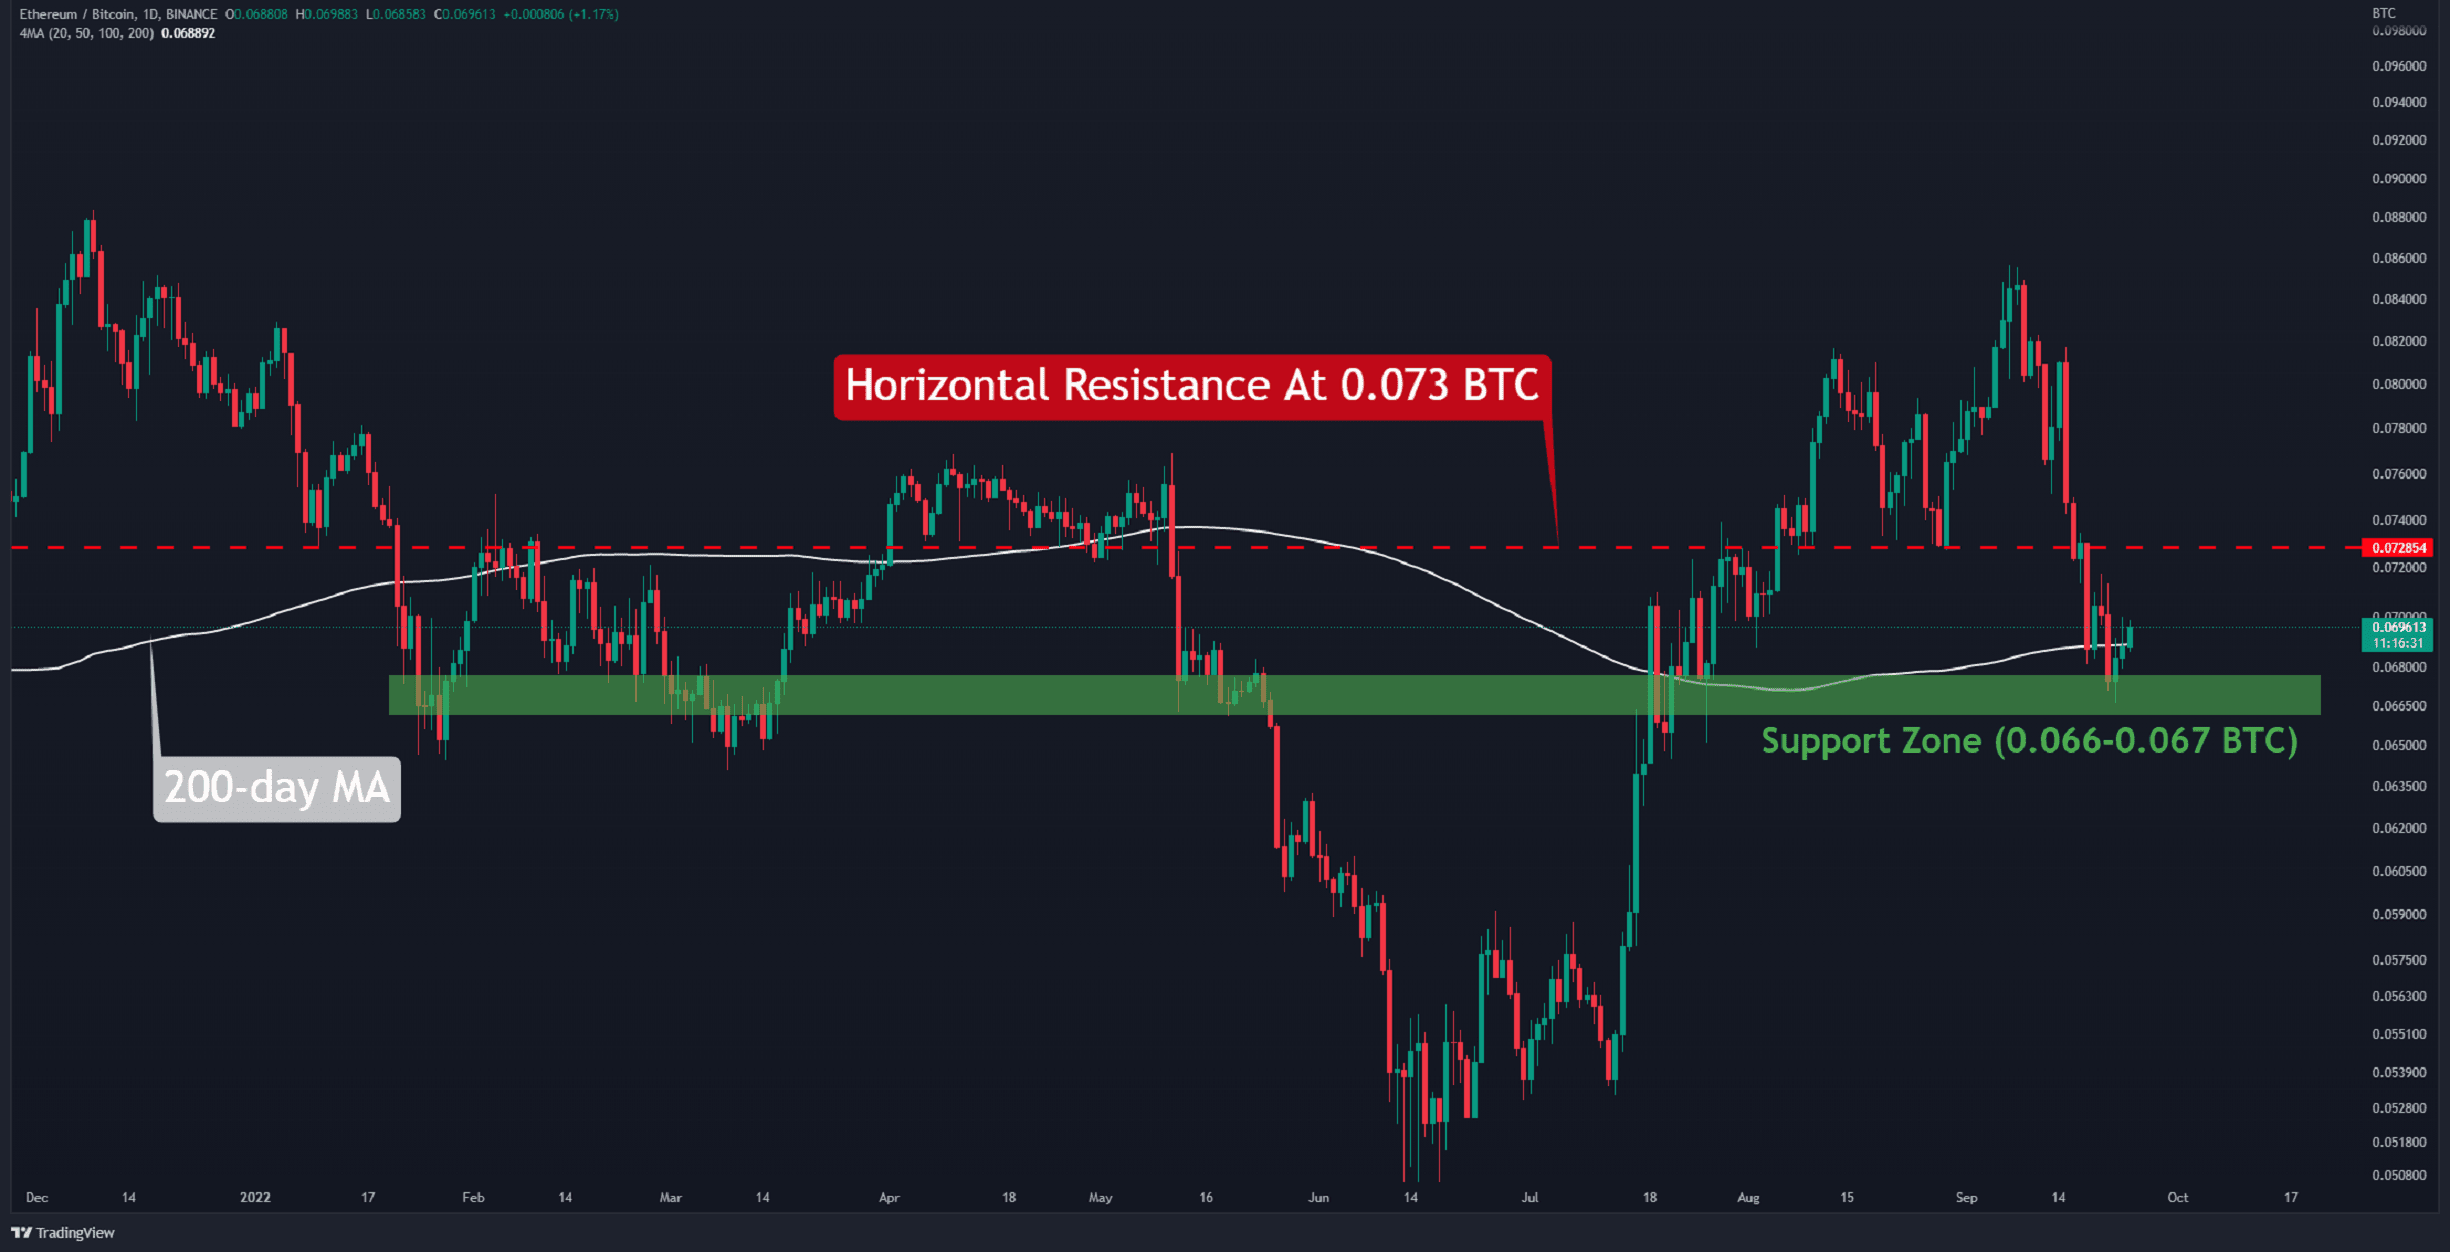
The ETH/BTC Chart
Against BTC, ETH found support amid the 0.067 BTC level (in green) and was able to reclaim the significant 200-day moving average line (in white).
ETH must break above the 0.073 BTC key resistance (in red) to turn back onto the bullish track. Due to Ethereum’s decline below the most recent bottom, both against USD and BTC, a bearish continuation is a more likely scenario right now.
The recovery towards new highs may take some time because of the current negative sentiment.
Key Support Levels: 0.067 & 0.065 BTC
Key Resistance Levels: 0.073 & 0.08 BTC
Technical Analysis By Grizzly
On-chain Analysis
Exchange Outflow (Top10) (SMA 14)
Definition: The total outflow of coins from exchanges – the top 10 transactions.
A high value indicates an increasing number of investors withdrawing large amounts at once. This could suggest a decline in the selling pressure.
