With the Merge taking place a week from now, ETH remains the market leader and outperformed Bitcoin. However, it is clear from the technical chart that there are significant obstacles standing in the path forward. Technical Analysis By Grizzly The Daily Chart Ethereum is moving within a descending channel (in blue) on the daily chart. This resistance line has prevented further growth since registering its all-time high. When the price last hit the channel’s top in August, it suffered a drop to ,422 as a consequence. The scenario for the Relative Strength Index (RSI 30d) is comparable. The descending line (in white) that has formed over the last 12 months is acting as resistance. To fulfill the two important goals — breaking out of the channel and overcoming the
Topics:
CryptoVizArt considers the following as important: ETH Analysis, ETHBTC, Ethereum (ETH) Price, ethusd
This could be interesting, too:
Mandy Williams writes Ethereum Derivatives Metrics Signal Modest Downside Tail Risk Ahead: Nansen
Jordan Lyanchev writes Weekly Bitcoin, Ethereum ETF Recap: Light at the End of the Tunnel for BTC
CryptoVizArt writes Will Weak Momentum Drive ETH to .5K? (Ethereum Price Analysis)
Jordan Lyanchev writes Bybit Hack Fallout: Arthur Hayes, Samson Mow Push for Ethereum Rollback
With the Merge taking place a week from now, ETH remains the market leader and outperformed Bitcoin. However, it is clear from the technical chart that there are significant obstacles standing in the path forward.
Technical Analysis
By Grizzly
The Daily Chart
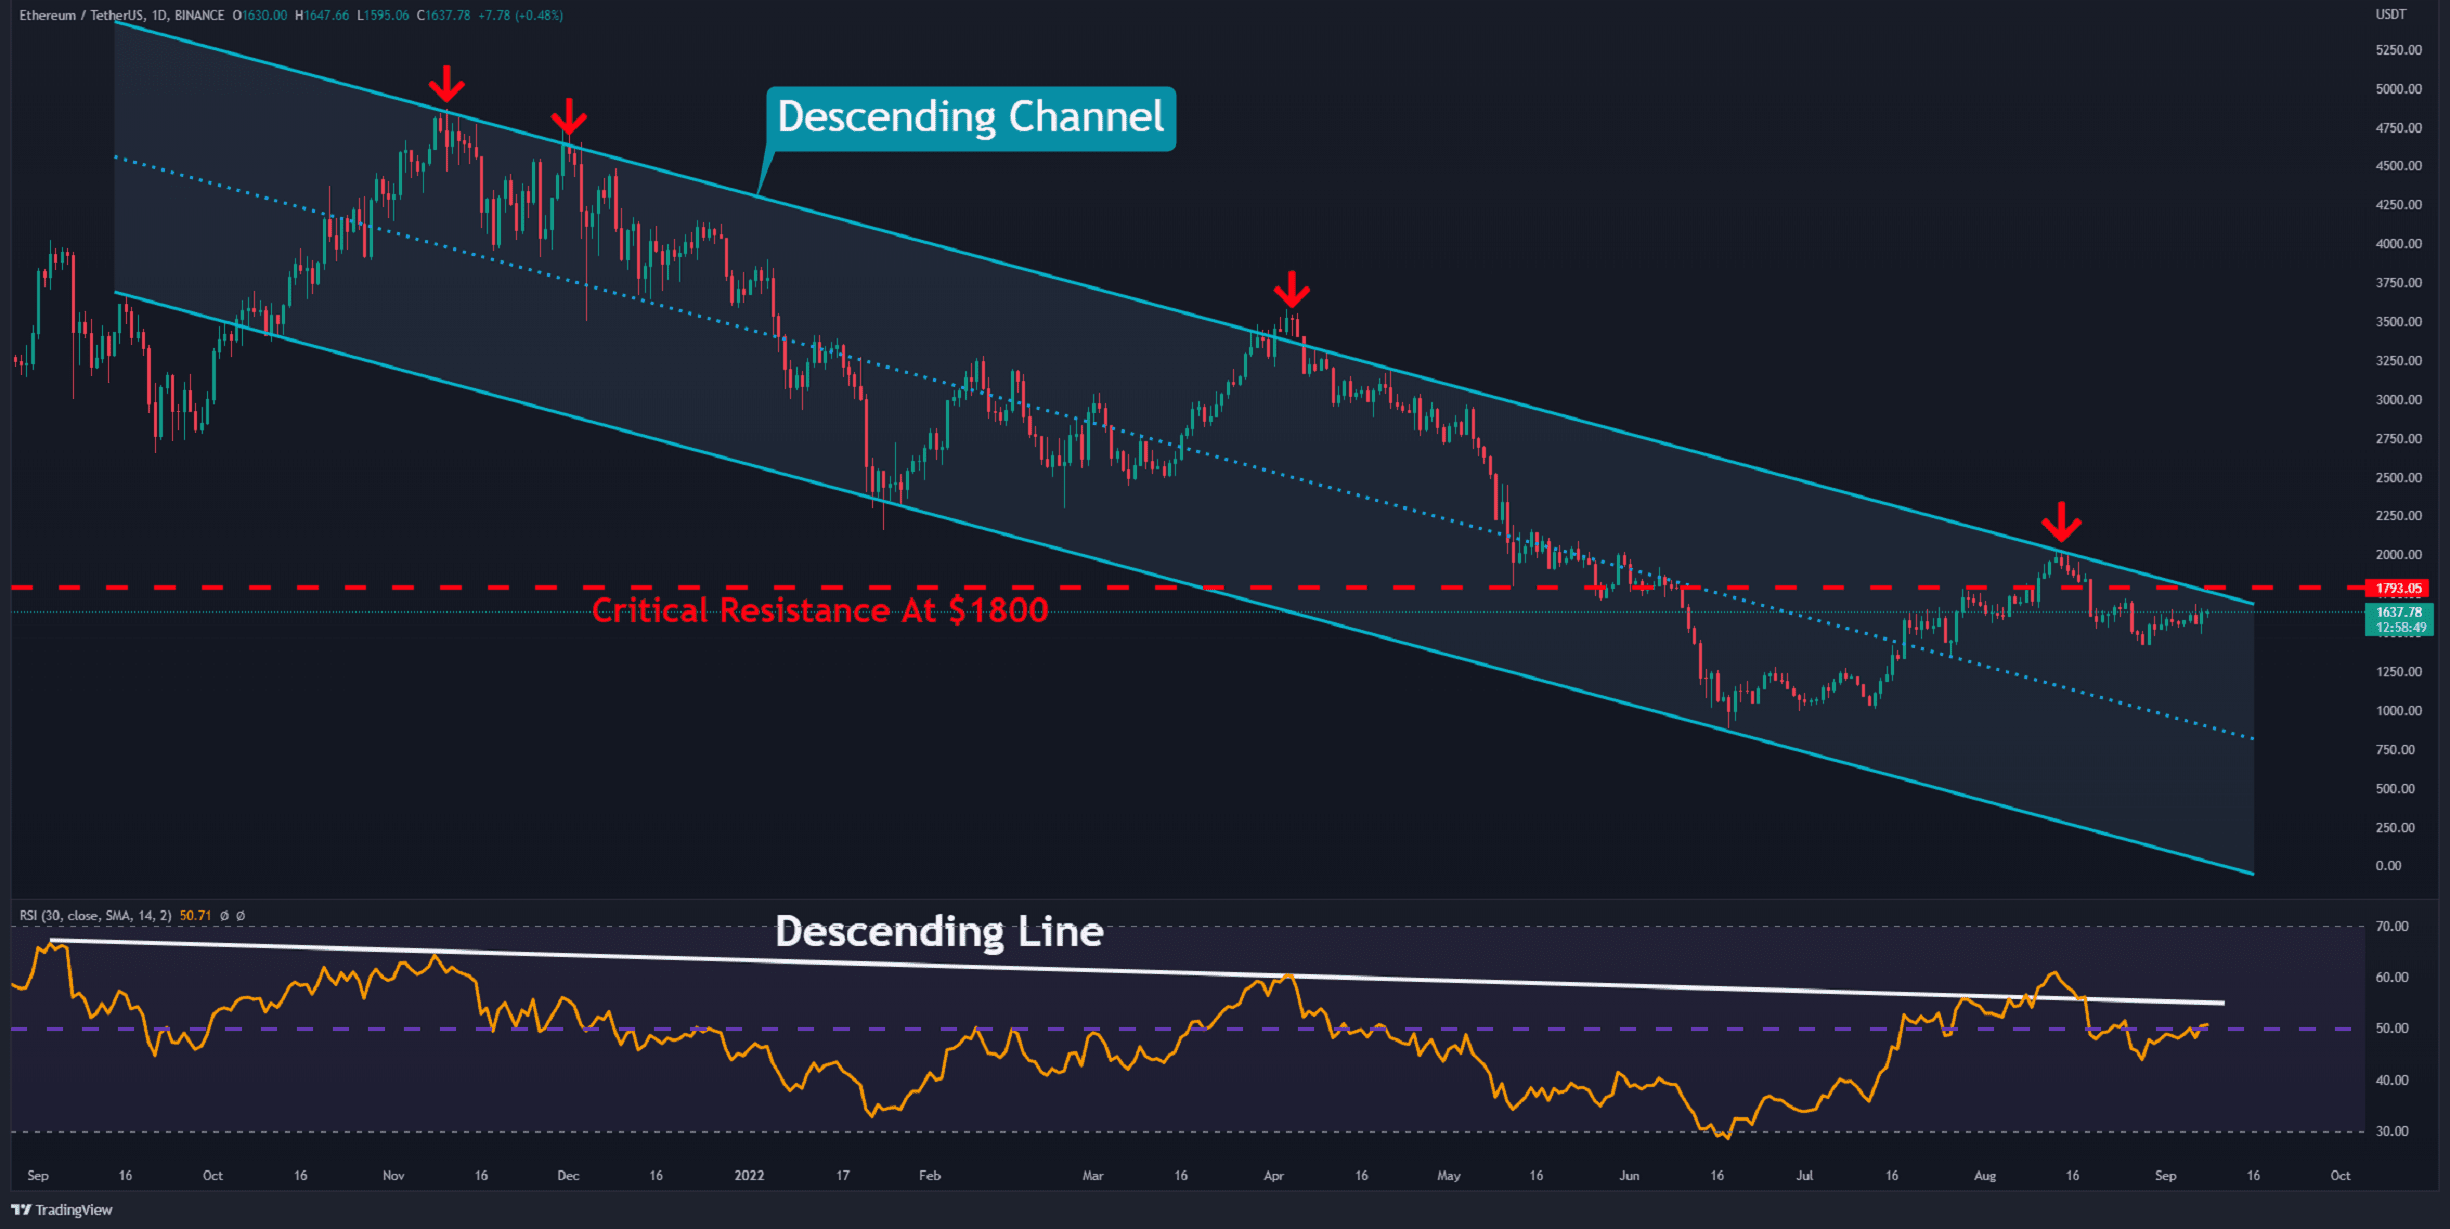
Ethereum is moving within a descending channel (in blue) on the daily chart. This resistance line has prevented further growth since registering its all-time high. When the price last hit the channel’s top in August, it suffered a drop to $1,422 as a consequence.
The scenario for the Relative Strength Index (RSI 30d) is comparable. The descending line (in white) that has formed over the last 12 months is acting as resistance.
To fulfill the two important goals — breaking out of the channel and overcoming the horizontal resistance at $1,800 — the bulls must now drive the price above that level (in red). This coincides with gaining momentum above the descending line in the RSI.
On the other hand, if the Merge turns out to be a sell-the-news event, investors should be ready for heightened pressure that could send the price back to $1350 and even lower.
Key Support Levels: $1420 & $1350
Key Resistance Levels: $1800 & $2100
Daily Moving Averages:
MA20: $1581
MA50: $1660
MA100: $1490
MA200: $2101
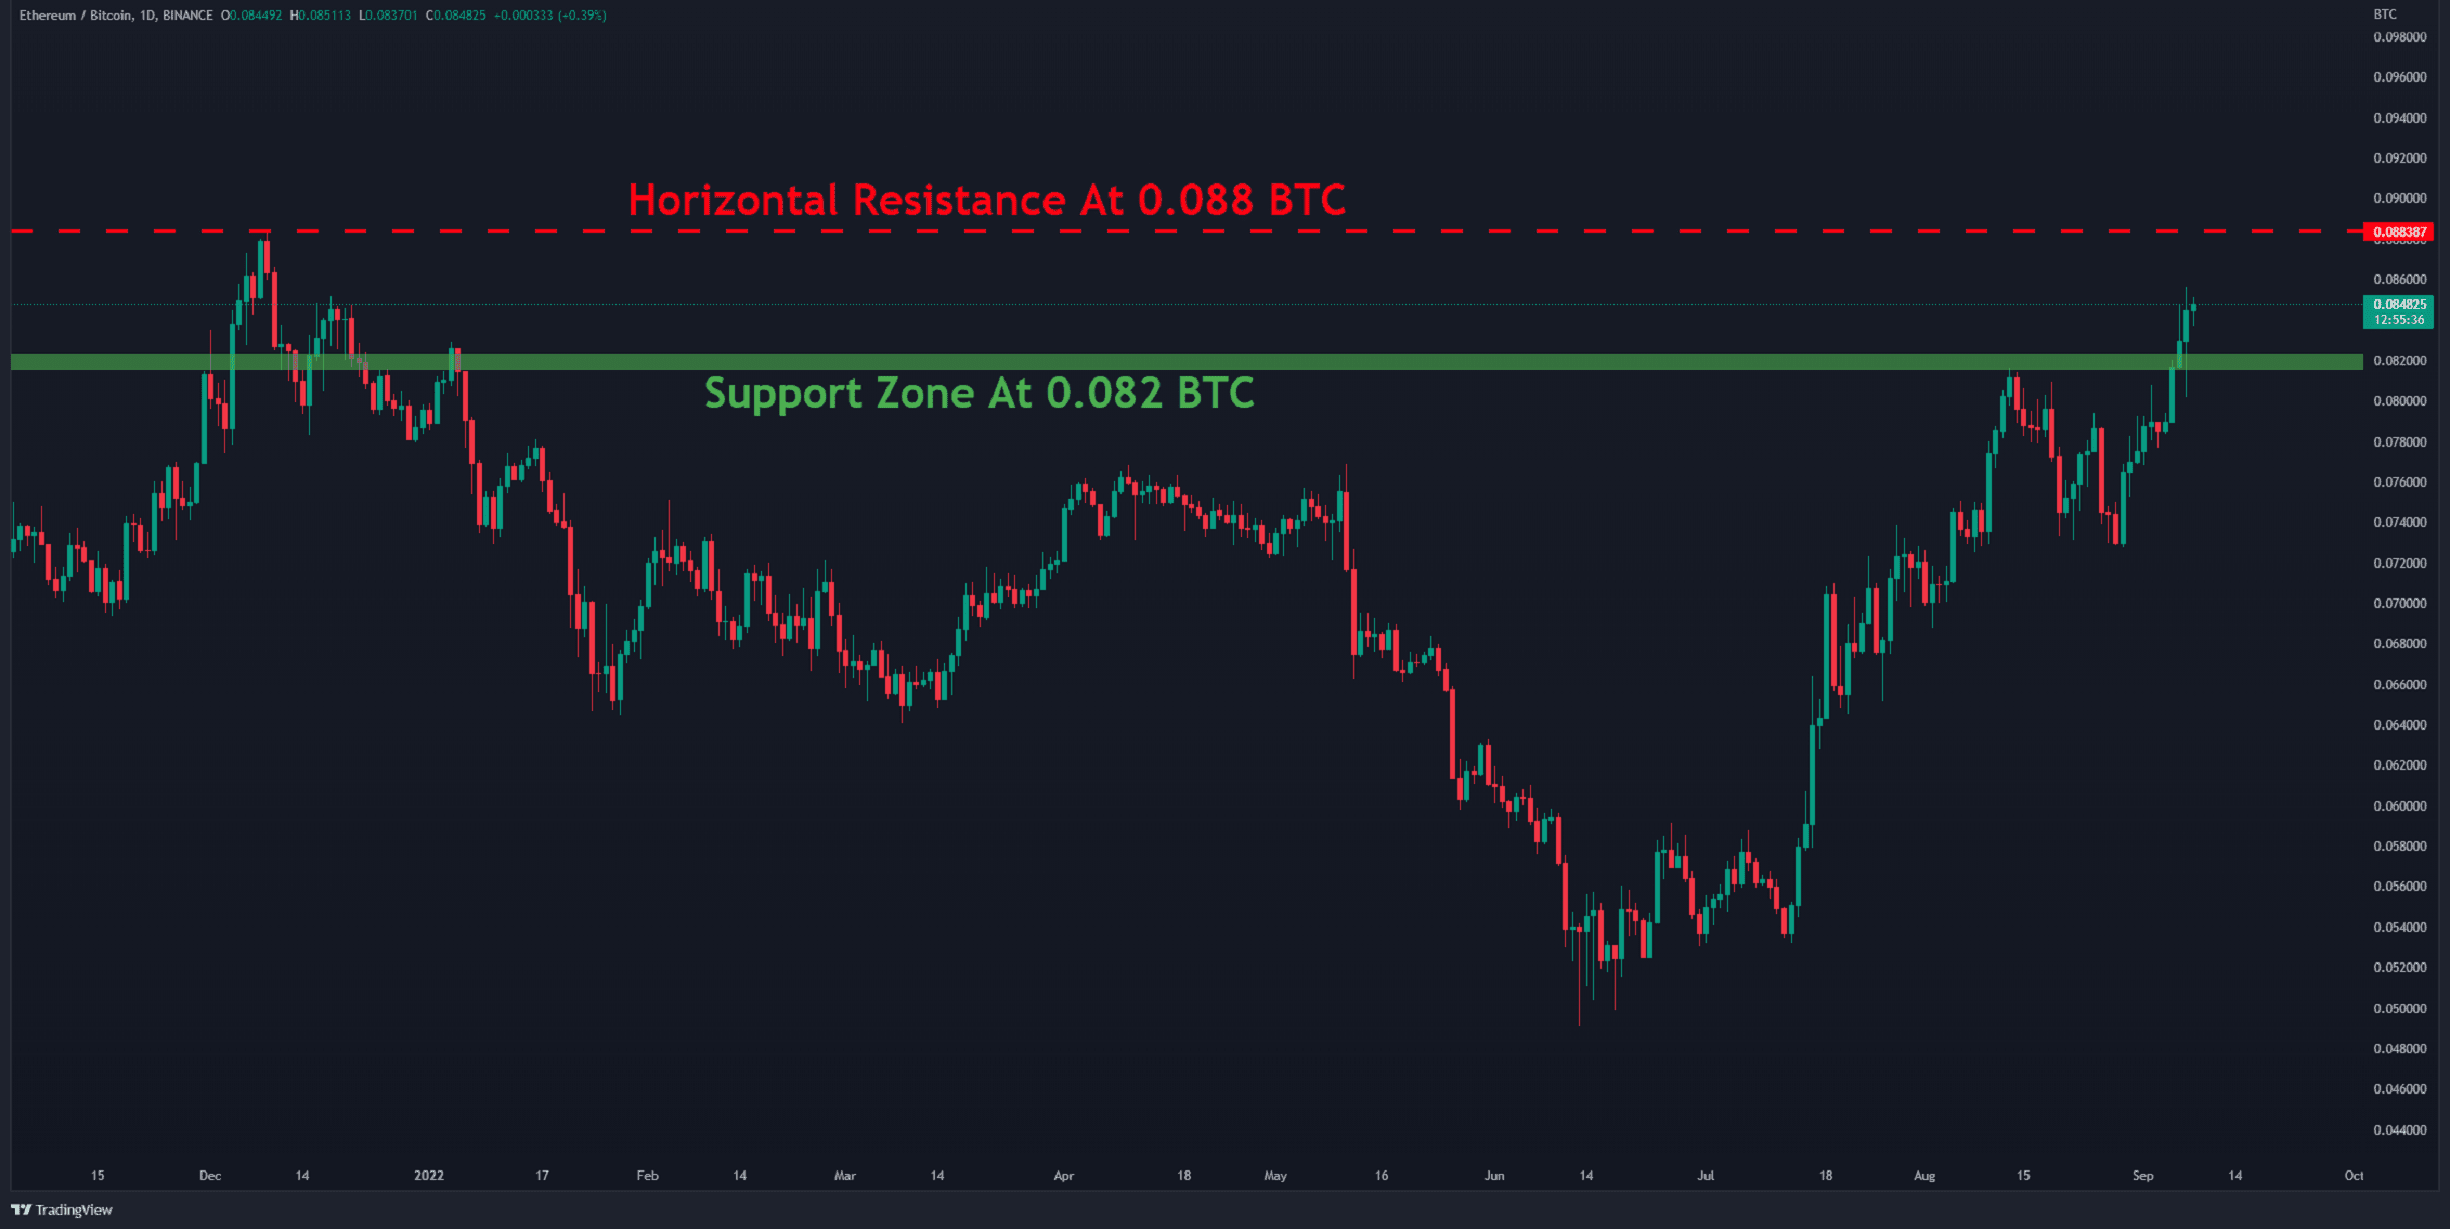
The ETH/BTC Chart
The structure against Bitcoin is bullish as the pair reaches its peak for this year. Buyers could push the price above 0.082 BTC (in green) on their second attempt.
The current trend shows no signs of weakness, and the likelihood of teting 0.088 BTC (in red) would increase significantly if there is no unfavorable news accompanying the Merge.
Key Support Levels: 0.0.0.082 & 0.073 BTC
Key Resistance Levels: 0.088 & 0.093 BTC
On-chain Analysis
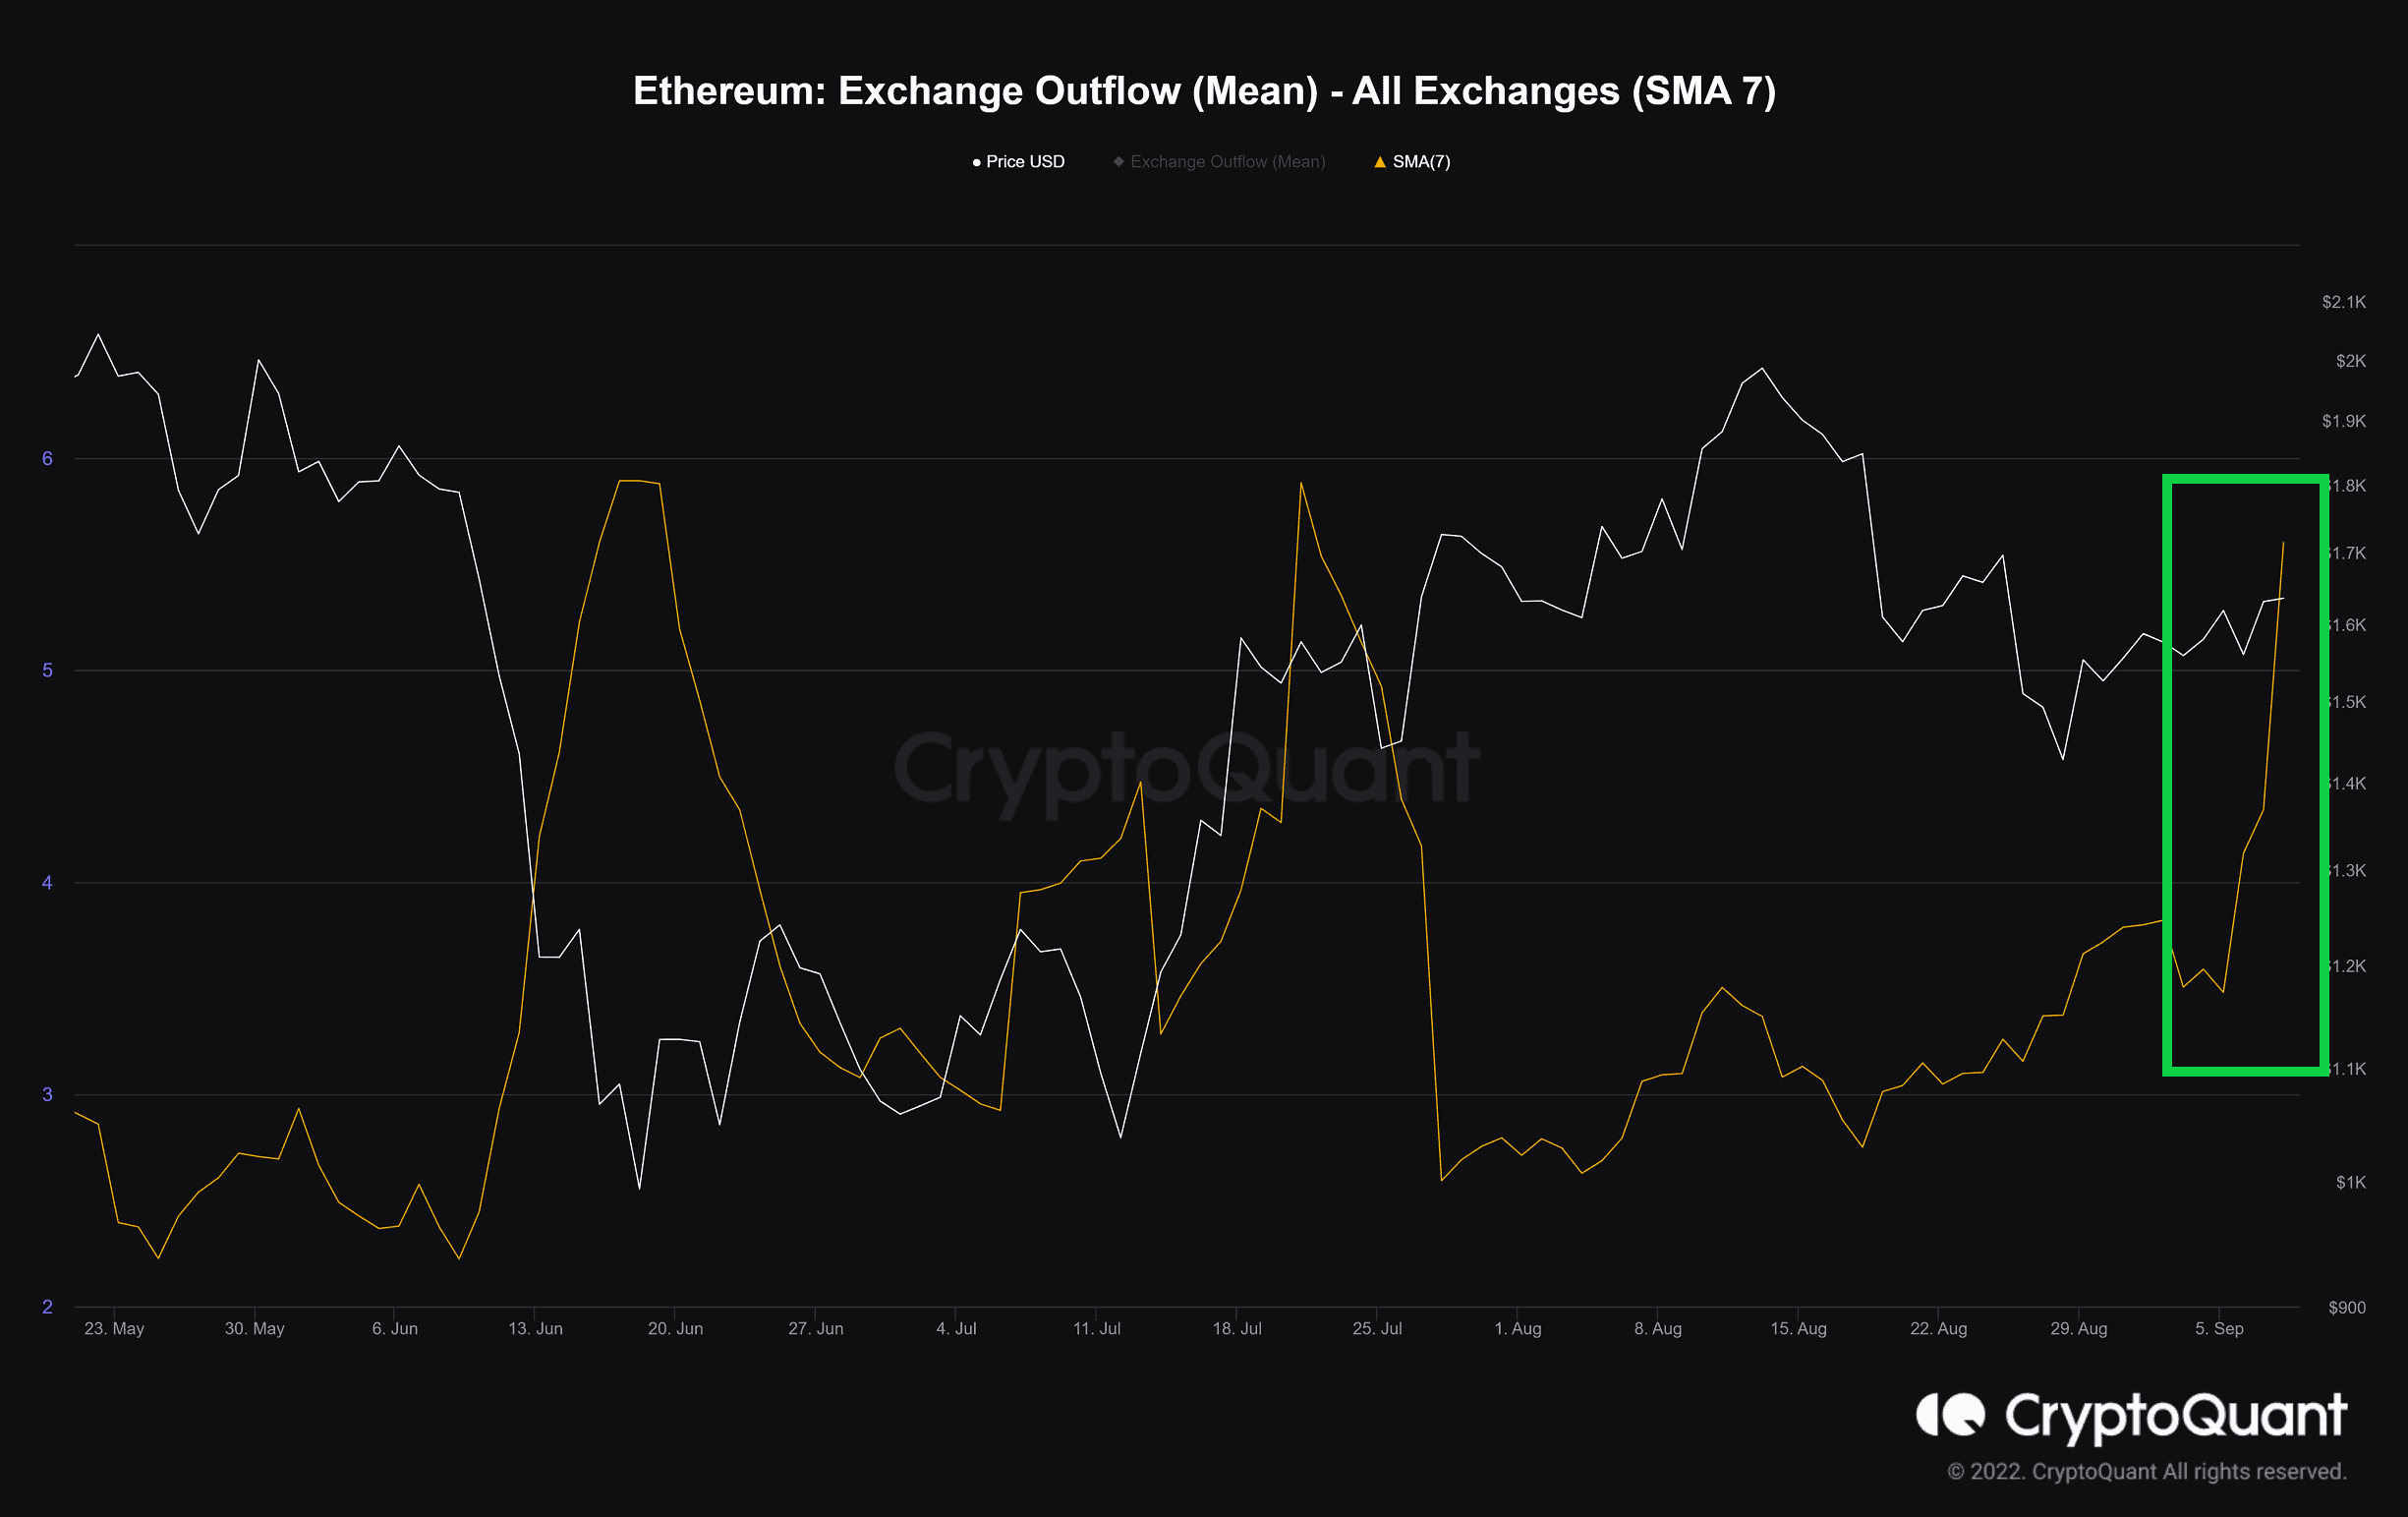
Exchange Outflow (Mean) (SMA 7)
Definition: The mean amount of coins per transaction sent from the exchange.
A high value indicates investors are withdrawing more coins per transaction. It also means decreased selling pressure.
The metric suggests that traders are eager to withdraw their coins from the exchange. As the Merge date approaches, this index, which did not climb considerably during the previous month, increases sharply (in green).
This demonstrates that investors are feeling more optimistic about the impending event. Another motive would be eligibility for ETHPOW.